

Maternal Pre-conception Body Mass Index and Fasting Plasma Glucose With the Risk of Pre-term Birth: A Cohort Study Including 4.9 Million Chinese Women
- PMID: 36304061
- PMCID: PMC9580732
- DOI: 10.3389/frph.2021.622346
Maternal Pre-conception Body Mass Index and Fasting Plasma Glucose With the Risk of Pre-term Birth: A Cohort Study Including 4.9 Million Chinese Women
Abstract
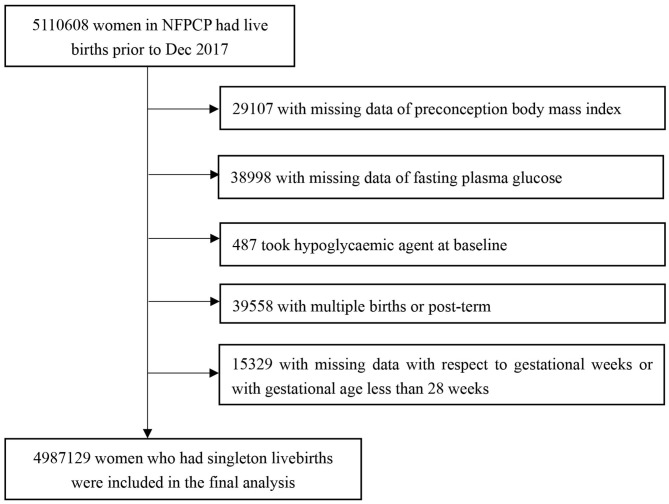
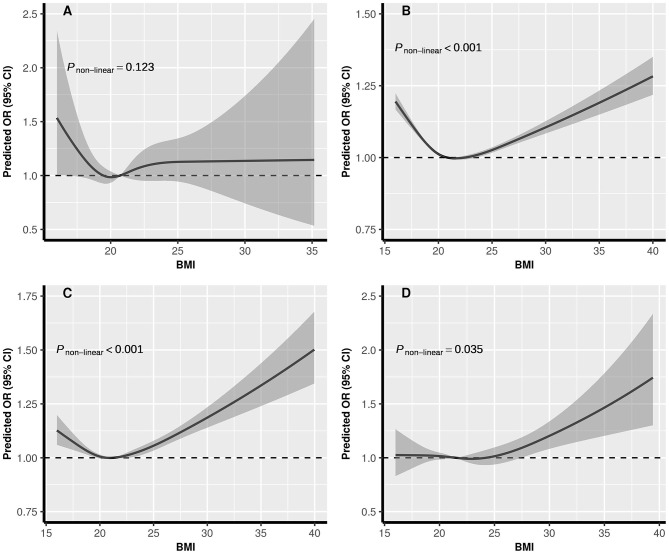
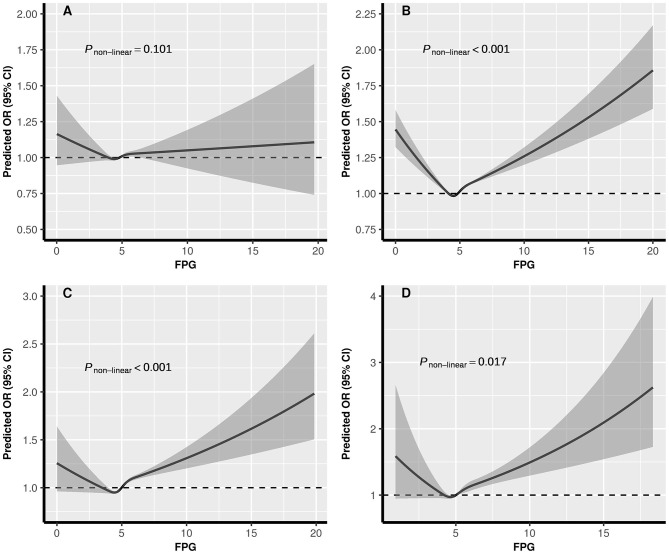
Background: To evaluate the associations of pre-conception body mass index (BMI), fasting plasma glucose (FPG) alone and their combination with pre-term birth (PTB) risk. Methods: We conducted a population-based retrospective cohort study with 4,987,129 reproductive-aged women, who participated in National Free Pre-Pregnancy Checkups Project in 2013-2016 and had a singleton delivery before December 2017 in China. All data analyses were conducted in 2018-2021. Results: A total of 339,662 (6.81%) women had pre-term deliveries. Compared with women with normal weight and normal glucose, underweight and normal weight were associated with PTB among hypoglycemia women, the adjusted odd ratios (aORs) were 1.24 (95% CI: 1.05-1.48) and 1.16 (95% CI: 1.07-1.25), respectively; underweight, overweight and obesity were associated with PTB among women with normal glucose, the aORs were 1.09 (95% CI: 1.08-1.10), 1.06 (95% CI: 1.05-1.07) and 1.08 (95% CI: 1.05-1.12), respectively; all the BMI groups were significantly associated with PTB among women with pre-diabetes or diabetes (P < 0.05). The dose-response relationships of BMI with PTB varied in different FPG level, with U-shaped curve in normal glucose and pre-diabetes women, J-shaped in diabetes women, L-shaped in hypoglycemia women. For FPG with PTB, the dose-response relationships were U-shaped in normal weight, overweight, and obesity women, and L-shaped in underweight women. Conclusion: We found that the associations of PTB with BMI varied with levels of FPG, and associations of PTB with FPG varied with levels of BMI. There was a synergistic effect on PTB risk due to abnormal weight and glycemia besides a conventional main effect derived from either of them. Achieving desirable weight and glucose control before conception should be advised.
Keywords: body mass index; cohort study; fasting plasma glucose; pre-conception; pre-term birth.
Copyright © 2021 Xu, Zhou, Yang, Liu, Wang, Wang, Shen, Xu, Zhang, Yan, Peng, He, Wang, Zhang, Zhang, Ma and Li.
Conflict of interest statement
The authors declare that the research was conducted in the absence of any commercial or financial relationships that could be construed as a potential conflict of interest.
Figures
Similar articles
-
Associations of pre-pregnancy impaired fasting glucose and body mass index among pregnant women without pre-existing diabetes with offspring being large for gestational age and preterm birth: a cohort study in China.BMJ Open Diabetes Res Care. 2021 Feb;9(1):e001641. doi: 10.1136/bmjdrc-2020-001641. BMJ Open Diabetes Res Care. 2021. PMID: 33568359 Free PMC article.
-
Preconception diabetes mellitus and adverse pregnancy outcomes in over 6.4 million women: A population-based cohort study in China.PLoS Med. 2019 Oct 1;16(10):e1002926. doi: 10.1371/journal.pmed.1002926. eCollection 2019 Oct. PLoS Med. 2019. PMID: 31574092 Free PMC article.
-
Pre-pregnancy BMI modifies the associations between triglyceride-glucose index in early pregnancy and adverse perinatal outcomes: a 5-year cohort study of 67,936 women in China.Diabetol Metab Syndr. 2025 Jan 6;16(1):311. doi: 10.1186/s13098-024-01550-2. Diabetol Metab Syndr. 2025. PMID: 39762964 Free PMC article.
-
Association of pre-pregnancy body mass index with adverse pregnancy outcome among first-time mothers.PeerJ. 2020 Oct 14;8:e10123. doi: 10.7717/peerj.10123. eCollection 2020. PeerJ. 2020. PMID: 33088625 Free PMC article.
-
Effect of pre-pregnancy body mass index on neonatal outcomes in women undergoing autologous frozen-thawed embryo transfer.Fertil Steril. 2021 Oct;116(4):1010-1019. doi: 10.1016/j.fertnstert.2021.03.044. Epub 2021 Apr 27. Fertil Steril. 2021. PMID: 33926721
Cited by
-
Preconception hypoglycemia and adverse pregnancy outcomes in Chinese women aged 20-49 years: A retrospective cohort study in China.PLoS Med. 2025 Jul 29;22(7):e1004667. doi: 10.1371/journal.pmed.1004667. eCollection 2025 Jul. PLoS Med. 2025. PMID: 40729125 Free PMC article.
References
-
- Blencowe H, Cousens S, Oestergaard MZ, Chou D, Moller AB, Narwal R, et al. . National, regional, and worldwide estimates of preterm birth rates in the year 2010 with time trends since 1990 for selected countries: a systematic analysis and implications. Lancet. (2012) 379:2162–72. 10.1016/S0140-6736(12)60820-4 - DOI - PubMed
LinkOut - more resources
Full Text Sources