. 2022 Oct 9;25(11):105282.
doi: 10.1016/j.isci.2022.105282. eCollection 2022 Nov 18.

NRas activity is regulated by dynamic interactions with nanoscale signaling clusters at the plasma membrane

Affiliations

NRas activity is regulated by dynamic interactions with nanoscale signaling clusters at the plasma membrane

Oren Yakovian et al. iScience. .

Abstract

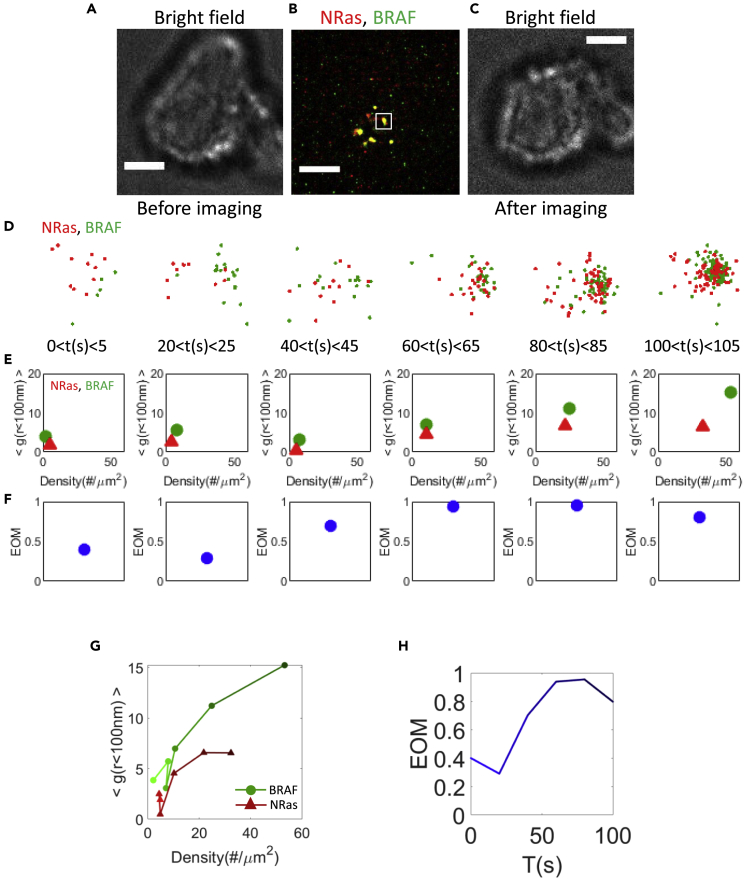
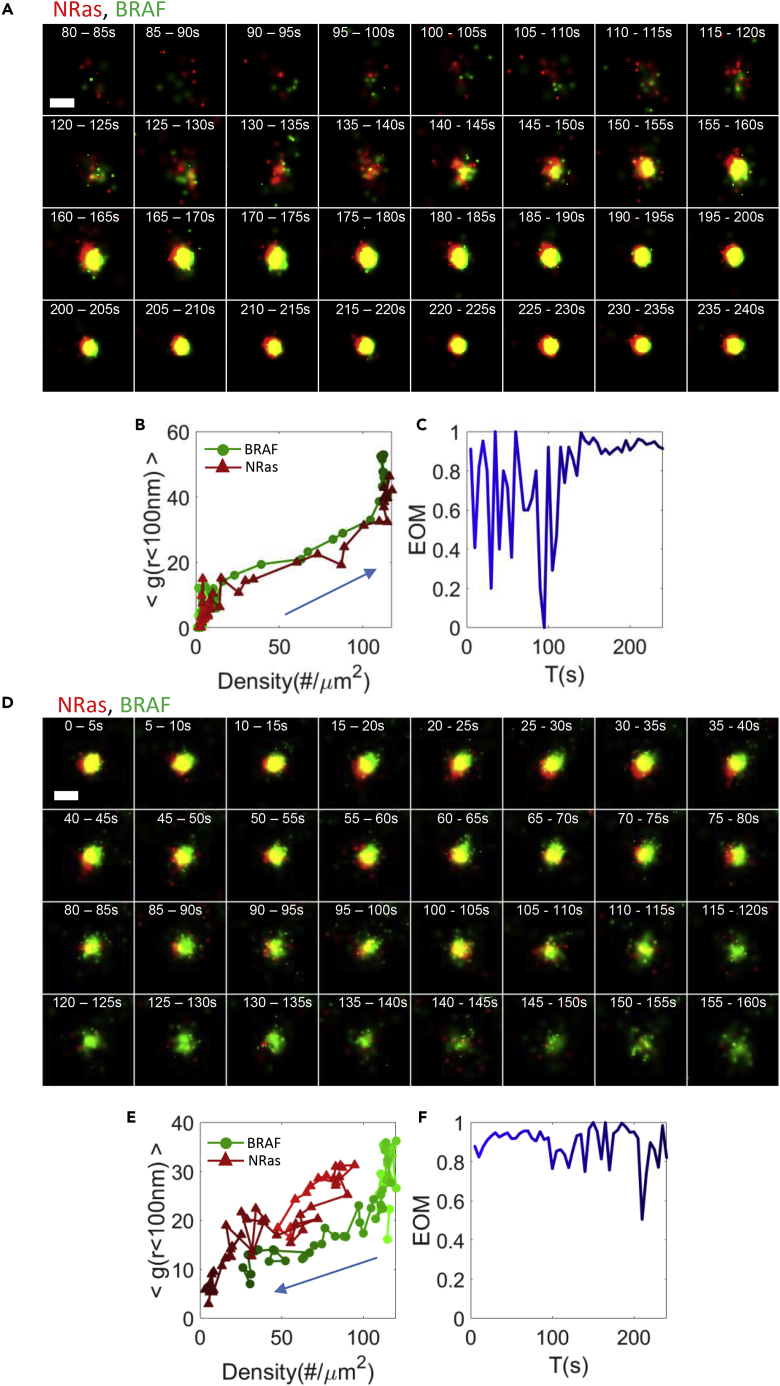
NRas is a key mediator of the mitogenic pathway in normal cells and in cancer cells. Its dynamics and nanoscale organization at the plasma membrane (PM) facilitate its signaling. Here, we used two-color photoactivated localization microscopy to resolve the organization of individual NRas and associated signaling proteins in live melanoma cells, with resolution down to ∼20 nm. Upon EGF activation, a fraction of NRas and BRAF (dis)assembled synchronously at the PM in co-clusters. NRas and BRAF clusters associated with GPI-enriched domains, serving as possible nucleation sites for these clusters. NRas and BRAF association in mutual clusters was reduced by the NRas farnesylation inhibitor lonafarnib, yet enhanced by the BRAF inhibitor vemurafenib. Surprisingly, dispersed NRas molecules associated with the periphery of self-clusters of either Grb2 or NF1. Thus, NRas-mediated signaling, which is critical in health and disease, is regulated by dynamic interactions with functional clusters of BRAF or other related proteins at the PM.

Keywords: Biological sciences; Biophysics; Cell biology; Molecular biology.


Conflict of interest statement

The authors declare no potential conflicts of interest.

Figures

None
Graphical abstract
Figure 1
Figure 1
NRas and BRAF form co-clusters at the plasma membrane of live melanoma cell upon EGF activation 108T cells were dropped onto EGF-coated coverslips and imaged upon initial contact between the cells and coverslip. (A) Bright field image of a melanoma cell before coverslip attachment. Shown is a representative cell (N = 15). Bars – 2 μm. (B) Two-color PALM imaging of the cell in (A). Single SMLM frames were reconstructed from 250 camera frames, yielding a temporal sequence of images every 5 s (see STAR methods). Shown are PAmCherry-NRas and PAGFP-BRAF expressed by the cell. (C) Bright field image of the cell in (A), 4 min after its attachment to the coverslip. (D) Dynamics of single BRAF (green) and NRas (red) proteins at the PM in zoomed region of (B). (E) A two dimensional map of self-clustering (value of g(0–100)) vs. protein density. Values are shown for individual cluster as discs, either for BRAF (green) or NRas (red). The positions of discs change with time progress after activation. (F) The extent of mixing (EOM) of BRAF and NRas for a single cluster. (G) The dynamic changes of the proteins self-clustering through the two-dimensional map shown in (E). The color of the line trajectories darken with time, as specified in panel (E). (H) The EOM trajectories of BRAF and NRas for a single cluster shown in (F). This trajectory also darkens with time, as in (G). Estimated errors related to the g(r) and EOM measures in panels (E–H) are shown in Figure S1H.
Figure 2
Figure 2
NRas and BRAF coalesce into membrane co-clusters and disperse back (A) Two-color PALM live imaging of co-cluster formation of BRAF (green) and NRas (red) at the plasma membrane of melanoma cells. Effective imaging rate of 5 s/frame. Bar – 200 nm. (B) The dynamic changes of the proteins organization through the two-dimensional density (X axis) and self-clustering (Y axis) map upon co-cluster formation. (C) The EOM trajectories of BRAF and NRas upon co-cluster formation. (D) Two-color PALM live imaging of co-cluster disintegration of BRAF (green) and NRas (red) at the plasma membrane of melanoma cells. Effective imaging rate of 5 s/frame. Bar – 200 nm. (E) The dynamic changes of the proteins organization through the two-dimensional density (X axis) and self-clustering (Y axis) map upon co-cluster disintegration. (F) The EOM trajectories of BRAF and NRas upon co-cluster formation. The color of the line trajectories in panels (B, C, E, and F) darkens with time. Estimated errors related to the g(r) and EOM measures in panels (B, C, E, and F) are shown in Figure S1H.
Figure 3
Figure 3
NRas and BRAF co-clustering is correlated and synchronized (A) Two-color PALM live imaging of BRAF (green) and NRas (red) at the plasma membrane of melanoma cell on EGF-coated coverslip. NRas and BRAF were imaged over 120 s. Bar – 200 nm. (B and D) The density over time of BRAF (B) and NRas (D) at the PM. Specified values are for a single co-cluster at an area of 1.5 × 1.5 μm, shown in A (C, E) The pair correlation function (PCF) [value of g(0–100)] over time of BRAF (C) and NRas (E). (F and G) The correlation of density (F) and PCF (G) of BRAF vs. NRas for 41 clusters. (H–J) Classification of NRas and BRAF co-clustering dynamics into 3 states. Organization at the PM in the two-dimensional density vs. self-clustering map overtime of BRAF (H; green discs) and NRas (I; red discs), and their overlap (J). Each point represents the position of a single cluster during 5 s. There are 48 time-points for each of 41 clusters. The color of the points darkens with time. (K) Division of the distribution in (J) into 3 states using Gaussian mixture model (GMM). Monomers or dispersed domains with low molecular density and low extent of self-clustering populate state 1 (green). Molecular domains with high density but low self-clustering populate state 2 (red). Clusters, having high molecular densities and high extent of self-clustering populate state 3 (blue). (L) Markov chain diagram with the transition probability specified between the states. Estimated errors related to the g(r) and EOM measures in panels (C, E, G) are shown in Figure S1H.
Figure 4
Figure 4
NRas clusters at GPI-enriched domains (A and E) Two-color PALM imaging of resting and EGF-activated 108T melanoma cells expressing PAGFP-NRas and GPI-PAmCherry. Cells were seeded on the coverslip for 2 days before fixation. Shown are representative cells (N = 25 for resting cells, N = 33 for EGF-activated cells). Bars - 2 μm (left) and 200 nm (zoomed images). (B, C, F, and G) PCF of PAGFP-NRas (green) and GPI-PAmCherry (red). (D and H) The EOM of NRas and GPI (averaged over all cells; see analyses for further details). (I) Selected GPI (red points) enriched regions (blue polygons) in a representative area of NRas (green points) and GPI. The area was selected from a two-color PALM image, as in panels A,E. (J and K) The density of NRas in and out of the GPI-enriched domains at the PM of the resting (J) and EGF-activated (K) melanoma cells.
Figure 5
Figure 5
BRAF clusters at GPI-enriched domains (A and E) Two-color PALM imaging of resting and EGF-activated 108T melanoma cells expressing PAGFP-BRAF and GPI-PAmCherry. Cells were seeded on the coverslip for 2 days before fixation. Shown are representative cells (N = 12 for resting cells, N = 13 for EGF-activated cells). Bars - 2 μm (left) and 200 nm (zoomed images). (B, C, F, and G) PCF of PAGFP-BRAF (green) and GPI-PAmCherry (red). (D and H) The EOM of NRas and GPI (averaged over all cells; see analyses for further details). (I and J) The density of BRAF in and out of the GPI-enriched domains at the PM of the resting (I) and EGF-activated (J) melanoma cells.
Figure 6
Figure 6
NRas and BRAF clusters are affected by inhibitors of NRas farnesylation and BRAF activity (A and F) Two-color PALM imaging of 108T melanoma cells with and without farnesyltransferase inhibitor (Lonafarnib) expressing PAGFP-BRAF and PAmCherry-NRas. Cells were seeded and treated on the coverslip for 2 days before fixation. Shown are representative cells (N = 18 for untreated cells, N = 17 for treated cells). (B, C, G, and H) PCF of PAGFP-BRAF (green) and PAmCherry-NRas (red). (D and I) The density of BRAF and NRas at the PM. (E and J) The EOM of NRas and BRAF (K and P) Two-color PALM imaging of A375 melanoma cells with and without BRAFi (Vemurafenib) expressing PAGFP-BRAF and PAmCherry-NRas. Cells were seeded and treated on the coverslip for 2 days before fixation. Shown are representative cells (N = 14 for untreated cells, N = 34 for treated cells). (L, M, Q, and R) PCF of PAGFP-BRAF (green) and PAmCherry-NRas (red). (N and S) The density of BRAF and NRas at the PM. (O and T) The EOM of NRas and BRAF (averaged over all cells; see analyses for further details). Stars in treated panels represent a significant difference (p < 0.05) relative to untreated panels. Error bars in all relevant panels are SEM due to measurements on multiple cells. Bars - 2 μm (left) and 200 nm (zoomed images).
Figure 7
Figure 7
NRas localizes at the periphery of Grb2 clusters at the PM (A) Two-color PALM imaging of EGF-activated 108T melanoma cells expressing NRas-PAmCherry and PAGFP-GRB2. Cells were seeded on the coverslip for 2 days before fixation. Shown are representative cells (N = 22). Bars - 2 μm (left) and 200 nm (zoomed images). (B and C) PCF of PAGFP-GRB2 (B) and PAmCherry-NRas (C). (D) The EOM of NRas and GRB2 (averaged over all cells; see analyses for further details). (E) The CBC values color map (right) of Grb2 (green points in left image) relative to NRas (red points). [value of 1 in right image indicates the green points (Grb2) in the data that are close to red points (NRas)]. (F) The CBC values color map (right) of Grb2 (green points in left image) relative to randomly distribution red points (same number of red points from data, as in panel E). (G) The average frequency of CBC values of Grb2 relative to NRas for all cells for the data (blue) and for the randomly distribution red point (gray) (N = 22). (H) The kurtosis values of Grb2 CBC analysis for the data (blue) and the randomly distribution red points (gray).
Figure 8
Figure 8
NRas localizes at the periphery of NF1 clusters and is regulated by signaling clusters at the PM (A) Two-color PALM imaging of EGF-activated 108T melanoma cells expressing NRas-PAmCherry and PAGFP-NF1. Cells were seeded on the coverslip for 2 days before fixation. Shown are representative cells (N = 21). Bars - 2 μm (left) and 200 nm (zoomed image). (B and C) PCF of PAGFP- NF1 and PAmCherry-NRas (red). (D) The EOM of NRas and NF1 (averaged over all cells; see analyses for further details). (E) The average frequency of CBC values of NF1 relative to NRas for all cells (blue) and the average frequency of CBC values of NF1 relative to randomly distribution red point (gray). (F) The kurtosis values of Grb2 CBC analysis for the data (blue) and for the randomly distribution red points (gray). (G) A schematic model of NRas activity regulation by signaling clusters at the PM.

References

    1. Alon M., Arafeh R., Lee J.S., Madan S., Kalaora S., Nagler A., Abgarian T., Greenberg P., Ruppin E., Samuels Y. CAPN1 is a novel binding partner and regulator of the tumor suppressor NF1 in melanoma. Oncotarget. 2018;9:31264–31277. - PMC - PubMed
    1. Arafeh R., Qutob N., Emmanuel R., Keren-Paz A., Madore J., Elkahloun A., Wilmott J.S., Gartner J.J., Di Pizio A., Winograd-Katz S., et al. Recurrent inactivating RASA2 mutations in melanoma. Nat. Genet. 2015;47:1408–1410. - PMC - PubMed
    1. Betzig E., Patterson G.H., Sougrat R., Lindwasser O.W., Olenych S., Bonifacino J.S., Davidson M.W., Lippincott-Schwartz J., Hess H.F. Imaging intracellular fluorescent proteins at nanometer resolution. Science. 2006;313:1642–1645. - PubMed
    1. Bollag G., Clapp D.W., Shih S., Adler F., Zhang Y.Y., Thompson P., Lange B.J., Freedman M.H., Mccormick F., Jacks T., Shannon K. Loss of NF1 results in activation of the Ras signaling pathway and leads to aberrant growth in haematopoietic cells. Nat. Genet. 1996;12:458. - PubMed
    1. Brooks S. Markov chain Monte Carlo method and its application. J. Roy. Stat. Soc. D. 1998;47:69–100.