Review
. 2022 Jun 27:2:927312.
doi: 10.3389/fbinf.2022.927312. eCollection 2022.

A Review of Feature Selection Methods for Machine Learning-Based Disease Risk Prediction

Affiliations
Review

A Review of Feature Selection Methods for Machine Learning-Based Disease Risk Prediction

Nicholas Pudjihartono et al. Front Bioinform. .

Abstract

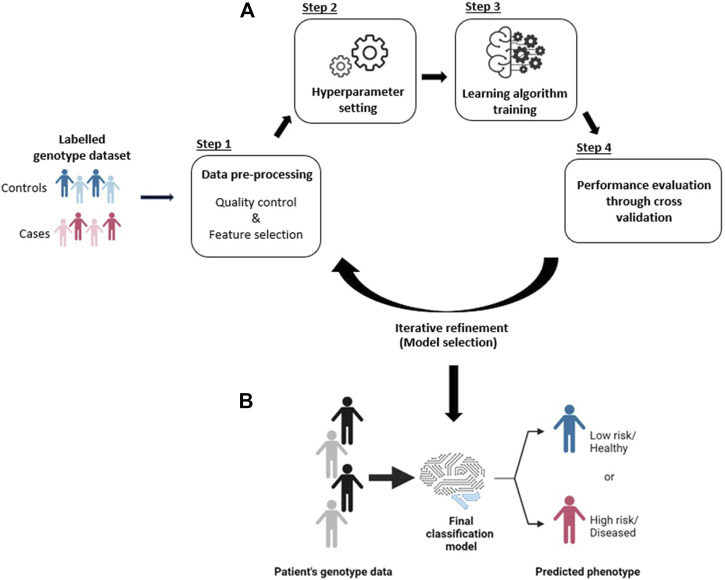
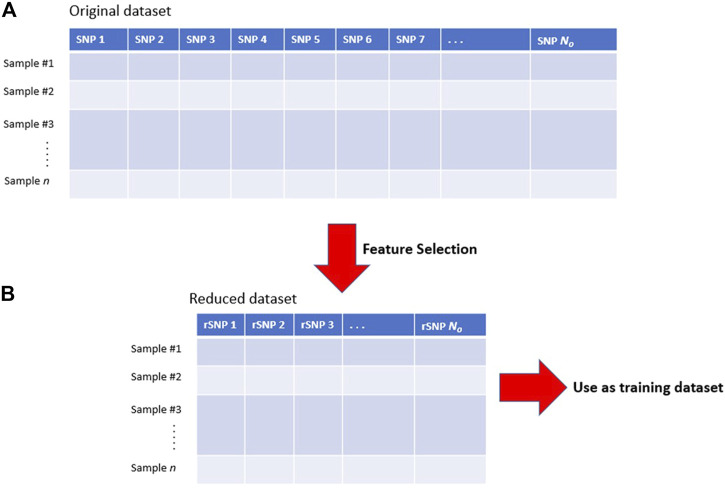
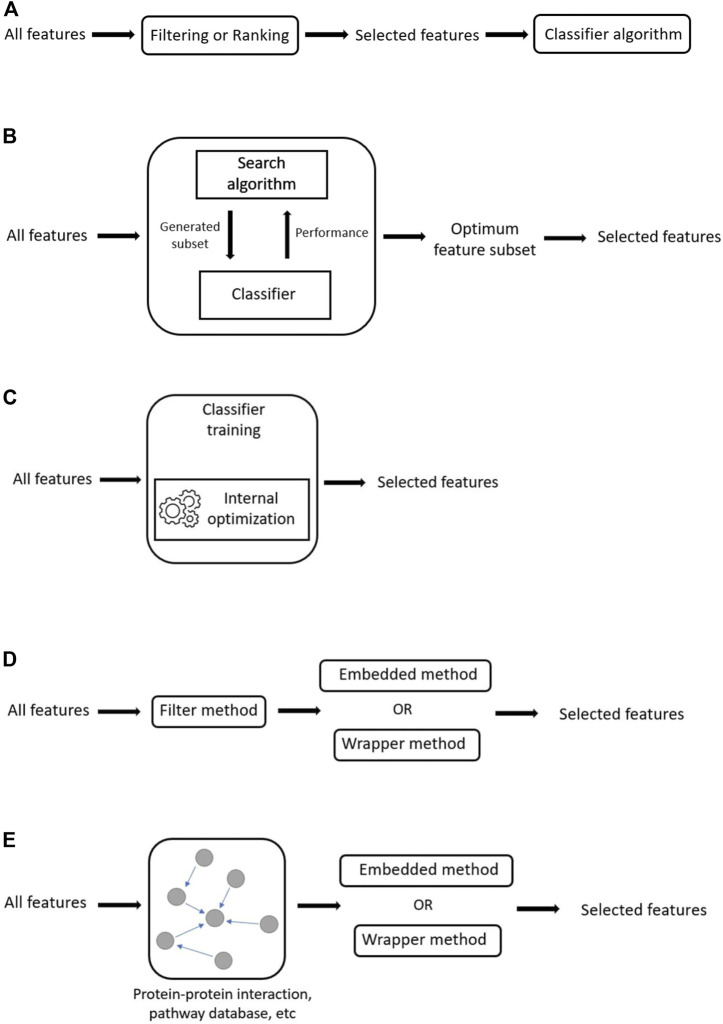
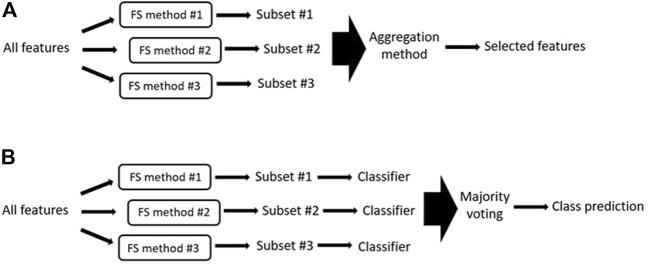
Machine learning has shown utility in detecting patterns within large, unstructured, and complex datasets. One of the promising applications of machine learning is in precision medicine, where disease risk is predicted using patient genetic data. However, creating an accurate prediction model based on genotype data remains challenging due to the so-called "curse of dimensionality" (i.e., extensively larger number of features compared to the number of samples). Therefore, the generalizability of machine learning models benefits from feature selection, which aims to extract only the most "informative" features and remove noisy "non-informative," irrelevant and redundant features. In this article, we provide a general overview of the different feature selection methods, their advantages, disadvantages, and use cases, focusing on the detection of relevant features (i.e., SNPs) for disease risk prediction.

Keywords: disease risk prediction; feature selection (FS); machine learing; risk prediction; statistical approaches.


Conflict of interest statement

The authors declare that the research was conducted in the absence of any commercial or financial relationships that could be construed as a potential conflict of interest.

Figures

FIGURE 1
FIGURE 1
(A) Generalized workflow for creating a predictive ML model from a genotype dataset. (B) The final model can then be used for disease risk prediction.
FIGURE 2
FIGURE 2
Illustration of feature selection process. (A) The original dataset may contain an excessive number of features and a lot of irrelevant SNPs. (B) Feature selection reduces the dimensionality of the dataset by excluding irrelevant features and including only those features that are relevant for prediction. The reduced dataset contains relevant SNPs (rSNPs) which can be used to train the learning algorithm. No: original number of features, Nr: number of remaining relevant SNPs.
FIGURE 3
FIGURE 3
Lead SNPs in GWAS studies need not be the causal variant due to linkage disequilibrium. Illustration of GWAS result where SNPs (circles) are colored according to linkage disequilibrium (LD) strength with the true causal variant within the locus (indicated with a black star). Due to LD, several SNPs near the true causal variant may show a statistically significant association with the phenotype. In ML, these highly correlated SNPs can be considered redundant to each other, therefore only one representative SNP for this LD cluster is required as a selected feature. In this example, the causal variant is not the variant with the strongest GWAS association signal.
FIGURE 4
FIGURE 4
The functional impacts of SNPs can interact and may be epistatic. (A) Individually, neither SNP1 nor SNP2 affect phenotype distribution. (B) Taken together, allele combinations between SNP1 and SNP2 can affect phenotype distribution (marked with yellow star).
FIGURE 5
FIGURE 5
Generalized illustrations of methods. (A) Schematic of filter method, where feature selection is independent of the classifier. (B)The wrapper method. Feature selection relies on the performance of the classifier algorithm on the various generated feature subsets. (C) The embedded method. In embedded methods, feature selection is integrated as a part of the classifier algorithm. (D) Hybrid methods. In hybrid methods, features are reduced through the application of a filter method before the reduced feature set is passed through a wrapper or embedded method to obtain the final feature subset. (E) Integrative methods. In integrative methods, external information is used as a filter to reduce feature search space before the reduced feature set is passed through a wrapper or embedded method to obtain the final feature subset.
FIGURE 6
FIGURE 6
(A) Generalized illustration of ensemble methods. In ensemble methods, the outputs of several feature selection methods are aggregated to obtain the final selected features. FS = feature selection. (B) Generalized illustration of majority voting system where the different generated feature subsets are used to train and test a specific classifier. The final output is the class predicted by the majority of the classifiers.

Similar articles

Cited by

References

    1. Abraham G., Inouye M. (2015). Genomic Risk Prediction of Complex Human Disease and its Clinical Application. Curr. Opin. Genet. Dev. 33, 10–16. 10.1016/j.gde.2015.06.005 - DOI - PubMed
    1. Abramovich F., Benjamini Y., Donoho D. L., Johnstone I. M. (2006). Adapting to Unknown Sparsity by Controlling the False Discovery Rate. Ann. Stat. 34, 584–653. 10.1214/009053606000000074 - DOI
    1. Altshuler D., Daly M. J., Lander E. S. (2008). Genetic Mapping in Human Disease. Science 322, 881–888. 10.1126/science.1156409 - DOI - PMC - PubMed
    1. Álvarez-Estévez D., Sánchez-Maroño N., Alonso-Betanzos A., Moret-Bonillo V. (2011). Reducing Dimensionality in a Database of Sleep EEG Arousals. Expert Syst. Appl. 38, 7746–7754.
    1. Alzubi R., Ramzan N., Alzoubi H., Amira A. (2017). A Hybrid Feature Selection Method for Complex Diseases SNPs. IEEE Access 6, 1292–1301. 10.1109/ACCESS.2017.2778268 - DOI

LinkOut - more resources