

Naview: A d3.js Based JavaScript Library for Drawing and Annotating Voltage-Gated Sodium Channels Membrane Diagrams
- PMID: 36304314
- PMCID: PMC9580940
- DOI: 10.3389/fbinf.2022.774417
Naview: A d3.js Based JavaScript Library for Drawing and Annotating Voltage-Gated Sodium Channels Membrane Diagrams
Abstract
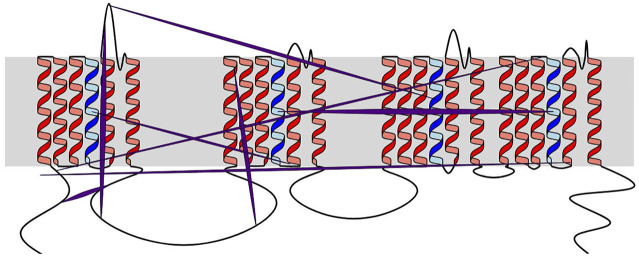
Voltage-gated sodium channels (Nav) are membrane proteins essential to initiating and propagating action potential in neurons and other excitable cells. For a given organism there are often multiple, specialized sodium channels found in different tissues, whose mutations can cause deleterious effects observed in numerous diseases. Consequently, there is high medical and pharmacological interest in these proteins. Scientific literature often uses membrane diagrams to depict important patterns in these channels including the six transmembrane segments (S1-S6) present in four different homologous domains (D1-D4), the S4 voltage sensors, the pore-lining residue segments and the ion selectivity filter residues, glycosylation and phosphorylation residues, toxin binding sites and the inactivation loop, among others. Most of these diagrams are illustrated either digitally or by hand and programs specifically dedicated to the interactive and data-friendly generation of such visualizations are scarce or non-existing. This paper describes Naview, an open-source javascript visualization compatible with modern web browsers for the dynamic drawing and annotation of voltage-gated sodium channels membrane diagrams based on the D3.js library. By using a graphical user interface and combining user-defined annotations with optional UniProt code as inputs, Naview allows the creation and customization of membrane diagrams. In this interface, a user can also map and display important sodium channel properties, residues, regions and their relationships through symbols, colors, and edge connections. Such features can facilitate data exploration and provide fast, high-quality publication-ready graphics for this highly active area of research.
Keywords: d3.js; data visualization; javascript; membrane plot; voltage gated sodium channel (NaV).
Copyright © 2022 Afonso, da Fonseca Júnior, Miranda and Bleicher.
Conflict of interest statement
The authors declare that the research was conducted in the absence of any commercial or financial relationships that could be construed as a potential conflict of interest.
Figures


Similar articles
-
Molecular properties of brain sodium channels: an important target for anticonvulsant drugs.Adv Neurol. 1999;79:441-56. Adv Neurol. 1999. PMID: 10514834 Review.
-
NMR analysis of interaction of LqhalphaIT scorpion toxin with a peptide corresponding to the D4/S3-S4 loop of insect para voltage-gated sodium channel.Biochemistry. 2008 Jan 22;47(3):911-21. doi: 10.1021/bi701323k. Epub 2007 Dec 23. Biochemistry. 2008. PMID: 18154318
-
Voltage sensor interaction site for selective small molecule inhibitors of voltage-gated sodium channels.Proc Natl Acad Sci U S A. 2013 Jul 16;110(29):E2724-32. doi: 10.1073/pnas.1220844110. Epub 2013 Jul 1. Proc Natl Acad Sci U S A. 2013. PMID: 23818614 Free PMC article.
-
Up-regulation of voltage-gated sodium channels by peptides mimicking S4-S5 linkers reveals a variation of the ligand-receptor mechanism.Sci Rep. 2020 Apr 3;10(1):5852. doi: 10.1038/s41598-020-62615-6. Sci Rep. 2020. PMID: 32246066 Free PMC article.
-
Molecular pore structure of voltage-gated sodium and calcium channels.Braz J Med Biol Res. 1994 Dec;27(12):2781-802. Braz J Med Biol Res. 1994. PMID: 7550000 Review.
Cited by
-
Sangerbox 2: Enhanced functionalities and update for a comprehensive clinical bioinformatics data analysis platform.Imeta. 2024 Sep 2;3(5):e238. doi: 10.1002/imt2.238. eCollection 2024 Oct. Imeta. 2024. PMID: 39429873 Free PMC article.
-
Increasing the Impact and Value of Laboratory Medicine Through Effective and AI-Assisted Communication.EJIFCC. 2025 Feb 28;36(1):12-25. eCollection 2025 Mar. EJIFCC. 2025. PMID: 40061065 Free PMC article. Review.
References
-
- Bergwerf H. (2015). MolView : an Attempt to Get the Cloud into Chemistry Classrooms. ACS CHED CCCE Newsl. 2015, 1–9.
LinkOut - more resources
Full Text Sources