. 2022 Apr 21:2:857577.
doi: 10.3389/fbinf.2022.857577. eCollection 2022.

N-Tools-Browser: Web-Based Visualization of Electrocorticography Data for Epilepsy Surgery

Affiliations

N-Tools-Browser: Web-Based Visualization of Electrocorticography Data for Epilepsy Surgery

Jay Burkhardt et al. Front Bioinform. .

Abstract

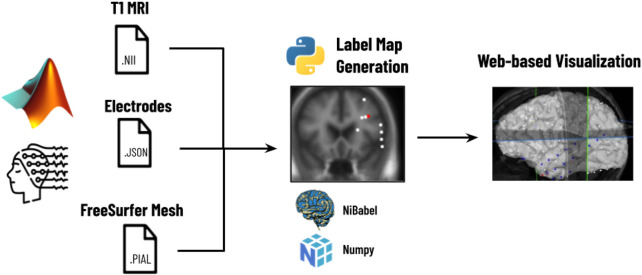
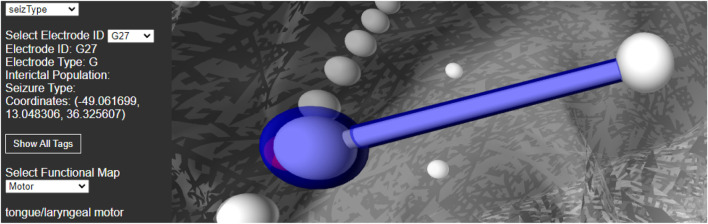
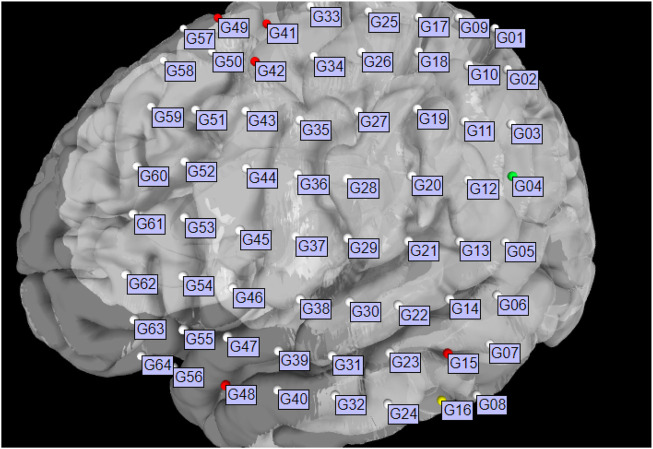
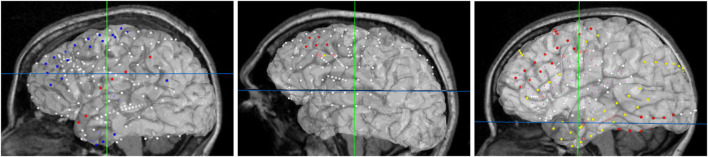
Epilepsy affects more than three million people in the United States. In approximately one-third of this population, anti-seizure medications do not control seizures. Many patients pursue surgical treatment that can include a procedure involving the implantation of electrodes for intracranial monitoring of seizure activity. For these cases, accurate mapping of the implanted electrodes on a patient's brain is crucial in planning the ultimate surgical treatment. Traditionally, electrode mapping results are presented in static figures that do not allow for dynamic interactions and visualizations. In collaboration with a clinical research team at a Level 4 Epilepsy Center, we developed N-Tools-Browser, a web-based software using WebGL and the X-Toolkit (XTK), to help clinicians interactively visualize the location and functional properties of implanted intracranial electrodes in 3D. Our software allows the user to visualize the seizure focus location accurately and simultaneously display functional characteristics (e.g., results from electrical stimulation mapping). Different visualization modes enable the analysis of multiple electrode groups or individual anatomical locations. We deployed a prototype of N-Tools-Browser for our collaborators at the New York University Grossman School of Medicine Comprehensive Epilepsy Center. Then, we evaluated its usefulness with domain experts on clinical cases.

Keywords: ECOG; electrocorticography; electrode; epilepsy; seizure; surgery; visualization; webgl.


Conflict of interest statement

The authors declare that the research was conducted in the absence of any commercial or financial relationships that could be construed as a potential conflict of interest.

Figures

FIGURE 1
FIGURE 1
Different visualization methods for the same ECoG data set. Left: a schematic drawing. Right: a static 2D figure from N-Tools-elec.
FIGURE 2
FIGURE 2
Workflow for N-Tools: In the first step, the user runs a patient’s electrode data through a MATLAB preprocessing pipeline to generate a T1 MRI NIfTI file, a JSON file, and a FreeSurfer Mesh file. In the second step, a Python script takes the patient’s JSON and NIfTI files and generates a label map of the different seizure types. Finally, the T1 MRI NIfTI file, the JSON file, and the label map are loaded into N-Tools-Browser for visualization.
FIGURE 3
FIGURE 3
Full view of the user interface after loading the data set of a patient. Detailed view of the GUI control panel to adjust different visualization properties of the brain mesh and 2D slices.
FIGURE 4
FIGURE 4
Population of electrodes on the brain in 3D space (left) and on a 2D slice (right) in the x-direction. The red electrodes represent the “onset” attributes of associated seizure type, while white indicates no seizure type is associated to the electrode.
FIGURE 5
FIGURE 5
Information displayed about an electrode (G27) and functional mapping when clicked by a user. Selecting a functional map from the drop down menu will display the connected electrode pairs involved.
FIGURE 6
FIGURE 6
Brain surface mesh with all electrode IDs displayed simultaneously.
FIGURE 7
FIGURE 7
Final browser-based visualization of three different subjects NY704, NY758, NY836 including localization of electrodes on the brain surface. The color of each electrode represents the different attribute (onset, early spread, etc.) for the corresponding seizure type.
FIGURE 8
FIGURE 8
Left: We collected the qualitative feedback from neuroscientists after evaluating the N-Tool-Browser. The experts gave positive feedback on the scale range from one to seven, and were satisfied with their results. Right: We also performed the standardized NASA-TLX questionnaire and the experts reported low frustration and high performance on the scale range from 1–21.

References

    1. Abid A., Abdalla A., Abid A., Khan D., Alfozan A., Zou J. (2020). An Online Platform for Interactive Feedback in Biomedical Machine Learning. Nat. Mach Intell. 2, 86–88. 10.1038/s42256-020-0147-8 - DOI
    1. Amaral P., Paulo J., Cunha S., Dias P., Maria J. (2007). Multimodal Application for Visualization and Manipulation of Electrocorticography Data. Portugal: Porto Salvo.
    1. Combrisson E., Vallat R., O'Reilly C., Jas M., Pascarella A., Saive A. L., et al. (2019). Visbrain: a Multi-Purpose Gpu-Accelerated Open-Source Suite for Multimodal Brain Data Visualization. Front. Neuroinformatics 13, 14. 10.3389/fninf.2019.00014 - DOI - PMC - PubMed
    1. Egger J., Wild D., Weber M., Bedoya C. A. R., Karner F., Prutsch A., et al. (2022). Studierfenster: an Open Science Cloud-Based Medical Imaging Analysis Platform. J. Digital Imaging 2022, 1–16. 10.1007/s10278-021-00574-8 - DOI - PMC - PubMed
    1. Engel J. (2016). What Can We Do for People with Drug-Resistant Epilepsy?: The 2016 Wartenberg Lecture. Neurology 87, 2483–2489. 10.1212/WNL.0000000000003407 - DOI - PMC - PubMed

LinkOut - more resources