

Visualizing RNA Structures by SAXS-Driven MD Simulations
- PMID: 36304317
- PMCID: PMC9580860
- DOI: 10.3389/fbinf.2022.781949
Visualizing RNA Structures by SAXS-Driven MD Simulations
Abstract
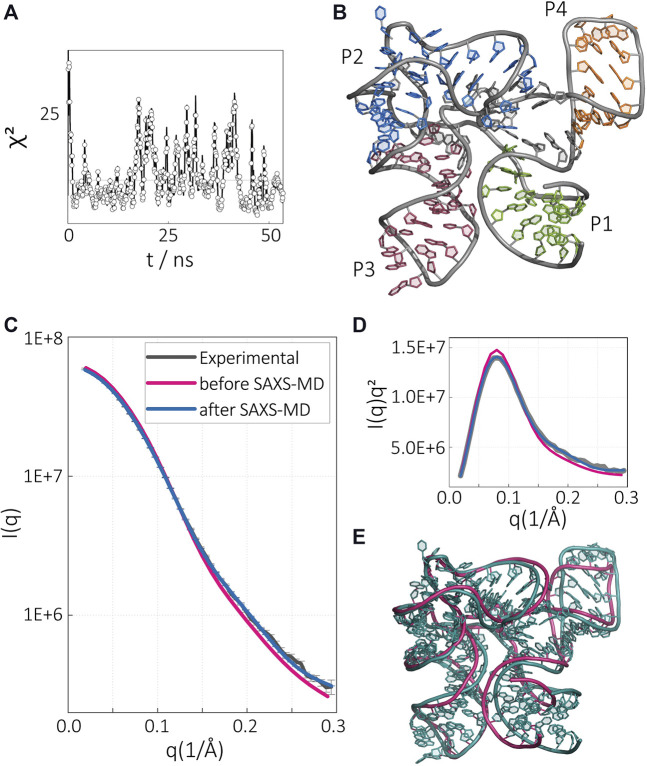
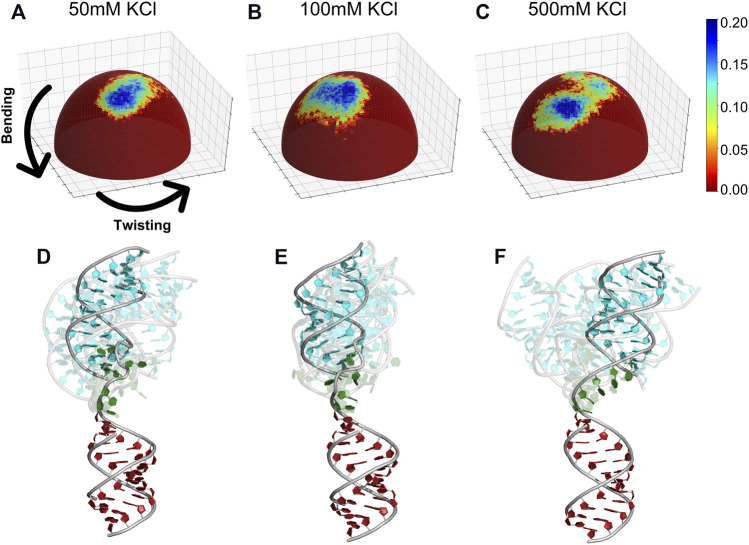
The biological role of biomolecules is intimately linked to their structural dynamics. Experimental or computational techniques alone are often insufficient to determine accurate structural ensembles in atomic detail. We use all-atom molecular dynamics (MD) simulations and couple it to small-angle X-ray scattering (SAXS) experiments to resolve the structural dynamics of RNA molecules. To accomplish this task, we utilize a set of re-weighting and biasing techniques tailored for RNA molecules. To showcase our approach, we study two RNA molecules: a riboswitch that shows structural variations upon ligand binding, and a two-way junction RNA that displays structural heterogeneity and sensitivity to salt conditions. Integration of MD simulations and experiments allows the accurate construction of conformational ensembles of RNA molecules. We observe a dynamic change of the SAM-I riboswitch conformations depending on its binding partners. The binding of SAM and Mg2+ cations stabilizes the compact state. The absence of Mg2+ or SAM leads to the loss of tertiary contacts, resulting in a dramatic expansion of the riboswitch conformations. The sensitivity of RNA structures to the ionic strength demonstrates itself in the helix junction helix (HJH). The HJH shows non-monotonic compaction as the ionic strength increases. The physics-based picture derived from the experimentally guided MD simulations allows biophysical characterization of RNA molecules. All in all, SAXS-guided MD simulations offer great prospects for studying RNA structural dynamics.
Keywords: MD simulation; RNA; SAXS (small-angle X-ray scattering); experimentally guided simulations; maximum entropy; structural modelling.
Copyright © 2022 He, Henning-Knechtel and Kirmizialtin.
Conflict of interest statement
The authors declare that the research was conducted in the absence of any commercial or financial relationships that could be construed as a potential conflict of interest.
Figures


Similar articles
-
Molecular Dynamics Simulations Combined with Nuclear Magnetic Resonance and/or Small-Angle X-ray Scattering Data for Characterizing Intrinsically Disordered Protein Conformational Ensembles.J Chem Inf Model. 2019 May 28;59(5):1743-1758. doi: 10.1021/acs.jcim.8b00928. Epub 2019 Mar 18. J Chem Inf Model. 2019. PMID: 30840442 Review.
-
Conformations of an RNA Helix-Junction-Helix Construct Revealed by SAXS Refinement of MD Simulations.Biophys J. 2019 Jan 8;116(1):19-30. doi: 10.1016/j.bpj.2018.11.020. Epub 2018 Nov 22. Biophys J. 2019. PMID: 30558889 Free PMC article.
-
Hybrid Methods for Modeling Protein Structures Using Molecular Dynamics Simulations and Small-Angle X-Ray Scattering Data.Adv Exp Med Biol. 2018;1105:237-258. doi: 10.1007/978-981-13-2200-6_15. Adv Exp Med Biol. 2018. PMID: 30617833 Review.
-
Conformational heterogeneity of UCAAUC RNA oligonucleotide from molecular dynamics simulations, SAXS, and NMR experiments.RNA. 2022 Jul;28(7):937-946. doi: 10.1261/rna.078888.121. Epub 2022 Apr 28. RNA. 2022. PMID: 35483823 Free PMC article.
-
Structure and ensemble refinement against SAXS data: Combining MD simulations with Bayesian inference or with the maximum entropy principle.Methods Enzymol. 2023;678:23-54. doi: 10.1016/bs.mie.2022.09.014. Epub 2022 Nov 26. Methods Enzymol. 2023. PMID: 36641209
Cited by
-
Magnesium ions mediate ligand binding and conformational transition of the SAM/SAH riboswitch.bioRxiv [Preprint]. 2023 Mar 12:2023.03.12.532287. doi: 10.1101/2023.03.12.532287. bioRxiv. 2023. Update in: Commun Biol. 2023 Jul 31;6(1):791. doi: 10.1038/s42003-023-05175-5. PMID: 36945415 Free PMC article. Updated. Preprint.
-
Insights into the structural stability of major groove RNA triplexes by WAXS-guided MD simulations.Cell Rep Phys Sci. 2022 Jul 20;3(7):100971. doi: 10.1016/j.xcrp.2022.100971. Epub 2022 Jul 11. Cell Rep Phys Sci. 2022. PMID: 35936555 Free PMC article.
-
Atomistic structure of the SARS-CoV-2 pseudoknot in solution from SAXS-driven molecular dynamics.Nucleic Acids Res. 2023 Nov 10;51(20):11332-11344. doi: 10.1093/nar/gkad809. Nucleic Acids Res. 2023. PMID: 37819014 Free PMC article.
-
Magnesium ions mediate ligand binding and conformational transition of the SAM/SAH riboswitch.Commun Biol. 2023 Jul 31;6(1):791. doi: 10.1038/s42003-023-05175-5. Commun Biol. 2023. PMID: 37524918 Free PMC article.
-
Comparison of Three Computational Tools for the Prediction of RNA Tertiary Structures.Noncoding RNA. 2024 Nov 8;10(6):55. doi: 10.3390/ncrna10060055. Noncoding RNA. 2024. PMID: 39585047 Free PMC article.
References
-
- Berendsen H. J. C., Postma J. P. M., van Gunsteren W. F., DiNola A., Haak J. R. (1984). Molecular Dynamics with Coupling to an External bath. J. Chem. Phys. 81, 3684–3690. 10.1063/1.448118 - DOI
LinkOut - more resources
Full Text Sources