. 2022 Oct 10:13:1007737.
doi: 10.3389/fimmu.2022.1007737. eCollection 2022.

Lactobacillus johnsonii YH1136 plays a protective role against endogenous pathogenic bacteria induced intestinal dysfunction by reconstructing gut microbiota in mice exposed at high altitude

Affiliations

Lactobacillus johnsonii YH1136 plays a protective role against endogenous pathogenic bacteria induced intestinal dysfunction by reconstructing gut microbiota in mice exposed at high altitude

Zhiqiang Wan et al. Front Immunol. .

Abstract

Background: Intestinal microbiota plays an important role in maintaining the microecological balance of the gastrointestinal tract in various animals. Disturbances in the intestinal microbiota may lead to the proliferation of potentially pathogenic bacteria that become the dominant species, leading to intestinal immune disorders, intestinal inflammation, and other intestinal diseases. Numerous studies have been confirmed that high-altitude exposure affects the normal function of the intestine and the composition of the intestinal microbiota. However, it is still necessary to reveal the changes in intestinal microbiota in high-altitude exposure environments, and clarify the relationship between the proliferation of potentially pathogenic bacteria and intestinal injury in this environment. In addition, explored probiotics that may have preventive effects against intestinal diseases.

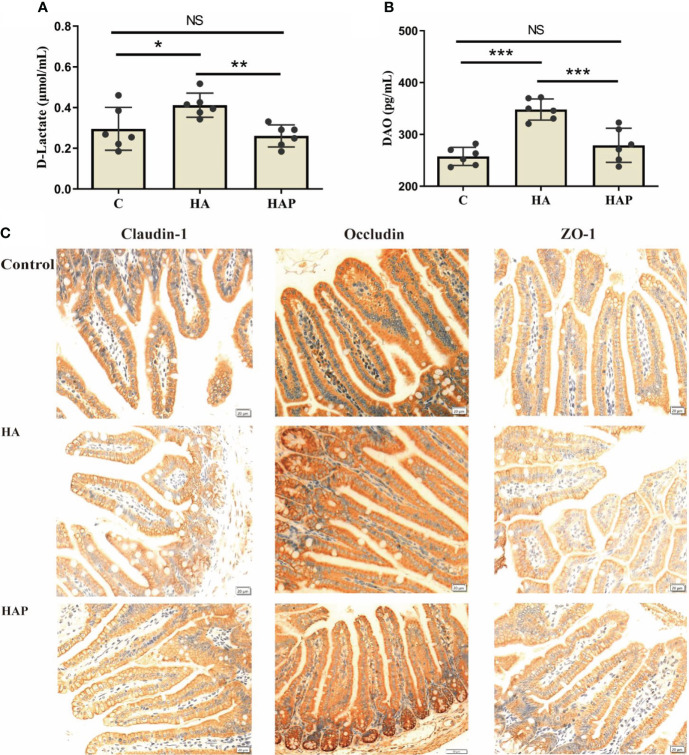
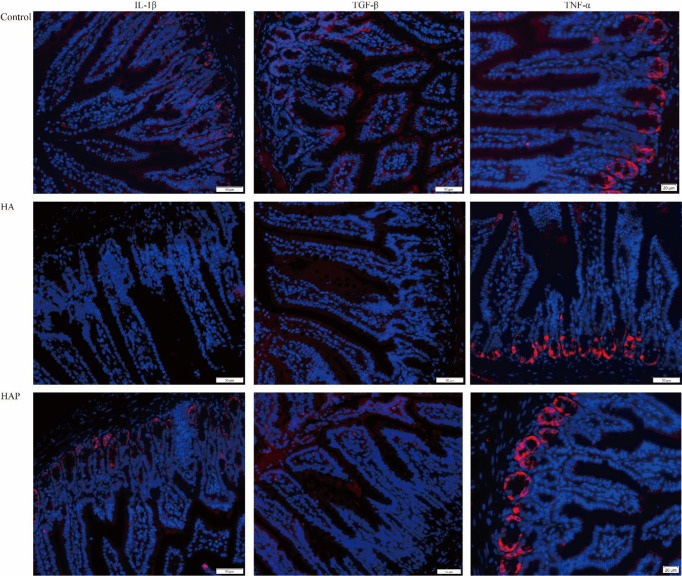
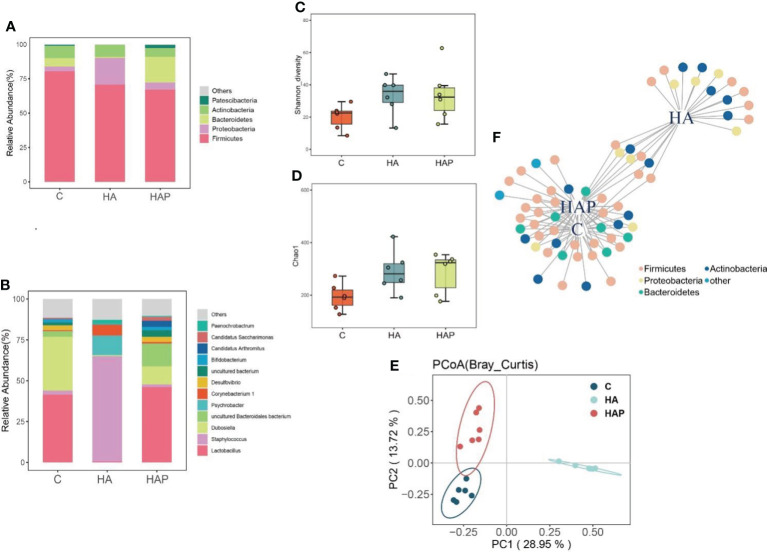
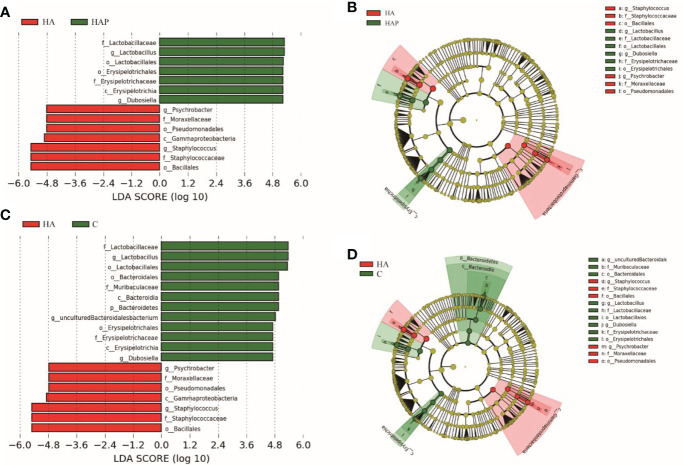
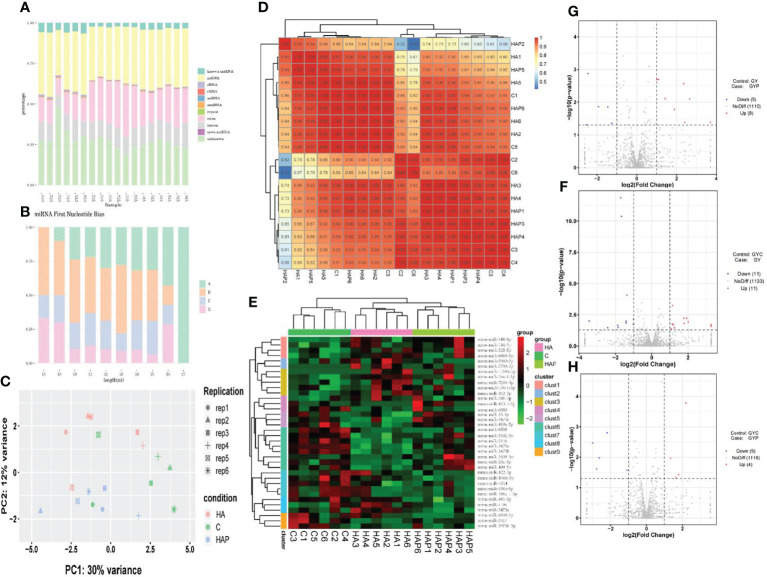
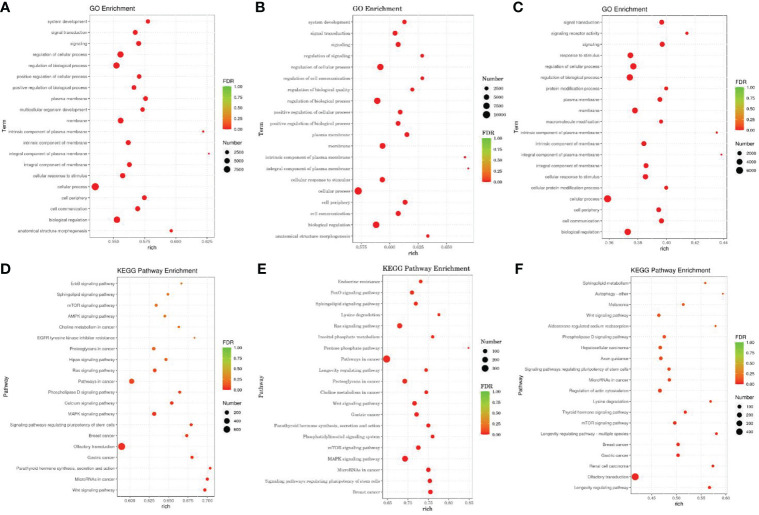
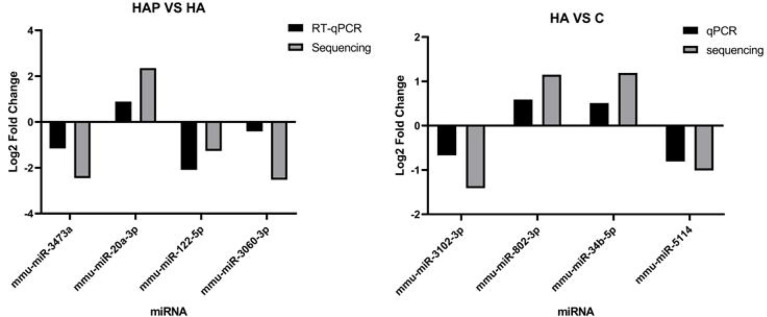
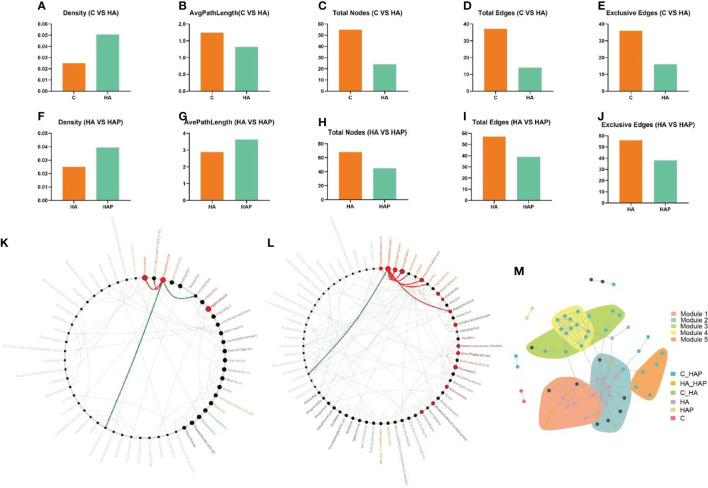
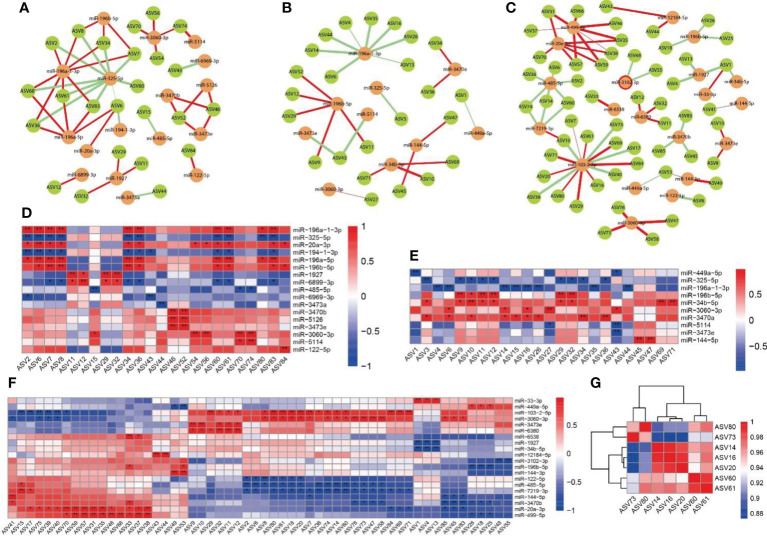
Methods and results: C57BL/6 mice were randomly divided into three groups, a high-altitude group (HA), control group (C), and high-altitude probiotic group (HAP). The HA and HAP groups were subjected to hypoxia modeling for 14 days in a low-pressure oxygen chamber with daily gavage of 0.2 mL of normal saline (HA) and Lactobacillus johnsonii YH1136 bacterial fluid (HAP), while the control group was fed normally. L. johnsonii YH1136 was isolated from feces of a healthy Tibetan girl in Baingoin county, the Nagqu region of the Tibet Autonomous Region, at an altitude of 5000 meters. Our observations revealed that gavage of YH1136 was effective in improving the damage to the intestinal barrier caused by high-altitude exposure to hypoxic environments and helped to reduce the likelihood of pathogenic bacteria infection through the intestinal barrier. It also positively regulates the intestinal microbiota to the extent of Lactobacillus being the dominant microbiome and reducing the number of pathogenic bacteria. By analyzing the expression profile of ileal microRNAs and correlation analysis with intestinal microbiota, we found that Staphylococcus and Corynebacterium1 cooperated with miR-196a-1-3p and miR-3060-3p, respectively, to play a regulatory role in the process of high-altitude hypoxia-induced intestinal injury.

Conclusion: These findings revealed the beneficial effect of L. johnsonii YH1136 in preventing potential endogenous pathogenic bacteria-induced intestinal dysfunction in high-altitude environments. The mechanism may be related to the regulation of intestinal injury from the perspective of the gut microbiota as well as miRNAs.

Keywords: Lactobacillus johnsonii; high-altitude exposure; intestinal microbiota; miRNA; probiotic.


Conflict of interest statement

HW was employed by the Guangzhou Beneco Biotechnology Co., Ltd. The remaining authors declare that the research was conducted in the absence of any commercial or financial relationships that could be construed as a potential conflict of interest.

Figures

Figure 1
Figure 1
Evaluation and analysis of intestinal permeability (A) Serum D-Lactic content. (B) Serum DAO content. Data are presented with the meas ± standard deviation (n=6). The marked * between the histograms indicates that the difference is significant. * means P<0.05, ** means P<0.01, *** means P<0.001. (C) Immunohistochemical analysis of the expression of mouse ileal tight junction proteins (Claudin-1, Occludin and ZO-1). The positive cells of the three proteins were stained brown. ns, not significant.
Figure 2
Figure 2
Analysis of inflammation factors in ileum DAPI was used to stain the nucleus, and different fluorescent genes were connected through secondary antibodies to show the expression of the target gene. The target genes were showed in red.
Figure 3
Figure 3
Effects of hypoxia environment and Lactobacillus johnsonii YH1136 supplementation on the composition, structure and diversity of mice ileal micriobiome (A) Phylum level species composition. (B) Genus level species composition. (C) Shannon diversity analysis. (D) Chao1 Index (E) PCoA (Bray_Curtis) analysis. (F) Indicator species analysis, the species sensitive to different treatments are divided into one plant different node colors represent different Phylum levels.
Figure 4
Figure 4
Lefse analysis of ileal microbiota in mice The linar discriminant analysis (LDA) score (A, C) and cladogram (B, D) were generated from LDA effect size. Taxa with LDA values larger than 4.5 are shown in figure.
Figure 5
Figure 5
miRNA sequencing analysis (A) Unique reads of Small RNA classification statistics. (B) miRNA first base preference. (C) Principal component analysis of samples in each group. (D) Correlation analysis of miRNA expression levels among samples. (E) Cluster analysis of differentially expressed miRNAs. (F–H) The volcano plot of differentially expressed miRNAs.
Figure 6
Figure 6
GO and KEGG Pathway enrichment analysis of target genes of differentially expressed miRNAs According to the enrichment results of Go, and the degree of enrichment is measured by rich factor, FDR value and the number of miRNA target genes enriched on this Go term and pathway. The larger the rich factor, the greater the degree of enrichment. The general value range of FDR is 0-1. The closer it is to zero, the more significant the enrichment is. (A–C) The GO analysis. (D–F) The KEGG Pathway enrichment analysis. The horizontal axis is rich factor, which refers to the ratio of the number of differential miRNA target genes enriched into GO term or pathway to the number of differential miRNA target genes annotated, with a larger value indicating more significant enrichment. The vertical axis is GO term or pathway.
Figure 7
Figure 7
Validation of differentilly expressed of miRNA. RT-qPCR validation experiment of randomly selected differentially expressed miRNAs. Four miRNAs including mmu-miR-3743a, mmu-miR-20a-3p, mmu-miR-122-5p and mmu-miR-3060-3p were selected from HAP group and HA group respectively, and four miRNAs including mmu-miR-3102-3p, mmu-miR-802-3p, mmu-miR-34b-5p and mmu-miR-5114 were selected from HA group and C group to complete the validation test of RT-qPCR.
Figure 8
Figure 8
Netshift and co-occurrence network analysis (A-E) Changes of network properties between group C and group HA. (F-J) Changes of network properties between group HA and group HAP. (K) Common sub-networks analysis of group C and group HA. (L) Common sub-networks analysis of group HA and group HAP. (M) Each node in the co-occurrence network represented an ASV closely related species, which was grouped into the same module, and different colors were used to highlight the response pattern of the ASV module.
Figure 9
Figure 9
Correlation analysis between miRNAs and intestinal microbiota (A, D) Correlations between miRNA in C group and intestinal microbiota. (B, E) Correlations between miRNA in HA groups and intestinal microbiota. (C, F) Correlations between miRNA in HAP groups and intestinal microbiota. (G) Correlation analysis of driving microbes (Staphylococcus and Corynebacterium 1). The colors range form blue to red corresponds to negative correlation and positive correlation, respectively. The ‘*’ means P value < 0.05, ‘**’ means P value < 0.01.

Similar articles

Cited by

References

    1. Quigley EMM. Prebiotics and probiotics in digestive health. Clin Gastroenterol Hepatol (2019) 17(2):333–44. doi: 10.1016/j.cgh.2018.09.028 - DOI - PubMed
    1. Jia Z, Zhao X, Liu X, Zhao L, Jia Q, Shi J, et al. . Impacts of the plateau environment on the gut microbiota and blood clinical indexes in han and Tibetan individuals. mSystems (2020) 5(1):e00660-19. doi: 10.1128/mSystems.00660-19 - DOI - PMC - PubMed
    1. Wen J, Zhang JQ, Nie ZL, Zhong Y, Sun H. Evolutionary diversifications of plants on the qinghai-Tibetan plateau. Front Genet (2014) 5:4. doi: 10.3389/fgene.2014.00004 - DOI - PMC - PubMed
    1. Sánchez de Medina F, Romero-Calvo I, Mascaraque C, Martínez-Augustin O. Intestinal inflammation and mucosal barrier function. Inflammation Bowel Dis (2014) 20(12):2394–404. doi: 10.1097/mib.0000000000000204 - DOI - PubMed
    1. Al-Sadi R, Nighot P, Nighot M, Haque M, Rawat M, Ma TY. Lactobacillus acidophilus induces a strain-specific and toll-like receptor 2-dependent enhancement of intestinal epithelial tight junction barrier and protection against intestinal inflammation. Am J Pathol (2021) 191(5):872–84. doi: 10.1016/j.ajpath.2021.02.003 - DOI - PMC - PubMed

Publication types

LinkOut - more resources