. 2021 Apr 5;2(1):14-31.
doi: 10.1007/s42994-021-00043-4. eCollection 2021 Mar.

Remodeling of the cell wall as a drought-tolerance mechanism of a soybean genotype revealed by global gene expression analysis

Affiliations

Remodeling of the cell wall as a drought-tolerance mechanism of a soybean genotype revealed by global gene expression analysis

Flaviane Silva Coutinho et al. aBIOTECH. .

Abstract

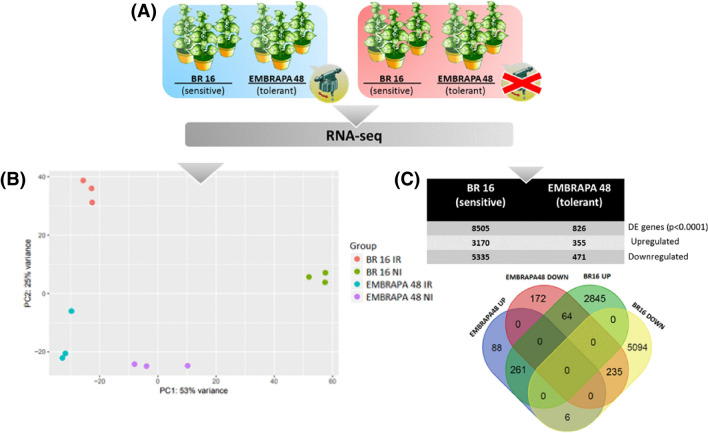
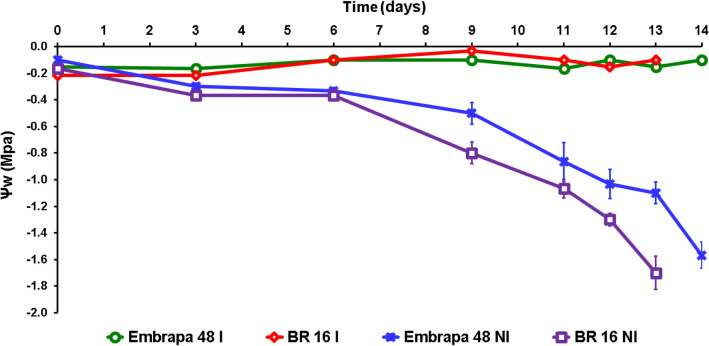
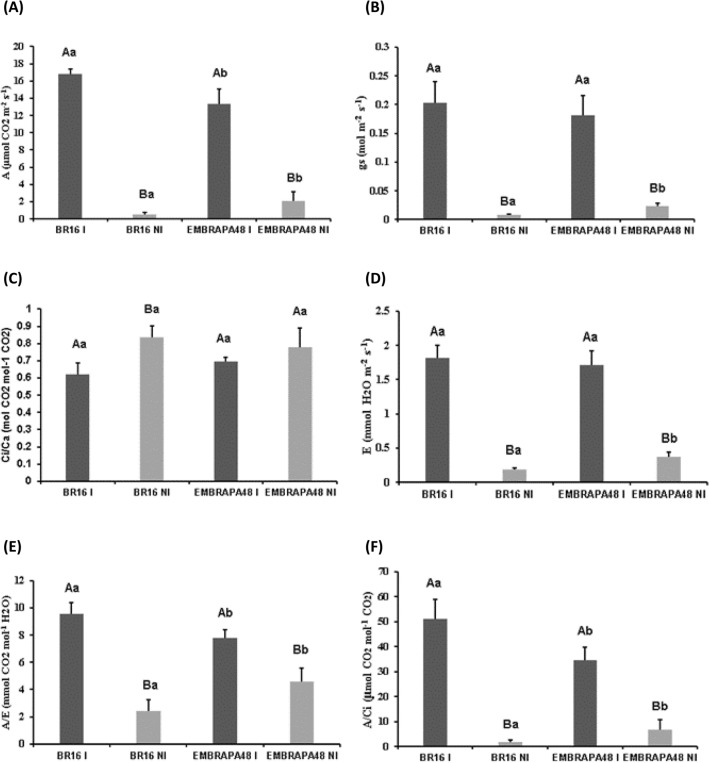
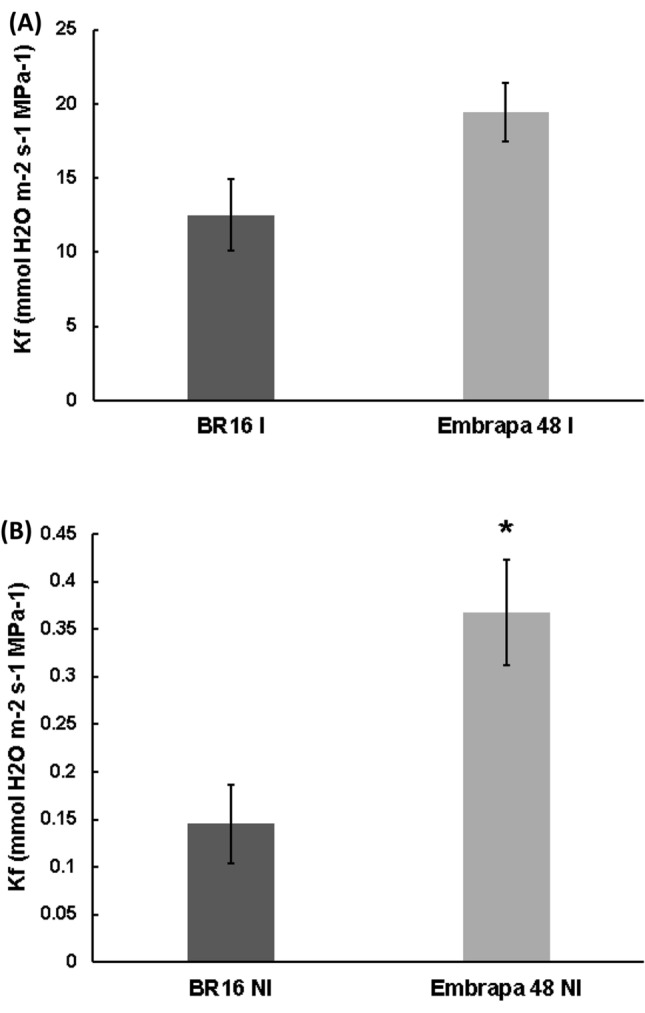
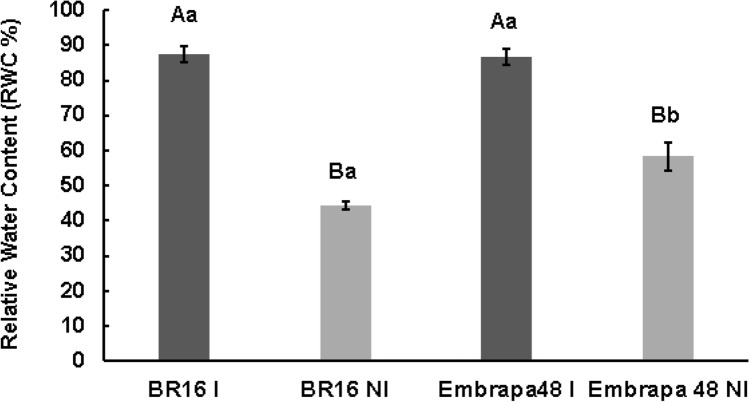
Drought stress is major abiotic stress that affects soybean production. Therefore, it is widely desirable that soybean becomes more tolerant to stress. To provide insights into regulatory mechanisms of the stress response, we compared the global gene expression profiles from leaves of two soybean genotypes that display different responses to water-deficit (BR 16 and Embrapa 48, drought-sensitive and drought-tolerant, respectively). After the RNA-seq analysis, a total of 5335 down-regulated and 3170 up-regulated genes were identified in the BR16. On the other hand, the number of genes differentially expressed was markedly lower in the Embrapa 48, 355 up-regulated and 471 down-regulated genes. However, induction and expression of protein kinases and transcription factors indicated signaling cascades involved in the drought tolerance. Overall, the results suggest that the metabolism of pectin is differently modulated in response to drought stress and may play a role in the soybean defense mechanism against drought. This occurs via an increase of the cell wall plasticity and crosslink, which contributed to a higher hydraulic conductance (K f) and relative water content (RWC%). The drought-tolerance mechanism of the Embrapa 48 genotype involves remodeling of the cell wall and increase of the hydraulic conductance to the maintenance of cell turgor and metabolic processes, resulting in the highest leaf RWC, photosynthetic rate (A), transpiration (E) and carboxylation (A/C i). Thus, we concluded that the cell wall adjustment under drought is important for a more efficient water use which promoted a more active photosynthetic metabolism, maintaining higher plant growth under drought stress.

Supplementary information: The online version contains supplementary material available at 10.1007/s42994-021-00043-4.

Keywords: Gene expression; Molecular physiology; RNA-seq; Water-use efficiency.


Conflict of interest statement

Conflict of interestOn behalf of all authors, the corresponding author states that there is no conflict of interest.

Figures

Fig. 1
Fig. 1
Overall gene expression in response to drought stress. In a soybean plants BR 16 and Embrapa 48 exposed to a gradual drought regime to isolate total RNA for transcriptomic analysis. The water potential was measured by Scholander pump. In the blue box irrigated plants and in the red stressed plants. In b transcriptome data used for the principal component analysis, showing distinct clusters of the different soybean genotypes in Irrigated conditions (IR) and not irrigated (NI). In c number of differently expressed genes in drought conditions in both genotypes and Venn diagram showing the comparison of the number of genes differentially expressed. Proportion of significant results (p ≤ 0.0001, log2 fold change ≥ 2 for up-regulated and ≤  − 2 for down-regulated genes)
Fig. 2
Fig. 2
Validation of (black filled square) RNA-Seq data by real-time (ash filled square) RT-qPCR. The expression variation of the RNAs analyzed in this study in plants submitted to water-deficit compared with controls. The graph in a shows the expression variation in the genotype BR16, and the graph in b shows the expression variation in the genotype EMBRAPA48. Genes encoding Dehydryn, LEA18, CP31B (chloroplast RNA-binding protein 31B), CA2 (carbonic anhydrase), NPF4.7 (protein NRT1/PTR family 4.7), RGXT2 and RGXT1 were analyzed. The data represent the mean ± SE (n = 3)
Fig. 3
Fig. 3
Over-representation analysis of down-regulated genes using the Gene Ontology biological process database. In a clusters containing down-regulated genes in the sensitive genotype BR16. In b clusters containing down-regulated genes in the tolerant genotype EMBRAPA 48. The size of the node represents the integration of genes and the thickness of the edge shows a significant Kappa value
Fig. 4
Fig. 4
Over-representation analysis of up-regulated genes using the Gene Ontology biological process database. In a clusters containing up-regulated genes in the sensitive genotypeBR16. In b clusters containing up-regulated genes in the tolerant genotype EMBRAPA 48. The size of the node represents the integration of genes and the thickness of the edge shows a significant Kappa value
Fig. 5
Fig. 5
Temporal profile of leaf pre-dawn water potential (ψw) for two soybean cultivars, sensitive (BR 16), and tolerant (Embrapa 48). Each point represents the mean ± standard error (n = 5, where n represents the number of plants), IR irrigated, NI non-irrigated treatments
Fig. 6
Fig. 6
Effect of water-deficit on the a assimilation rate of CO2 (A), in b stomatal conductance (gs), in c ratio Ci/Ca, in d transpiratory rate E, in e water use efficiency (WUEi) as A/E and in f carboxylation efficiency as A/Ci. IR irrigated, NI non-irrigated treatments. Each bar represents the mean + standard error (n = 5, where n represents the number of plants, t test p < 0.5). Different lower case letters indicate significant differences between averages of the same treatment in different cultivars, and capital letters show significant differences between averages within the same cultivar under different treatments
Fig. 7
Fig. 7
Leaf hydraulic conductance (Kf) of the soybean genotypes. Each bar represents the mean ± standard error (n = 5, where n represents the number of plants, t test p < 0.5). In a IR for irrigated and in b for NI non-irrigated treatments
Fig. 8
Fig. 8
Relative water content RWC (%) of the leaves of BR16 and Embrapa 48 genotypes under different water potential. Bars represent ± standard error (n = 5, where n represents the number of plants, t test p < 0.5). Different lower case letters indicate significant differences between averages of the same treatment in different cultivars, and capital letters show significant differences between averages within the same cultivar under different treatments. IR irrigated, NI non-irrigated treatments

References

    1. Aimar D, Calafat M, Andrade AM, Carassay L, Abdala GI, Molas ML (2011) Drought tolerance and stress hormones: from model organisms to forage crops. Intech: from model organisms to forage crops
    1. Anbazhagan K, Bhatnagar-Mathur P, Vadez V, Dumbala SR, Kishor PB, Sharma KK. Dreb1a overexpression in transgenic chickpea alters key traits influencing plant water budget across water regimes. Plant Cell Rep. 2015;34:199–210. - PubMed
    1. Anders S, Huber W (2012) Differential expression of RNA-Seq data at the gene level–the DESeq package. Heidelberg, Germany: European Molecular Biology Laboratory (EMBL)
    1. Asano T, Hayashi N, Kikuchi S, Ohsugi R. CDPK-mediated abiotic stress signaling. Plant Signal Behav. 2012;7:817–821. - PMC - PubMed
    1. Baldoni E, Genga A, Cominelli E. Plant MYB transcription factors: their role in drought response mechanisms. Int J Mol Sci. 2015;16:15811–15851. - PMC - PubMed

LinkOut - more resources