. 2022 Oct 28;10(5):879-890.
doi: 10.14218/JCTH.2021.00175. Epub 2022 Jan 4.

Regulatory Effect of JAK2/STAT3 on the Immune Function of Endotoxin-tolerant Dendritic Cells and its Involvement in Acute Liver Failure

Affiliations

Regulatory Effect of JAK2/STAT3 on the Immune Function of Endotoxin-tolerant Dendritic Cells and its Involvement in Acute Liver Failure

Yukai Chen et al. J Clin Transl Hepatol. .

Abstract

Background and aims: Acute liver failure (ALF) is a potentially fatal clinical syndrome with no effective treatment. This study aimed to explore the role of Janus kinase 2/signal transducer and activator of transcription 3 (JAK2/STAT3) pathway in modulating the phenotype and immune function of endotoxin-tolerant dendritic cells (ETDCs). In addition, we explored the use of EDTCs in an experimental model of ALF and investigated the associated mechanisms.

Methods: In the in vitro experiment, ETDCs were transfected with adenovirus to induce SOCS1+/+ETDCs and SOCS1-/-ETDCs. Thereafter, costimulatory molecules and mixed lymphocyte reaction were assessed. Experimental mice were randomly divided into normal control, ALF, ALF+mock-ETDCs, ALF+SOCS1+/+ETDCs, ALF+AG490, and ALF+AG490+SOCS1+/+ETDCs groups. We examined the therapeutic effect of adoptive cellular immunotherapy by tail-vein injection of target ETDCs 12 h before ALF modeling. AG490, a JAK2/STAT3 inhibitor, was used in the in vivo experiment to further explore the protective mechanism of SOCS1+/+ETDCs.

Results: Compared with control ETDCs, SOCS1+/+ETDCs had lower expression of costimulatory molecules, weaker allostimulatory ability, lower levels of IL-6 and TNF-α expression and higher IL-10 secretion. SOCS1-/-ETDCs showed the opposite results. In the in vivo experiments, the ALF+SOCS1+/+ETDCs and ALF+AG490+SOCS1+/+ETDCs groups showed less pathological damage and suppressed activation of JAK2/STAT3 pathway. The changes were more pronounced in the ALF+AG490+SOCS1+/+ETDCs group. Infusion of SOCS1+/+ETDCs had a protective effect against ALF possibly via inhibition of JAK2 and STAT3 phosphorylation.

Conclusions: The SOCS1 gene had an important role in induction of endotoxin tolerance. SOCS1+/+ETDCs alleviated lipopolysaccharide/D-galactosamine-induced ALF by downregulating the JAK2/STAT3 signaling pathway.

Keywords: Acute; Dendritic cells; Endotoxin tolerance; Janus kinase 2/signal transducers and activators of transcription 3 (JAK2/STAT3); Liver failure.


Conflict of interest statement

ML has been an editorial board member of Journal of Clinical and Translational Hepatology since 2019. Other authors have no conflict of interests related to this publication.

Figures
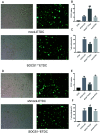
Fig. 1
Fig. 1. Successful transduction of Ad-SOCS1 and Ad-shSOCS1, and the effect of SOCS1 expression on the allostimulatory ability of ETDCs.
(A) Characteristic dendritic protrusions and adenovirus transfection efficiency of SOCS1+/+ETDCs and mock-ETDCs. (B) qRT-PCR assay of SOCS1 expression. Data are fold-change relative to the ETDCs group. (C) Proliferation of T cells after cocultivation in each group. Mean±standard deviation of three independent assays; ns, not significanct. *p<0.05, **p<0.01, ***p <0.001 vs. ETDCs group, and #p<0.05, ##p<0.01, ###p<0.001 vs. ETDCs+LPS group. (D) Characteristic dendritic protrusions and adenovirus transfection efficiency of SOCS1−/−ETDCs and shmock-ETDCs. (E) qRT-PCR assay of SOCS1 expression. Data are fold-change relative to the ETDCs group. (F) T cell proliferation of after cocultivation in each group. Mean±standard deviation of three independent assays; ns, not significant. *p<0.05, **p<0.01, ***p<0.001 vs. ETDCs group, and #p<0.05, ##p<0.01, ###p<0.001 vs. ETDCs+LPS group (Ad-SOCS1, Adenovirus encoding SOCS1; Ad-shSOCS1, small hairpin RNA (shRNA)-encoding SOCS1; ETDCs, endotoxin-tolerant dendritic cells; qRT-PCR, quantitative real-time reverse transcription-polymerase chain reaction; SOCS1, suppressor of cytokine signaling 1).
Fig. 2
Fig. 2. Silencing of SOCS1 modulates the function of ETDCs.
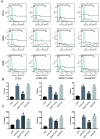
(A, B) Flow cytometry analysis of cell costimulatory molecules CD11c, CD80, and CD86 of ETDCs. (C) ELISA results showing IL10, TNF-α, and IL6 levels in the supernatant. Mean±standard deviation of three independent experiments; ns, not significant. *p<0.05, **p<0.01, ***p<0.001 vs. ETDCs group, and #p<0.05, ##p<0.01, ###p<0.001 vs. ETDC+LPS group.
Fig. 3
Fig. 3. Overexpression of SOCS1 modulates the function of ETDCs.
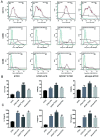
(A, B) Flow cytometry analysis of cell costimulatory molecules CD11c, CD80, and CD86 of ETDCs. (C) ELISA results showing IL10, TNF-α, and IL6 levels in the supernatant. Mean±standard deviation of three independent assays; ns: not significant. *p<0.05, **p<0.01, ***p<0.001 vs. ETDC group, and #p<0.05, ##p<0.01, ###p<0.001 vs. ETDC+LPS group.
Fig. 4
Fig. 4. SOCS1+/+ETDCs protect against liver injury induced by LPS/D-GalN and affect the production of inflammatory cytokines in serum.
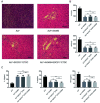
(A) Hematoxylin and eosin-stained liver sections, 100×. (B) Serum AST and ALT levels. (C) ELISA results showing serum IL10, TNF-α, and IL6 levels. Mean±standard deviation of three independent assays. *p<0.05, **p<0.01, ***p<0.001 vs. control group, #p<0.05, ##p<0.01, ###p<0.001 vs. ALF group, &p<0.05, &&p<0.01, &&&p<0.001 (ALT, alanine aminotransferase; AST, aspartate aminotransferase).
Fig. 5
Fig. 5. SOCS1+/+ETDCs inhibit JAK2/STAT3 signaling.
(A, B) Western blot assays of the relative expression of SOCS1, JAK2, STAT3, p-JAK2, and p-STAT3 proteins. Mean±standard deviation of three independent assays. *p<0.05, **p<0.01, ***p<0.001 vs. control group, and #p<0.05, ##p<0.01, ###p<0.001 vs. ALF group, &p<0.05, &&p<0.01, &&&p<0.001 (JAK2/STAT3, Janus kinase 2/signal transducer and activator of transcription 3).
Fig. 6
Fig. 6. SOCS1+/+ETDCs regulate the percentage of Th17 and Treg among spleen lymphocytes in liver injury caused by LPS/D-GalN.
(A) Flow cytometry assay of Th17 and Treg cells in spleen. (B) The percentages of Th17 and Treg cells in spleens from each group. Mean±standard deviation of three independent assays. *p<0.05, **p<0.01, ***p<0.001 vs. control group, and #p<0.05, ##p<0.01, ###p<0.001 vs. ALF group, &p<0.05, &&p<0.01, &&&p<0.001 (Treg, regulatory T Cell).
Fig. 7
Fig. 7. AG490 or SOCS1+/+ETDCs protect against liver injury induced by LPS/D-GalN and affect serum levels of inflammatory cytokines.
(A) Hematoxylin and eosin-stained liver sections 100× (B) Serum ALT and AST levels. (C) ELISA results of IL10, TNF-α, and IL6 serum levels. Mean±standard deviation of three independent assays; ns, not significant. *p<0.05, **p<0.01, ***p<0.001 vs. ALF group.
Fig. 8
Fig. 8. AG490 or SOCS1+/+ETDCs inhibit JAK2/STAT3 signaling.
(A, B) Western blot assays of the relative expression of JAK2, STAT3, SOCS1, p-JAK2, and p-STAT3 proteins. Mean±standard deviation of three independent assays; ns, not significant. *p<0.05, **p<0.01, ***p<0.001 vs. ALF group.

Similar articles

Cited by

References

    1. Bernal W, Wendon J. Acute liver failure. N Engl J Med. 2013;369(26):2525–2534. doi: 10.1056/NEJMra1208937. - DOI - PubMed
    1. Stravitz RT, Lee WM. Acute liver failure. Lancet. 2019;394(10201):869–881. doi: 10.1016/s0140-6736(19)31894-x. - DOI - PMC - PubMed
    1. Heymann F, Tacke F. Immunology in the liver—from homeostasis to disease. Nat Rev Gastroenterol Hepatol. 2016;13(2):88–110. doi: 10.1038/nrgastro.2015.200. - DOI - PubMed
    1. Balan S, Saxena M, Bhardwaj N. Dendritic cell subsets and locations. Int Rev Cell Mol Biol. 2019;348:1–68. doi: 10.1016/bs.ircmb.2019.07.004. - DOI - PubMed
    1. Han P, Hanlon D, Sobolev O, Chaudhury R, Edelson RL. Ex vivo dendritic cell generation-A critical comparison of current approaches. Int Rev Cell Mol Biol. 2019;349:251–307. doi: 10.1016/bs.ircmb.2019.10.003. - DOI - PubMed