

Regional and National Trends of Adult Living Donor Liver Transplantation in the United States Over the Last Two Decades
- PMID: 36304492
- PMCID: PMC9547266
- DOI: 10.14218/JCTH.2021.00538
Regional and National Trends of Adult Living Donor Liver Transplantation in the United States Over the Last Two Decades
Abstract
Background and aims: Liver organ shortage remains a major health burden in the US, with more patients being waitlisted than the number of liver transplants (LTs) performed. This study investigated US national and regional trends in living donor LT (LDLT) and identified factors associated with recipient survival.
Methods: We retrospectively analyzed LDLT recipients and donors from the United Network Organ Sharing/Organ Procurement Transplant Network database from 1998 until 2019 for clinical characteristics, demographic differences, and survival rate. National and regional trends in LDLT, recipient outcomes, and predictors of survival were analyzed.
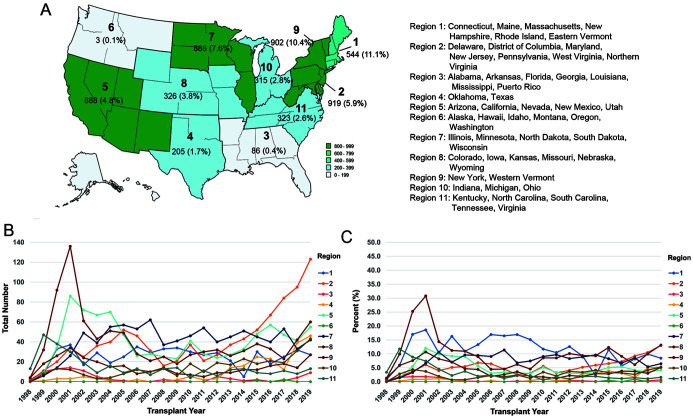
Results: Of the 223,571 candidates listed for an LT, 57.5% received an organ, of which only 4.2% were LDLTs. Annual adult LDLTs first peaked at 412 in 2001 but experienced a significant decline to 168 by 2009. LDLTs then gradually increased to 445 in 2019. Region 2 had the highest LDLT numbers (n=919), while region 1 had the highest proportion (11.1%). Overall, post-LT mortality was 21.4% among LDLT recipients. Post-LDLT survival rates after 1-, 5-, and 10-years were 92%, 87%, and 70%, respectively. Interval analysis (2004-2019) showed that patients undergoing LDLT in recent years had lower mortality than in earlier years (hazard ratio=0.81, 95% confidence interval=0.75-0.88).
Conclusions: Following a substantial decline after a peak in 2001, the number of adult LDLTs steadily increased from 2011 to 2019. However, LDLTs still constitute the minority of the transplant pool in the US. Life-saving policies to increase the use of LDLTs, particularly in regions of high organ demand, should be implemented.
Keywords: Liver transplantation; Living donor; Organ demand; Survival; UNOS.
© 2022 Authors.
Conflict of interest statement
AB declares activities with Scientific Advisory Boards, Intercept, Primary Investigator for trials for Gilead and CARA. BS has been an editorial board member of Journal of Clinical and Translational Hepatology since 2016. All other authors have no conflict of interests related to this publication.
Figures


References
-
- Organ Procurement and Transplantation Network. National Data. 2021. Available from: https://optn.transplant.hrsa.gov/data/view-data-reports/national-data/
LinkOut - more resources
Full Text Sources