. 2022 Oct 11:13:1006951.
doi: 10.3389/fphys.2022.1006951. eCollection 2022.

Sex differences in apoptosis do not contribute to sex differences in blood pressure or renal T cells in spontaneously hypertensive rats

Affiliations

Sex differences in apoptosis do not contribute to sex differences in blood pressure or renal T cells in spontaneously hypertensive rats

Mahmoud Abdelbary et al. Front Physiol. .

Abstract

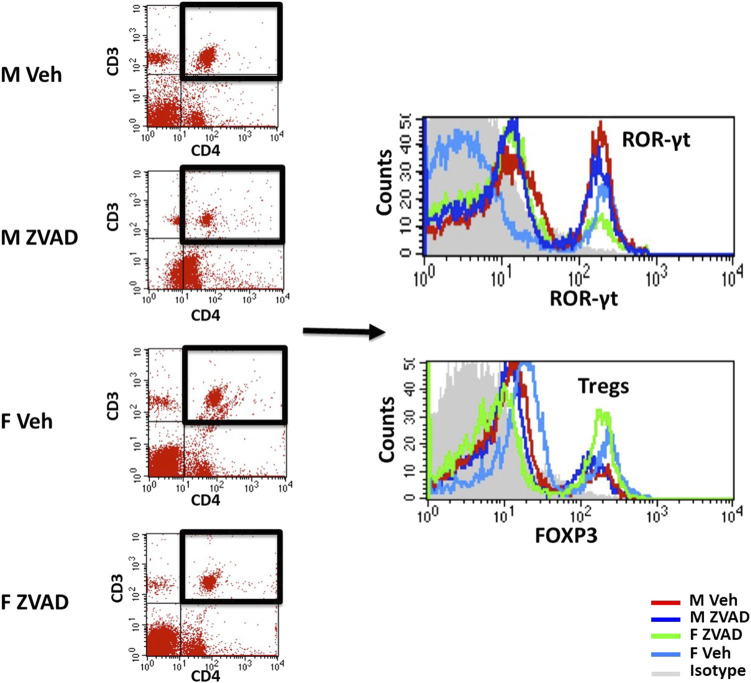
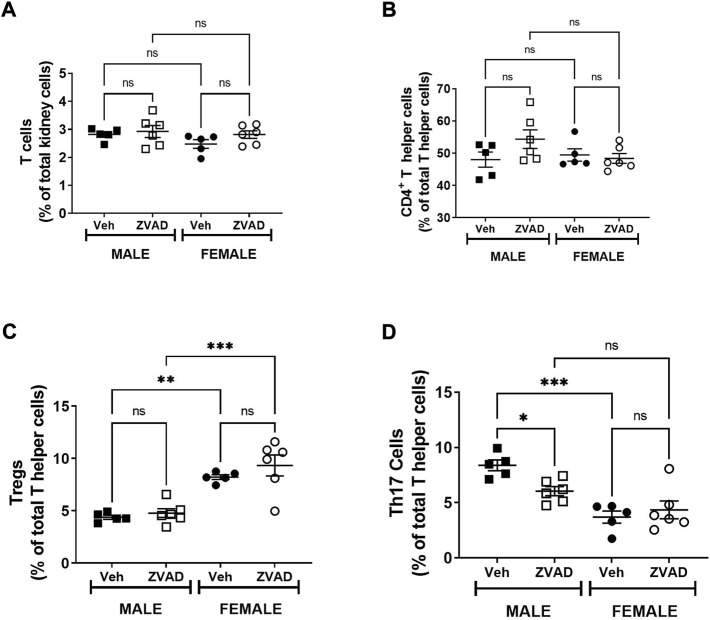
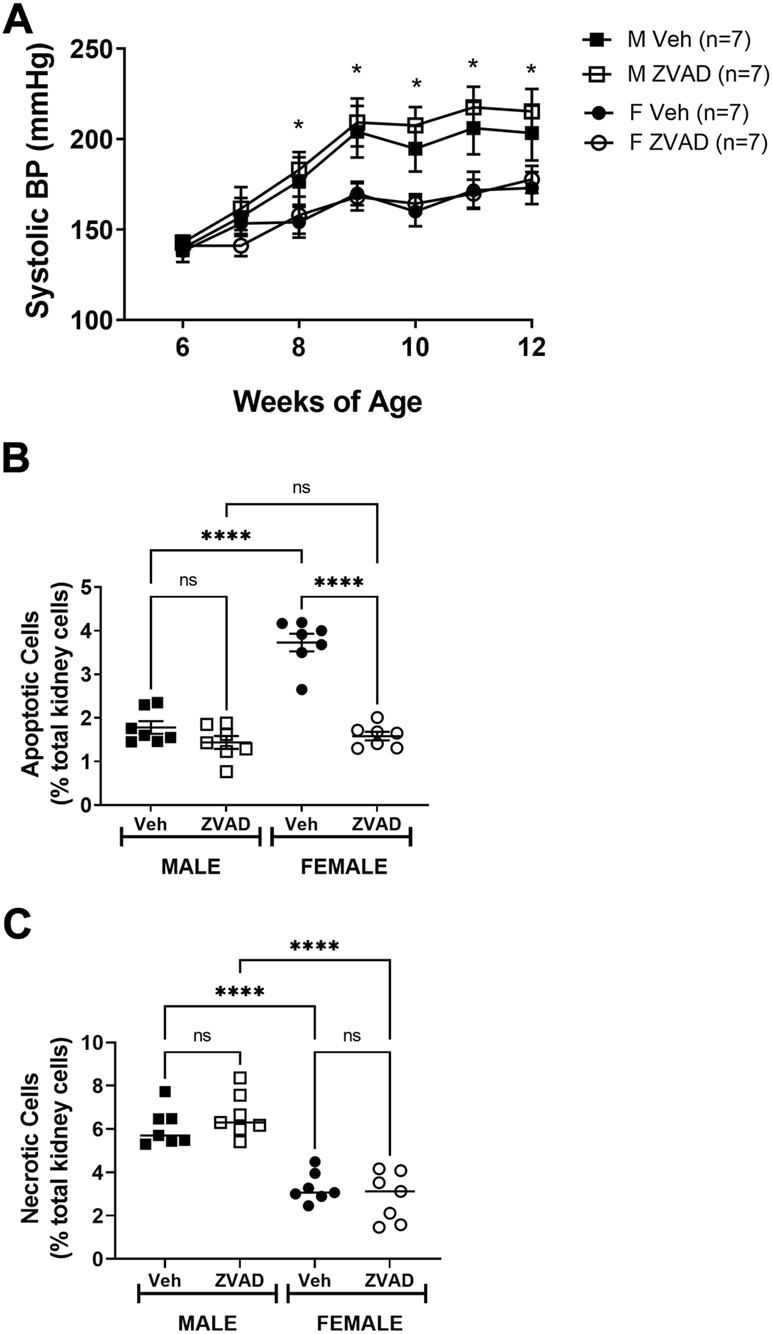
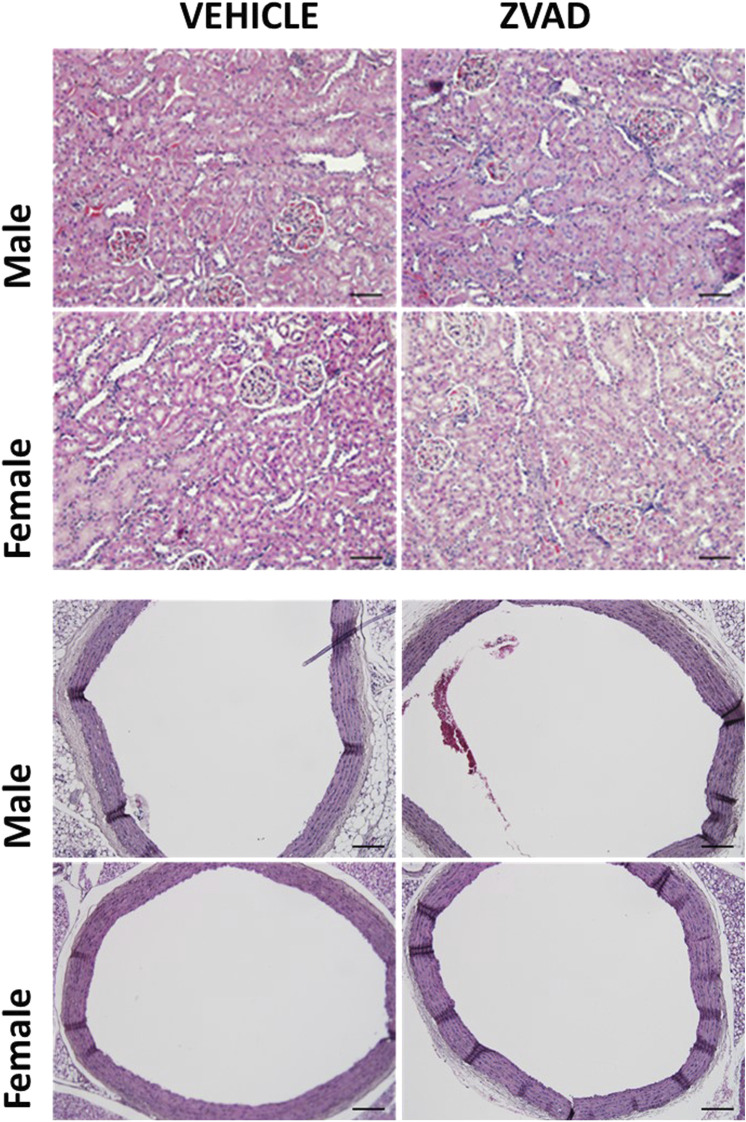
Apoptosis is a physiological and anti-inflammatory form of cell death that is indispensable for normal physiology and homeostasis. Several studies have reported aberrant activation of apoptosis in various tissues at the onset of hypertension. However, the functional significance of apoptosis during essential hypertension remains largely undefined. The current study was designed to test the hypothesis that apoptosis contributes to sex differences in blood pressure and the T cell profile in spontaneously hypertensive rats (SHR). Apoptosis was measured in kidney, aorta and spleen of 13-week-old adult hypertensive male and female SHR. Female SHR had greater renal and aortic apoptosis compared to age-matched males; apoptosis in the spleen was comparable between the sexes. Based on well-established sex differences in hypertension, we tested the hypothesis that greater apoptosis in female SHR contributes to the lower BP and pro-inflammatory profile compared to males. Male and female SHR were randomized to receive vehicle or ZVAD-FMK, a cell permeable pan-caspase inhibitor, in established hypertension from 13 to 15 weeks of age or at the onset of hypertension from 6 to 12 weeks or age. Treatment with ZVAD-FMK lowered renal apoptosis in both studies, yet neither BP nor renal T cells were altered in either male or female SHR. These results suggest that apoptosis does not contribute to the control or maintenance of BP in male or female SHR or sex differences in renal T cells.

Keywords: cell death; gender; inflammation; kidney; necrosis.


Conflict of interest statement

The authors declare that the research was conducted in the absence of any commercial or financial relationships that could be construed as a potential conflict of interest.

Figures

FIGURE 1
FIGURE 1
Apoptosis was analyzed by flow cytometry. Shown are representative scatterplots of flow cytometry gating strategy showing the selection of single cells and exclusion of cell debris based on forward scatter and side scatter.
FIGURE 2
FIGURE 2
T cell profiles were analyzed by flow cytometry. Shown are representative scatterplots of flow cytometry gating strategy showing the selection of single cells and exclusion of cell debris based on forward scatter and side scatter. T cells were analyzed based on the expression of CD3 and/or CD4. Total CD3+CD4+ T cells were further gated for expression of ROR-γt for T helper 17 cells or Foxp3 for Tregs.
FIGURE 3
FIGURE 3
Female SHR have greater renal and aortic apoptosis compared to age matched males. Apoptotic cell death was measured by flow cytometric analysis and expressed as % of total gated cells in whole kidney [panel (A)], thoracic aorta [panel (B)] and spleen [panel (C)] from 13 week old male and female spontaneously hypertensive rats (SHR; n = 6). Protein expression of renal caspase-3 (pro and active) was measured by Western blotting. Representative blots are in panel (D) with mean data in panels (E,F). Data were compared using unpaired student-t test.
FIGURE 4
FIGURE 4
Treatment with ZVAD-FMK for 2 weeks lowers renal apoptosis, but did not change BP in male or female SHR. Mean arterial blood pressure (MAP) was measured via telemetry in male (M) and female (F) spontaneously hypertensive rats (SHR) treated with vehicle (veh) or ZVAD-FMK (ZVAD) from 13 to 15 weeks of age [panel (A); n = 5–8]. Apoptotic [panel (B)] and necrotic [panel (C)] cell death were measured by flow cytometric analysis and expressed as % of total gated kidney cells in the same rats. MAP data within each sex were analyzed using repeated measures ANOVA with Tukey’s multiple comparisons test. Between group comparisons were made by 2-way ANOVA; * indicates p < 0.05 vs. female SHR. Flow cytometry data were compared using 2-way ANOVA followed by Tukey’s multiple comparisons test; **** indicates p < 0.0001; *** indicates p = 0.0001; NS indicates not significant.
FIGURE 5
FIGURE 5
Treatment with ZVAD-FMK for 2 weeks does not increase circulating pro-inflammatory cytokines in male or female SHR. Circulating levels of TNF-α [panel (A)], TGF-β [panel (B)], and IL-10 [panel (C)] were measured by ELISA in the plasma isolated from male and female spontaneously hypertensive rats (SHR) treated with vehicle (veh) or ZVAD-FMK (ZVAD) from 13 to 15 weeks of age (n = 5–6). Data were compared using 2-way ANOVA followed by Tukey’s multiple comparisons test; ** indicates p < 0.01; NS indicates not significant.
FIGURE 6
FIGURE 6
Treatment with ZVAD-FMK for 2 weeks decreases Th17 cells in male SHR. T cells were measured in kidneys isolated from male and female spontaneously hypertensive rats (SHR) treated with vehicle (veh) or ZVAD-FMK (ZVAD) from 13 to 15 weeks of age (n = 5–6). The following T cells were measured: total CD3+ T cells [panel (A)], CD4+ T helper cells [panel (B)], T regulatory cells [Tregs; CD3+CD4+FOXP3+; panel (C)] and T helper [Th17 cells (CD3+CD4+ROR- γ+; panel (D)]. CD3+ T cells were expressed as % total renal cells. CD4+ T cells were expressed as % total CD3+ T cells. Tregs and Th17 cells were expressed as % CD3+CD4+ T cells. Data were compared using 2-Way ANOVA followed by Tukey’s multiple comparisons test; *** indicates p < 0.001; ** indicates p < 0.01; NS indicates not significant.
FIGURE 7
FIGURE 7
Treatment with ZVAD-FMK for 6 weeks starting prior to the development of hypertension did not change BP in male or female SHR. Systolic BP was measured by tail-cuff in male (M) and female (F) spontaneously hypertensive rats (SHR) treated with vehicle (veh) or ZVAD-FMK (ZVAD) from 6 to 12 weeks of age [n = 7; panel (A)]. Apoptotic [panel (B)] and necrotic [panel (C)] cell death were measured by flow cytometric analysis and expressed as % of total gated kidney cells in the same rats. BP data within each sex were analyzed using repeated measures ANOVA with Tukey’s multiple comparisons test and between group comparisons were made by 2-way ANOVA; * indicates p < 0.05 vs. female SHR. Flow cytometry data were compared using 2-way ANOVA followed by Tukey’s multiple comparisons test; **** indicates p < 0.0001; NS indicates not significant.
FIGURE 8
FIGURE 8
Treatment with ZVAD-FMK for 6 weeks does not increase circulating pro-inflammatory cytokines in male or female SHR. Circulating levels of TNF-α [panel (A)], TGF-β [panel (B)], and IL-10 [panel (C)] were measured by ELISA in the plasma isolated from male and female spontaneously hypertensive rats (SHR) treated with vehicle (veh) or ZVAD-FMK (ZVAD) from 6 to 12 weeks of age (n = 6). Data were compared using 2-way ANOVA followed by Tukey’s multiple comparisons test; **** indicates p < 0.0001; ** indicates p < 0.01; * indicated p < 0.05; NS indicates not significant.
FIGURE 9
FIGURE 9
Treatment with ZVAD-FMK for 6 weeks did not change either splenic or renal T cell profile. T cells were measured in kidneys isolated from male and female spontaneously hypertensive rats (SHR) treated with vehicle (veh) or ZVAD-FMK (ZVAD) from 6 to 12 weeks of age (n = 7). The following T cells were measured: total CD3+ T cells [panel (A)], CD4+ T helper cells [panel (B)], T regulatory cells [Tregs; CD3+CD4+FOXP3+; panel (C)] and T helper (Th17 cells [CD3+CD4+ROR- γ+; panel (D)]. CD3+ T cells were expressed as % total renal cells. CD4+ T cells were expressed as % total CD3+ T cells. Tregs and Th17 cells were expressed as % CD3+CD4+ T cells. Data were compared using 2-Way ANOVA followed by Tukey’s multiple comparisons test; *** indicates p < 0.001; * indicated p < 0.05; NS indicates not significant.
FIGURE 10
FIGURE 10
Treatment with ZVAD-FMK for 6 weeks did not change either aortic or renal structure. Aorta and kidney were harvested and formalin fixed from male and female spontaneously hypertensive rats (SHR) treated with vehicle (veh) or ZVAD-FMK (ZVAD) from 6 to 12 weeks of age (n = 3).

Similar articles

Cited by

References

    1. Abdelbary M., Rafikova O., Gillis E. E., Musall J. B., Baban B., O'Connor P. M., et al. (1979). Necrosis contributes to the development of hypertension in male, but not female, spontaneously hypertensive rats. Hypertension 74, 1524–1531. 10.1161/hypertensionaha.119.13477 - DOI - PMC - PubMed
    1. Adams N. M., Grassmann S., Sun J. C. (2020). Clonal expansion of innate and adaptive lymphocytes. Nat. Rev. Immunol. 20, 694–707. 10.1038/s41577-020-0307-4 - DOI - PubMed
    1. Baumann M., Janssen B. J. A., Rob Hermans J. J., BaRtholome R., Smits J. F. M., Struijker Boudier H. A. J. (2009). Renal medullary effects of transient prehypertensive treatment in young spontaneously hypertensive rats. Acta Physiol. 196, 231–237. 10.1111/j.1748-1716.2008.01916.x - DOI - PubMed
    1. Bennett M. R. (1999). Apoptosis of vascular smooth muscle cells in vascular remodelling and atherosclerotic plaque rupture. Cardiovasc. Res. 41, 361–368. 10.1016/s0008-6363(98)00212-0 - DOI - PubMed
    1. Bonnet F., Cao Z., Cooper M. E. (2001). Apoptosis and angiotensin II: Yet another renal regulatory system? Exp. Nephrol. 9, 295–300. 10.1159/000052624 - DOI - PubMed

LinkOut - more resources