. 2022 Sep 22:10:2100711.
doi: 10.1109/JTEHM.2022.3208585. eCollection 2022.

Wearable Sensors Improve Prediction of Post-Stroke Walking Function Following Inpatient Rehabilitation

Affiliations

Wearable Sensors Improve Prediction of Post-Stroke Walking Function Following Inpatient Rehabilitation

Megan K O'Brien et al. IEEE J Transl Eng Health Med. .

Abstract

Objective: A primary goal of acute stroke rehabilitation is to maximize functional recovery and help patients reintegrate safely in the home and community. However, not all patients have the same potential for recovery, making it difficult to set realistic therapy goals and to anticipate future needs for short- or long-term care. The objective of this study was to test the value of high-resolution data from wireless, wearable motion sensors to predict post-stroke ambulation function following inpatient stroke rehabilitation.

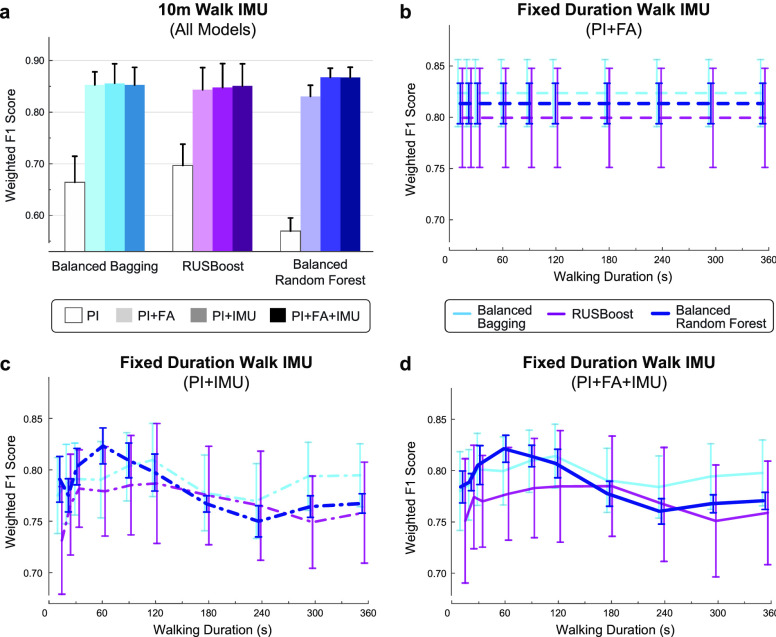
Method: Supervised machine learning algorithms were trained to classify patients as either household or community ambulators at discharge based on information collected upon admission to the inpatient facility (N=33-35). Inertial measurement unit (IMU) sensor data recorded from the ankles and the pelvis during a brief walking bout at admission (10 meters, or 60 seconds walking) improved the prediction of discharge ambulation ability over a traditional prediction model based on patient demographics, clinical information, and performance on standardized clinical assessments.

Results: Models incorporating IMU data were more sensitive to patients who changed ambulation category, improving the recall of community ambulators at discharge from 85% to 89-93%.

Conclusions: This approach demonstrates significant potential for the early prediction of post-rehabilitation walking outcomes in patients with stroke using small amounts of data from three wearable motion sensors.

Clinical impact: Accurately predicting a patient's functional recovery early in the rehabilitation process would transform our ability to design personalized care strategies in the clinic and beyond. This work contributes to the development of low-cost, clinically-implementable prognostic tools for data-driven stroke treatment.

Keywords: Accelerometers; digital health; machine learning; stroke (medical condition); wearable sensors.


Figures

FIGURE 1.
FIGURE 1.
Discharge predictions using fixed distance IMU data. (a) Top 10 important features for a model utilizing patient information (PI) and IMU data. Features from IMUs placed on the pelvis and unaffected ankle were selected via backward elimination for optimized model performance (red box). (b) Models trained with IMU sensor data from 10 m of walking at admission show improved classification of discharge walking level over a model using patient information and functional assessment scores (FA) alone. Bars show the average and SD of each metric across 100 iterations. Acc = Accelerometer; Gyr = Gyroscope; US = Unaffected Side; AS = Affected Side; AoM = Amount of motion; SampEn = Sample entropy.
FIGURE 2.
FIGURE 2.
Feature importance and selected features for the benchmark and full model. Red box indicates the features selected via backward elimination for use in the optimized model training and testing. (a) Benchmark model (PI+FA), with 1 feature selected (10MWT score at admission), (b) Fixed distance full model (PI+FA+IMU), with 8 features selected (10MWT score at admission and 7 features from the ankles and pelvis IMUs), (c) Fixed duration full model (PI+FA+IMU), with 2 features selected (10MWT score at admission and a feature from the affected ankle IMU). No patient information (PI) features were selected for use in any model. Acc = Accelerometer; Gyr = Gyroscope; US = Unaffected Side; AS = Affected Side; AoM = Amount of motion; SampEn = Sample entropy.
FIGURE 3.
FIGURE 3.
Model performance for household and community ambulators. (a) Confusion matrices for each model. (b) Percentage of patients correctly classified based on functional walking categories at IRF admission and discharge. While all models correctly classified 100% of patients who maintained the same level of walking function (Household formula image Household, formula image; Community formula image Community, formula image), only models that included IMU data were able to identify any patients who changed functional walking level during IRF treatment (Household formula image Community, formula image).
FIGURE 4.
FIGURE 4.
Model predictions by participant. Correct and incorrect predictions for each participant’s discharge ambulation ability in relation to their Adm and Dis 10WMT scores (fixed distance model). Dashed lines illustrate the 0.4 m/s threshold that differentiates the community and household ambulator classes.
FIGURE 5.
FIGURE 5.
Discharge prediction performance using fixed duration IMU data. (a) Maximum model performance was observed using the first 60 s of IMU data (red box) recorded during a 6MWT at IRF admission. (b) Top 10 important features for the PI+IMU model using 60 s of IMU walking data. Features from the bilateral ankles were selected via backward elimination for optimized model performance (red box). (c) Models trained with 60 s of IMU walking data also show improved prediction of discharge walking level over the benchmark PI+FA model. Bars show the average and SD of each metric across 100 iterations. Note that the PI+FA fixed duration model performance (shown here) varies slightly from the fixed distance model (Fig 1b) since data from a larger number of patients were available for training.
FIGURE 6.
FIGURE 6.
Study overview. (a) Placement of three wireless inertial measurement units (IMUs) at the pelvis and bilateral ankles. Coordinate system is shown for the pelvis sensor; ankle sensors are rotated by 90° clockwise. (b) Model pipeline for predicting discharge walking function and determining the relative value of IMU data. Separate models were trained using IMU data recorded during a fixed distance walk (10 m during the 10MWT) or a fixed duration walk (the first 10–360 s of the 6MWT) upon admission to a post-stroke IRF program.
FIGURE 7.
FIGURE 7.
Example effect of random seed state on model performance. The stochastic nature of the explored algorithms causes variation in the weighted F1 score with random seeds. To evaluate broader performance of each model, performance was averaged across 100 repetitions with incrementing random seed. The Balanced Random Forest typically demonstrated higher average performance and lower fluctuation, as illustrated in this fixed duration model (60s walk) with all data inputs (PI+FA+IMU).
FIGURE 8.
FIGURE 8.
Algorithm selection for fixed distance and fixed duration models. Average and SD of weighted F1 score across 100 iterations for three algorithms to predict discharge ambulation outcomes. Pre-optimized performance is shown for different model types trained under the (a) fixed distance (10m walk), or (b-d) fixed duration (10-360s walk) paradigms, relative to the amount of IMU data used for analysis. Models without IMU data (PI and PI+FA) are unaffected by the amount of IMU walking data. PI models were not considered for the fixed duration analysis given their low performance, shown in (a). The Balanced Random Forest algorithm was selected to compare downstream models for its typically higher performance (e.g., maximum average performance for 10m walk and 60s walk) and lower fluctuation across conditions.
FIGURE 9.
FIGURE 9.
Feature elimination for fixed distance and fixed duration models. Average and SD of weighted F1 score across 100 iterations is shown as a function of the number of features, as determined by backward elimination, for (a) fixed distance (10m walk), and (b) fixed duration (60s walk) paradigms. The subset of features that maximized the weighted F1 score were selected to optimize model training and testing. Performance for the PI+FA model is identical between the fixed distance and fixed duration models since this model is unaffected by the amount of IMU walking data.
FIGURE 10.
FIGURE 10.
Hyperparameter selection. Hyperparameters for the Balanced Random Forest algorithm were tuned using a randomized search cross-validation. Red boxes indicate the values used for each optimized model based on majority-selection from 100 iterations with different random seed states.

Similar articles

Cited by

References

    1. Perry J., Garrett M., Gronley J. K., and Mulroy S. J., “Classification of walking handicap in the stroke population,” Stroke, vol. 26, no. 6, pp. 982–989, Jun. 1995. - PubMed
    1. Michael K. M., Allen J. K., and Macko R. F., “Reduced ambulatory activity after stroke: The role of balance, gait, and cardiovascular fitness,” Arch. Phys. Med. Rehabil., vol. 86, no. 8, pp. 1552–1556, Aug. 2005. - PubMed
    1. Akulwar I. S., “Impact of cognitive impairments on functional ambulation in stroke patients,” Int. J. Phys. Med. Rehabil., vol. 7, no. 528, p. 2, 2019.
    1. Granger C. V., Markello S. J., Graham J. E., Deutsch A., and Ottenbacher K. J., “The uniform data system for medical rehabilitation: Report of patients with stroke discharged from comprehensive medical programs in 2000–2007,” Amer. J. Phys. Med. Rehabil., vol. 88, no. 12, pp. 961–972, Dec. 2009. - PubMed
    1. Buntin M. B.et al., “Inpatient rehabilitation facility care use before and after implementation of the IRF prospective payment system,” RAND Corp., Santa Monica, CA, USA, Tech. Rep. TR-257-CMS, 2006. Accessed: Sep. 19, 2022. [Online]. Available: https://www.rand.org/pubs/technical_reports/TR257.html

Publication types