BCL7A-containing SWI/SNF/BAF complexes modulate mitochondrial bioenergetics during neural progenitor differentiation
- PMID: 36305367
- PMCID: PMC9713712
- DOI: 10.15252/embj.2022110595
BCL7A-containing SWI/SNF/BAF complexes modulate mitochondrial bioenergetics during neural progenitor differentiation
Erratum in
-
Author Correction: BCL7A-containing SWI/SNF/BAF complexes modulate mitochondrial bioenergetics during neural progenitor differentiation.EMBO J. 2024 Oct;43(19):4437-4438. doi: 10.1038/s44318-024-00157-7. EMBO J. 2024. PMID: 39223333 Free PMC article.
Abstract
Mammalian SWI/SNF/BAF chromatin remodeling complexes influence cell lineage determination. While the contribution of these complexes to neural progenitor cell (NPC) proliferation and differentiation has been reported, little is known about the transcriptional profiles that determine neurogenesis or gliogenesis. Here, we report that BCL7A is a modulator of the SWI/SNF/BAF complex that stimulates the genome-wide occupancy of the ATPase subunit BRG1. We demonstrate that BCL7A is dispensable for SWI/SNF/BAF complex integrity, whereas it is essential to regulate Notch/Wnt pathway signaling and mitochondrial bioenergetics in differentiating NPCs. Pharmacological stimulation of Wnt signaling restores mitochondrial respiration and attenuates the defective neurogenic patterns observed in NPCs lacking BCL7A. Consistently, treatment with an enhancer of mitochondrial biogenesis, pioglitazone, partially restores mitochondrial respiration and stimulates neuronal differentiation of BCL7A-deficient NPCs. Using conditional BCL7A knockout mice, we reveal that BCL7A expression in NPCs and postmitotic neurons is required for neuronal plasticity and supports behavioral and cognitive performance. Together, our findings define the specific contribution of BCL7A-containing SWI/SNF/BAF complexes to mitochondria-driven NPC commitment, thereby providing a better understanding of the cell-intrinsic transcriptional processes that connect metabolism, neuronal morphogenesis, and cognitive flexibility.
Keywords: BCL7A; SWI/SNF/BAF complex; cognitive function; mitochondrial OXPHOS; neural progenitor cells (NPCs).
© 2022 The Authors. Published under the terms of the CC BY NC ND 4.0 license.
Figures

- A
Schematic representation of stem cell differentiation into neural progenitors and subsequently into neurons.
- B
Graphical summary of SWI/SNF/BAF complex subunits that are part of the ATPase (orange) or core (dark blue) modules. Highlighted in yellow are the subunits that have been assessed by immunoblot analyses.
- C, D
Representative western blots and respective densitometries (right panel) for the selected SWI/SNF/BAF complex subunits (n = 3–5 biological replicates). Arrow heads indicate nonspecific bands, while # symbol highlights BAF53B.
- E
Schematic representation of nucleosome‐bound SWI/SNF/BAF complex. BCL7A is stably incorporated in the ATPase module, with amino acids residues at the N‐terminus of BCL7A interacting with BRM/BRG1 or with H2A/H2B dimers.
- F
Representative immunoblots of co‐immunoprecipitation (co‐IP) experiments in eNPCs (top panels) and smNPCs (bottom panels). Co‐IPs were performed with antibodies against BAF170 (top) and BRG1 (bottom). Inputs are homogenates from eNPCs (left) and smNPCs (right). IgG indicates IgG‐bound Sepharose beads (as controls), while IP indicates immunoprecipitated samples after elution from the beads. Arrow head indicates BCL7A band at the correct MW.
- G
Immunofluorescence staining of BCL7A (purple) along with actin, nestin, and β‐III tubulin (green) as well as GFAP (white) in iPSCs, smNPCs, and smNPC‐derived neurons and astrocytes, respectively. Arrow heads indicate GFAP‐positive glial cells with low BCL7A expression. Scale bars = 20 μm.
- H
Western blot analysis of BCL7A and BAF170 in cortex and hippocampus of embryonic (E17.5), early postnatal (PD0 and PD7), and adult (PD120) mouse brain tissue showing a progressive temporal reduction of protein levels in the analyzed tissues.
- I
Immunofluorescence staining of BCL7A (purple), EdU (green), and NeuN (white) in embryonic (E17.5) and adult (PD120) hippocampal brain sections. EdU was used to label proliferating NPCs, whereas NeuN was used as a neuronal marker. Scale bars = 50 μm (left panels) and 10 μm (right panels).
- A
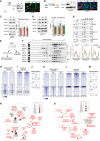
Immunoblot and immunofluorescence staining of BCL7A (red) in eNPCs isolated from Bcl7a wt/wt (wt) and Bcl7a ko/ko (ko) embryos (E13.5). Nestin (green) was used as NPC marker, whereas DAPI (blue) was used to stain nuclei. Scale bar = 10 μm.
- B
Immunoblot and immunofluorescence staining of BCL7A in smNPCs. Two different BCL7A knockout clones (KO1 and KO2) were used along with the parental (P) cell line. Scale bar = 10 μm.
- C, D
Representative western blots and respective densitometries (right panel) for selected SWI/SNF/BAF complex subunits in (C) eNPCs (n = 4 biological replicates) and (D) smNPCs (n = 3–6 biological replicates).
- E–G
BCL7A KO and wt smNPCs were used for (F) nuclear isolation followed by density sedimentation and (G) differential salt extraction. Top panels show representative immunoblots for selected SWI/SNF/BAF complex subunits and respective densitometries are shown below (n = 3 biological replicates).
- H, I
Heatmaps of SMARCA4/BRG1 and H3K27me3 ChIP‐seq in wt and BCL7A KO eNPCs.
- J
Average density plots for SMARCA4/BRG1 occupancy around the TSS in wt and BCL7A KO eNPCs.
- K, L
Heatmaps of SMARCA4/BRG1 and H3K27me3 ChIP‐seq in parental and BCL7A KO smNPCs.
- M
Average density plots for SMARCA4/BRG1 occupancy around the TSS in parental and BCL7A KO smNPCs.
- N, O
Simplified ClueGO pathway analysis of enriched GO terms (Biological Processes) performed on genes with reduced SMARCA4/BRG1 occupancy (FC > 1) at promoter regions in (N) BCL7A KO vs. wt eNPCs and (O) BCL7A KO clones compared to parental smNPCs.
- A
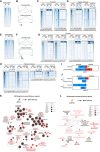
Heatmaps of SMARCA4/BRG1 occupancy in wt and BCL7A KO eNPCs around the TSS (±1 kb).
- B
Average density plots for SMARCA4/BRG1 occupancy at promoter and putative enhancer regions in wt and BCL7A KO eNPCs.
- C, D
Heatmaps of SMARCA4/BRG1 and H3K27me3 ChIP‐seq in wt and BCL7A KO eNPCs at promoter (C) and putative enhancer (D) regions.
- E
Heatmaps of SMARCA4/BRG1 occupancy in parental and BCL7A KO smNPCs around the TSS (±1 kb).
- F
Average density plots for SMARCA4/BRG1 occupancy at promoter and putative enhancer regions in parental and BCL7A KO smNPCs.
- G, H
Heatmaps of SMARCA4/BRG1 and H3K27me3 ChIP‐seq in parental and BCL7A KO smNPCs at promoter (G) and putative enhancer (H) regions.
- I
Number of genes showing decreased/increased (FC > 1) BRG1/SMARCA4 enrichment at promoter or putative enhancer regions in BCL7A KO eNPCs.
- J
Number of genes with increased/decreased (FC > 1) SMARCA4/BRG1 binding at promoter or putative enhancer regions in BCL7A KO smNPCs.
- K
Simplified ClueGO pathway analysis of enriched GO terms performed on genes with reduced SMARCA4/BRG1 occupancy (FC > 1) at putative enhancer regions in BCL7A KO vs. wt eNPCs. Node colors and size represent significance of pathway enrichment and number of associated genes, respectively. Lines between nodes indicate overlapping genes within terms.
- L
Simplified ClueGO enrichment analysis of GO terms performed on genes showing reduced SMARCA4/BRG1 occupancy at putative enhancer regions in both BCL7A KO clones compared to parental smNPCs. Node colors and size represent significance of pathway enrichment and number of associated genes, respectively. Lines between nodes indicate overlapping genes within terms.

Immunofluorescence staining of BCL7A KO and wt eNPCs following 7 days of spontaneous differentiation. The percentage of cells positive for β‐III tubulin, GFAP or the oligodendrocyte marker SOX10 is shown on the right (n = 3–6 technical replicates from three independent experiments). Scale bar = 50 μm.
On the left, RT‐PCR analysis of Bcl7a and Bcl7b expression in wt and BCL7B KO eNPCs (n = 2 per genotype). On the right, immunoblots of samples from spontaneously differentiated wt and BCL7B KO eNPCs. Respective densitometries are shown on the right (n = 4 biological replicates).
Immunofluorescence staining of BCL7B KO and wt eNPCs following 7 days of spontaneous differentiation. The percentage of cells positive for β‐III tubulin, GFAP or the oligodendrocyte marker SOX10 is shown on the right (n = 3–6 technical replicates from three independent experiments). Scale bar = 50 μm.
Representative confocal images of eNPCs upon 7 days spontaneous differentiation. BCL7A staining is shown in red.
Representative confocal images of wt eNPCs upon 7 days spontaneous differentiation. BCL7B staining is shown in red. Scale bar = 10 μm.
- A
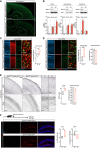
Immunofluorescence staining for BCL7A in control and Bcl7a fl/fl ; Nestin‐Cre tg/wt mice at postnatal day (PD) 3. Scale bar = 200 μm.
- B
Western blot (top) and RT‐PCR analyses (bottom; n = 4) of samples from cortex (Cx), hippocampal (Hip) and cerebellar (Cer) tissues from adult Bcl7a fl/fl ; Nestin‐Cre tg/wt (ko) and control (ctr) mice.
- C, D
EdU in vivo experiments in control (n = 3–4) and Bcl7a fl/fl ; Nestin‐Cre tg/wt (n = 3) mice at PD3. Pregnant females were injected with EdU at E14.5–15.5 and pups were sacrificed 3 days after birth. Images show immunofluorescence stainings for EdU and NeuN (C) or EdU and S100β (D) in cortical brain sections. Quantification of EdU+ NeuN− (C) or EdU+ S100β+ cells along with cortical thickness measurement (D) are shown on the right. Yellow arrows indicate EdU+ NeuN− (C) or EdU+ S100β+ cells (D). Scale bar = 100 and 50 μm.
- E
Brightfield immunostainings for GFAP (upper panels) and NeuN (lower panels) in cortical brain sections from control (n = 3) and Bcl7a fl/fl ; Nestin‐Cre tg/wt (n = 3) mice at PD6. Quantification of the relative GFAP‐immunoreactive area is shown on the right along with measurements for the cortical thickness. Scale bar = 100 and 50 μm.
- F
EdU in vivo experiments in control (n = 6) and Bcl7a fl/fl ; Nestin‐Cre tg/wt (n = 5) mice. Animals received three EdU injections 4 h apart and were sacrificed 24 h after the last injections. Images show immunofluorescence staining of hippocampal brain sections for EdU (green) and DCX (red). Quantifications of EdU+ and DCX+ cells are shown on the right. Scale bar = 50 μm.
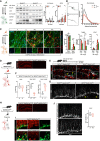
Immunoblots of spontaneously differentiated wt and BCL7A KO eNPCs. Samples were collected at the indicated differentiation time points. Respective densitometries are shown on the right (n = 6–7 biological replicates).
Sholl analysis of β‐III tubulin‐positive immature wt and BCL7A KO neurons following 7 days of spontaneous eNPC differentiation (n = 4 biological replicates, each experiment with 10–15 cells per condition). Scale bar = 20 μm.
Immunofluorescence staining (central panel) and quantification (right panel) of β‐III tubulin‐ and GFAP‐positive cells as well as RT‐PCR analysis (right panels) of spontaneously differentiated iPSC‐derived parental and BCL7A KO smNPCs (n = 3–7 biological replicates). Scale bar = 50 μm.
Immunofluorescence staining of BCL7A expression in hippocampal sections from adult control and Bcl7a fl/fl ; Nestin‐Cre tg/wt mice. Scale bar = 200 μm.
EdU experiments in adult mice. Animals were injected with EdU twice daily for 3 days and sacrificed 21 days thereafter. Images show immunofluorescence stainings for EdU (green), doublecortin (DCX, white), and S100β (red) in hippocampal brain sections from Bcl7a wt/wt ; Nestin‐Cre tgt/wt (as control) and Bcl7a fl/fl ; Nestin‐Cre tg/wt mice. Representative EdU+ DCX+ (yellow arrow heads) or EdU+ S100β+ (yellow asterisk) double‐labeled cells are indicated in the insets. Scale bar = 50 and 20 μm (for insets).
Quantification of EdU+ (left panel), EdU+ DCX+ (middle panel), and EdU+ S100β+ (right panel) cells within the hippocampal dentate gyrus (DG) of adult control (n = 4) and Bcl7a fl/fl ; Nestin‐Cre tg/wt (n = 5) animals.
Immunofluorescence staining for DCX+ cells within the DG region of adult Bcl7a fl/fl ; Nestin‐Cre wt/wt (as control) and Bcl7a fl/fl ; Nestin‐Cre tg/wt animals. Confocal imaging analysis shows a lower number, misalignment, and reduced neuritic complexity of DCX+ labeled cells in BCL7A KO mice compared to controls. Yellow arrows indicate misaligned DCX+ cells. Scale bar = 50 μm.
Immunofluorescence staining of BCL7A (red) of hippocampal sections from Bcl7a fl/fl ; Baf53b‐Cre wt/wt (as control) and Bcl7a fl/fl ; Baf53b‐Cre tg/wt mice. Scale bar = 200 μm.
Immunofluorescence staining of BCL7A (red) and DCX (green) in hippocampal sections of control and Bcl7a fl/fl ; Baf53b‐Cre tg/wt mice. Yellow arrow indicates dividing cells, whereas yellow asterisks mark differentiating immature neurons. Scale bar = 5 μm.
Immunofluorescence staining for DCX (white) within the DG region of adult control and Bcl7a fl/fl ; Baf53b‐Cre tg/wt mice. Representative images show no obvious difference in number, morphology or alignment of DCX+ labeled cells. Quantification of DCX+ labeled cells in control and Bcl7a fl/fl ; Baf53b‐Cre tg/wt mice is shown on the right (n = 3 per genotype). Scale bar = 50 μm.

- A, B
EdU in vivo experiments in wt (n = 4) and Bcl7b ko/ko (n = 3–5) mice. (A) Animals received three EdU injections 4 h apart and were sacrificed 24 h after the last injections. Images show immunofluorescence staining of hippocampal brain sections for EdU (green) and DCX (red). Quantifications of EdU+ and DCX+ cells are shown on the right. Scale bar = 50 μm. (B) Animals were injected with EdU twice daily for three consecutive days and sacrificed 21 days thereafter. Images show immunofluorescence stainings for EdU (green), and SOX10 (red) in hippocampal brain sections from Bcl7b ko/ko and wt littermates. Scale bar = 50 and 20 μm (for insets). Quantification of EdU+ and EdU+ SOX10+ cells is shown on the right.
- C
Confocal images of immunofluorescence stainings for BCL7A, NeuN (neurons) and GFAP (astrocytes) in control, Bcl7a fl/fl ; Baf53b‐Cre tg/wt , Bcl7a fl/fl ; Nestin‐Cre tg/wt mice. Bcl7a fl/fl ; Baf53b‐Cre wt/wt mice show high BCL7A immunoreactivity in NeuN‐positive neurons while GFAP‐positive cells express BCL7A only at low levels (left panels). In Bcl7a fl/fl ; Baf53b‐Cre tg/wt mice, BCL7A immunoreactivity can still be seen in NeuN‐negative, GFAP‐positive cells (yellow arrow) while it is absent in NeuN‐positive neurons (middle panels). Bcl7a fl/fl ; Nestin‐Cre tg/wt mice do not shown BCL7A expression in neither NeuN‐ nor GFAP‐positive cells (yellow asterisks). Scale bar = 10 and 5 μm (for cropped images).
- A
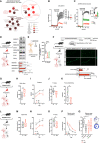
Simplified ClueGO pathway analysis of genes with reduced SMARCA4/BRG1 occupancy at promoter regions in BCL7A KO vs. wt eNPCs.
- B, C
Representative Ca2+ measurements in (B) wt vs. BCL7A KO cortical neurons (CN, 10 days in vitro) and in (C) smNPC‐derived parental and BCL7A KO neurons. Ca2+ changes were detected using Fluo‐4 and upon treatment with (B) 50 μM of glutamate (final concentration) and (C) 100 μM of glutamate (final concentration). Upper right panels report Ca2+ peaks (F) relative to baseline (F0). In (B) wt: n = 18 cells; ko: n = 23 cells (n = 2 independent experiments). In (C) P: n = 27 cells; KO1: n = 20 cells; KO2: n = 19 cells (n = 2 independent experiments).
- D
Immunoblot analysis of hippocampal tissues. Densitometries are shown on the right (ctr: n = 4–5 mice; ko: n = 3–4 mice).
- E
RT‐PCR analysis of FOS expression upon glutamate (100 μM for 10 min) stimulation in smNPC‐derived parental and BCL7A KO neurons (n = 5–6 biological replicates).
- F
Immunofluorescence staining of cFos in the dentate gyrus of adult Bcl7a fl/fl ; Baf53b‐Cre tg/wt (ko) mice and control (ctr) littermates. Mice were either kept in standard housing conditions (upper images; ctr: n = 4 mice; ko: n = 4 mice) or exposed to an enriched environment (lower images; ctr: n = 6 mice; ko: n = 5 mice). Quantification of cFos+ cells are shown below. Scale bar = 30 μm.
- G–K
Behavioral characterization of Bcl7a fl/fl ; Nestin‐Cre tg/wt (ko) mice compared to control (ctr) littermates. Animals were tested for their locomotor activity and coordination in (H) the open field (ctr: n = 13 mice; ko: n = 11 mice) and (I) RotaRod test (ctr: n = 12 mice; ko: n = 7 mice). Cognitive function was assessed in (J) the Y‐maze spontaneous alternation task (ctr: n = 13 mice; ko: n = 11 mice) and (K) fear conditioning paradigm (ctr: n = 11 mice; ko: n = 10 mice). The percentage of spontaneous alternations and freezing were used as measures for working and long‐term memory function, respectively.
- L–Q
Behavioral characterization of adult Bcl7a fl/fl ; Baf53b‐Cre tg/wt (nKO) mice compared to control (ctr) littermates. Locomotor activity and coordination were assessed in (M) the open field (ctr: n = 14 mice; nKO: n = 12 mice) and (N) RotaRod paradigm (ctr: n = 16 mice; nKO: n = 12 mice). Cognitive function was tested in (O) the Y‐maze (ctr: n = 11 mice; nKO: n = 11 mice) and (P, Q) Barnes maze test (ctr: n = 11 mice; nKO: n = 11 mice). Representative heatmaps of Barnes maze test are reported on the right. The time spent in target (T) and nontarget quadrants during the probe trial are shown on the right.
- A
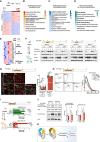
Heatmap of significantly dysregulated genes in BCL7A KO compared to wt eNPCs.
- B, C
GO terms of the top 10 biological processes for up‐ (B) and down‐regulated (C) genes.
- D
List of the top 10 significantly enriched canonical pathways for up‐ and down‐regulated genes.
- E
Heatmap of significantly dysregulated genes encoding components of the Wnt and Notch signaling pathways.
- F
Immunoblots of spontaneously differentiated wt and BCL7A KO eNPCs in presence of 1 μM of DAPT or 3 μM of CHIR99021.
- G
Immunofluorescence staining of eNPCs undergoing spontaneous differentiation for 7 days. BCL7A KO eNPCs were incubated for 72 h (24 h in proliferation plus 48 h in differentiation medium) with DMSO, 1 μM of DAPT, 3 μM of CHIR99021 or a combination of 1 μM of DAPT +3 μM of CHIR99021. Quantification of the β‐III tubulin‐positive or GFAP‐positive cells is shown on the right (n = 3–6 technical replicates from three independent experiments). Scale bar = 50 μm.
- H
Sholl analysis of β‐III tubulin‐positive immature neurons after 7 days of spontaneous differentiation (n = 4 biological replicates with > 30 cells per condition). Scale bar = 20 μm.
- I
mRNA expression levels of TUBB3 and GFAP at 15 and 25 days of spontaneously differentiating BCL7A KO compared parental smNPCs. BCL7A KO smNPCs were treated with DAPT, CHIR99021, DAPT + CHIR99021, or DMSO (as control = ctr) during the initial 7 days of spontaneous differentiation (n = 3–7 biological replicates).
- J
Immunoblots for non‐phospho (active) β‐catenin and TCF4/TCF7L2 in proliferating and 48 h‐differentiated wt and BCL7A KO eNPCs. Respective densitometries are shown on the right (n = 5–8 biological replicates per condition).
- K
Scheme depicts Notch activation and Wnt inhibition in BCL7A KO NPCs. As a consequence of BCL7A deficiency, cells exhibit a decreased expression of β‐catenin and TCF4/TCF7L2, which results in a negative feedback to Notch and Wnt pathways.

- A, B
Schematic representation of (A) Notch and (B) Wnt signaling pathways overlaid with IPA Molecule Activity Predictor based on differentially expressed genes (DEGs, surrounded by pink lines) in wt versus BCL7A KO eNPCs. Color intensity corresponds to fold change (red and green shades) or prediction strength (orange and blue shades).
- C
Genome browser screenshots of SMARCA4/BRG1 ChIP‐seq signals from BCL7A KO and wt eNPCs (left panels) as well as BCL7A KO and parental smNPCs (right panels) showing reduced SMARCA4/BRG1 occupancy at genes influencing Notch (Hey1/HEYL1, NOTCH3) and Wnt (Sox8, APCDD1, DKK1) signaling pathway.
- D
Genome browser screenshots of SMARCA4/BRG1 Chip‐seq signals in BCL7A KO and wt eNPCs showing reduced SMARCA4/BRG1 enrichment at Wnt signaling targets upon BCL7A loss.
- E
Immunofluorescence staining of wt eNPCs treated with DAPT (1 μM), CHIR99021 (3 μM) or DMSO (ctr) following 7 days of spontaneous differentiation. The percentage of cells positive for β‐III tubulin and GFAP is shown on the right (n = 2–4 technical replicates from three independent experiments). Scale bar = 50 μm.
- F
Sholl analysis of β‐III tubulin‐positive immature wt neurons following 7 days of spontaneous eNPC differentiation upon DAPT (1 μM), CHIR99021 (3 μM) or DMSO treatment (n = 3 biological replicates, each experiment with 10–15 cells per condition). Scale bar = 20 μm.
- G
mRNA expression levels of TUBB3 and GFAP of spontaneously differentiating parental smNPCs treated with DAPT, CHIR99021, DAPT + CHIR99021, or DMSO as control (ctr) (n = 4–6 biological replicates).
- H
Simplified schematic representation of canonical Wnt/β‐catenin signaling. In the absence of Wnt, cytosolic β‐catenin is constantly degraded through the actions of a destruction complex (AXIN, APC, CK1, GSK3) that phosphorylates β‐catenin, thereby tagging it for proteasomal degradation. Upon Wnt signaling activation, the destruction complex is recruited to LRP6 receptors resulting in the inhibition of β‐catenin phosphorylation, thereby allowing β‐catenin stabilization. Following translocation to the nucleus, β‐catenin then binds to DNA‐bound TCF/LEF complexes to initiate Wnt target gene expression.
- I
Immunoblots for non‐phospho (active) β‐catenin and TCF4/TCF7L2 in proliferating and 48 h‐differentiated wt and BCL7A KO eNPCs following treatment with DMSO or CHIR99021.
- J
Immunostaining for non‐phospho (active) β‐catenin in BCL7A KO smNPCs showing increased levels of nuclear β‐catenin upon Wnt signaling stimulation via CHIR99021 treatment. Quantification of fluorescence intensities within the nucleus are shown on the right (n = 1 biological replicate with 20–30 cells per condition). Scale bar = 5 μm.
- A
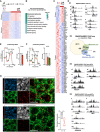
Heatmap of significantly dysregulated genes in BCL7A KO compared to wt eNPCs, which were exposed to differentiation medium for 48 h.
- B
IPA of up‐ and down‐regulated genes and relative prediction of the top 10 most significantly overrepresented canonical pathways.
- C
Heatmap of significantly dysregulated mitochondrial genes in BCL7A KO vs. wt eNPCs. Cells were exposed for 48 h to differentiation medium before RNAs were extracted.
- D
(D1) Genome browser screenshots of SMARCA4/BRG1 ChIP‐seq signals in eNPCs (left hand panels) and smNPCs (right hand panels). Peaks show the reduced SMARCA4/BRG1 occupancy at representative mitochondrial genes (i.e., Ndufc2, Cox6c, Gls/GLS) in control and BCL7A KO cells. (D2) Overlap between SMARCA4/BRG1‐bound genes, DEGs and mitochondrial genes identified in MitoCarta 3.0. (D3‐4) Genome browser screenshots of SMARCA4/BRG1 ChIP‐seq signals in (D3) eNPCs and (D4) smNPCs. Peaks show the reduced SMARCA4/BRG1 occupancy at transcription factors known to be involved in mitochondrial biogenesis.
- E, F
OCR measurements in in control and BCL7A KO (E) eNPCs and (F) smNPCs. On the right, it is reported the maximal respiration following treatment with the mitochondrial uncoupler FCCP (n = 5 biological replicates).
- G
Proximity ligation assay (PLA) for the OXPHOS subunits NDUFB8 and MTCO1 in adult hippocampal sections from Bcl7a fl/fl ; Baf53b‐Cre tg/wt (ko; n = 4) and control littermates (ctr; n = 4). Sections were co‐stained with TOM20 and NeuN to label mitochondria and neurons, respectively. The total number of PLA dots was normalized to the mitochondrial area (panel on the lower right). Scale bars = 10 μm.
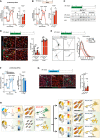
OCR measurements in wt and BCL7A KO eNPCs treated with 3 μM of CHIR99021 or DMSO (as control, ctr) for 24 h. The average maximal respiration upon FCCP treatment is shown on the right (n = 5–7 biological replicates).
OCR measurements in wt and BCL7A KO eNPCs following 48 h of spontaneous differentiation. BCL7A KO eNPCs were treated for 72 h (24 h in proliferation plus 48 h in differentiation medium) with CHIR99021 or DMSO. The average maximal respiration upon FCCP treatment is shown on the right (n = 4 biological replicates).
Immunoblot analysis of differentiated BCL7A KO eNPCs exposed to 3 μM of CHIR99021, in presence or absence of 20 nM of rotenone (rot). Antibodies against β‐III tubulin and actin were used.
Immunofluorescence staining of spontaneously differentiated eNPCs. BCL7A KO eNPCs were treated for 72 h (i.e., 24 h in proliferation plus 48 h in differentiation medium) with 3 μM of CHIR99021, in presence or absence of 20 nM of rotenone. Scale bar = 50 μm. Statistics are shown on the right (n = 3–6 technical replicates from three independent experiments).
Sholl analysis of β‐III tubulin‐positive immature neurons following 7 days of spontaneous differentiation. BCL7A KO eNPCs were exposed to 3 μM CHIR99021, in presence or absence of 20 nM of rotenone (n = 3 biological replicates). Scale bar = 20 μm.
Representative OCR measurements in BCL7A KO eNPCs treated with 5 and 10 μM of pioglitazone or DMSO (as control, ctr) for 24 h. The average maximal respiration upon FCCP treatment is shown on the right (n = 3 biological replicates).
Immunofluorescence staining of spontaneously differentiated eNPCs. BCL7A KO eNPCs were treated for 72 h (i.e., 24 h in proliferation plus 48 h in differentiation medium) with 5 μM of pioglitazone. The percentage of β‐III‐tubulin‐positive cells is shown on the right (n = 3–8 technical replicates from two independent experiments). Scale bar = 50 μm.
Schematic representation of our main findings. In differentiating NPCs, BCL7A expression is required for the correct regulation of Notch and Wnt pathways. Loss of BCL7A compromises mitochondrial bioenergetics and skews NPC differentiation toward glia. Pharmacological activation of Wnt/β‐catenin by CHIR99021 potentiates mitochondrial respiration and partially rescues the neurogenic defects of BCL7A KO NPCs. Conversely, rotenone‐mediated complex I deficiency abrogates the positive neurogenetic effect of CHIR99021. Stimulation of mitochondrial biogenesis by pioglitazone partially compensates for BCL7A deficiency during NPC differentiation.
References
-
- Adusumilli VS, Walker TL, Overall RW, Klatt GM, Zeidan SA, Zocher S, Kirova DG, Ntitsias K, Fischer TJ, Sykes AM et al (2021) ROS dynamics delineate functional states of hippocampal neural stem cells and link to their activity‐dependent exit from quiescence. Cell Stem Cell 28: 300–314 - PMC - PubMed
-
- Alajem A, Biran A, Harikumar A, Sailaja BS, Aaronson Y, Livyatan I, Nissim‐Rafinia M, Sommer AG, Mostoslavsky G, Gerbasi VR et al (2015) Differential association of chromatin proteins identifies BAF60a/SMARCD1 as a regulator of embryonic stem cell differentiation. Cell Rep 10: 2019–2031 - PubMed
Publication types
MeSH terms
Substances
Associated data
- Actions
- Actions
LinkOut - more resources
Full Text Sources
Molecular Biology Databases
Miscellaneous

