

BAF Complex Maintains Glioma Stem Cells in Pediatric H3K27M Glioma
- PMID: 36305736
- PMCID: PMC9716260
- DOI: 10.1158/2159-8290.CD-21-1491
BAF Complex Maintains Glioma Stem Cells in Pediatric H3K27M Glioma
Abstract
Diffuse midline gliomas are uniformly fatal pediatric central nervous system cancers that are refractory to standard-of-care therapeutic modalities. The primary genetic drivers are a set of recurrent amino acid substitutions in genes encoding histone H3 (H3K27M), which are currently undruggable. These H3K27M oncohistones perturb normal chromatin architecture, resulting in an aberrant epigenetic landscape. To interrogate for epigenetic dependencies, we performed a CRISPR screen and show that patient-derived H3K27M-glioma neurospheres are dependent on core components of the mammalian BAF (SWI/SNF) chromatin remodeling complex. The BAF complex maintains glioma stem cells in a cycling, oligodendrocyte precursor cell-like state, in which genetic perturbation of the BAF catalytic subunit SMARCA4 (BRG1), as well as pharmacologic suppression, opposes proliferation, promotes progression of differentiation along the astrocytic lineage, and improves overall survival of patient-derived xenograft models. In summary, we demonstrate that therapeutic inhibition of the BAF complex has translational potential for children with H3K27M gliomas.
Significance: Epigenetic dysregulation is at the core of H3K27M-glioma tumorigenesis. Here, we identify the BRG1-BAF complex as a critical regulator of enhancer and transcription factor landscapes, which maintain H3K27M glioma in their progenitor state, precluding glial differentiation, and establish pharmacologic targeting of the BAF complex as a novel treatment strategy for pediatric H3K27M glioma. See related commentary by Beytagh and Weiss, p. 2730. See related article by Mo et al., p. 2906.
©2022 The Authors; Published by the American Association for Cancer Research.
Figures
![Figure 3. Genetic knockout of SMARCA4 reduces chromatin accessibility and gene expression of OPC-like markers and enriches for the AC-like subpopulation in H3K27M-glioma cells. A, Schematic showing biological assessment of SMARCA4 knockout in H3.3K27M-glioma neurospheres by ChIP-seq for histone modifications (H3K27ac and H3K27me3), assay for transposase-accessible chromatin using sequencing (ATAC-seq) for chromatin accessibility, bulk RNA sequencing (RNA-seq), and scRNA-seq for gene expression. B, Heat map depicting z-scores for chromatin accessibility of OPC-like and AC-like marker genes in AAVS1-negative sgRNA control and SMARCA4-knockout (KO) BT869 neurospheres. C, Profile plot depicting the average H3K27ac ChIP-seq signal at BRG1 binding sites (n = 1,335) in BT869 4 days after SMARCA4 knockout. The plot shows 6.4-kb regions, centered on BRG1 peaks. D, Promoter-associated H3K27ac and H3K27me3 ChIP-seq signal for genes differentially expressed [determined by bulk RNA-seq analysis, log2(fold change [FC]) ≥ |1|] in SMARCA4-knockout cells (4 days after nucleofections). E, Profile plots (left) depicting the average H3K27ac signal at H3K27ac locations divided into positive (UP) or negative (DOWN) signal changes 4 days after SMARCA4 knockout. The plots show 6.4-kb regions, centered on H3K27ac peaks. Gene ontology (GO) analyses (right) performed on H3K27ac peaks with increased (n = 104, K27acUP) or decreased (n = 2,832, K27acDOWN) acetylation levels upon SMARC4 knockout for 4 days. The top five enriched GO terms are displayed. Pos. reg. of epidermal cell diff., positive regulation of epidermal cell differentiation.F, Heat map (left) depicting fold change (as log2) of H3K27ac levels after SMARCA4 knockout for 4 days. Displayed are log2 fold changes > |1|. Genes indicated on the heat map are OPC-like markers associated with decreased H3K27ac levels after SMARCA4 depletion. Gene tracks (right) displaying BRG1 ChIP-seq signal in BT869 neurospheres, as well as H3K27ac and ATAC-seq, at two OPC-like marker genes (TNR and EPN2). G, Changes in the percentage of cycling versus noncycling (left) and OPC- and AC-like cancer cell subpopulations (right) in SMARCA4-knockout and AAVS1-negative sgRNA control cells 4 days after knockout in BT869 neurospheres as determined by scRNA-seq analysis. H, Single-cell expression scores of upregulated genes in BT869 SMARCA4-knockout or AAVS1-negative sgRNA control knockout cells projected onto scRNA-seq data of pediatric H3K27M-glioma primary tumors (n = 6).](https://cdn.ncbi.nlm.nih.gov/pmc/blobs/3854/9716260/4ec3fa4b5a56/2880fig3.jpg)
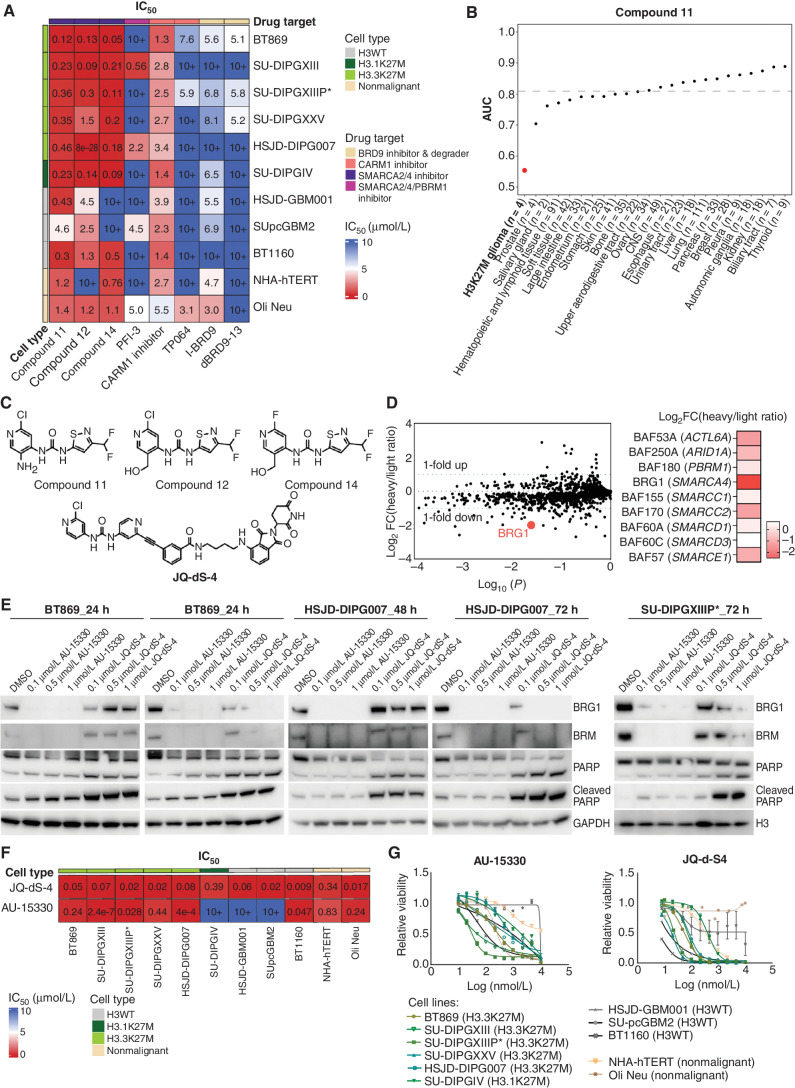
![Figure 6. Pharmacologic targeting of the BAF complex in vitro and in vivo mimics the biological effects of SMARCA4 depletion in H3K27M glioma. A, Schematic showing biological assessment of BRG1/BRM ATPase inhibitor– and degrader–treated H3.3K27M-glioma neurospheres for changes in chromatin accessibility by ATAC-seq, gene expression by bulk RNA sequencing (RNA-seq), and in vivo efficacy of chemical compounds in subcutaneous xenograft mouse models. B, Profile plot (top) depicting average ATAC-seq signal at BRG1 binding sites (n = 1,335) in BT869 (H3.3K27M-glioma) neurospheres after 24 hours of treatment with 1 μmol/L of BRG1/BRM inhibitors [Compound 11 (C11), Compound 14 (C14)] and degraders [JQ-dS-4 (JQ), AU-15330 (AU)] and DMSO controls. The plot shows 6.4-kb regions, centered on BRG1 peaks. Gene tracks (bottom) exemplify changes in chromatin accessibility observed at BRG1 binding sites. Displayed are BRG1 ChIP-seq signal in control BT869 cells as well as ATAC-seq data on the same cells after 24 or 48 hours of treatment with 1 μmol/L of BRG1/BRM inhibitors or degraders and DMSO controls. C, Biological processes (gene ontology analysis) enriched in regions with decreased accessibility in BT869 neurosphere cells treated for 24 hours with 1 μmol/L of Compound (Cmpd) 14, Compound 11, JQ-dS-4, or AU-15330 as determined by ATAC-seq. The number of genes is indicated by the size of the circle, and significance is depicted by the color scale. Reg., regulation of. D, Overlap of genes with reduced chromatin accessibility in drug-treated BT869 neurospheres (as determined by bulk ATAC-seq) with single-cell transcriptional metaprograms in H3K27M glioma. BT869 cells were treated with 1 μmol/L of either Compound 11 (C11), Compound 14 (C14), JQ-dS-4 (JQ), or AU-15330 (AU) for 24 hours. The color scale indicates the number of overlapping genes. E, A heat map showing z-scores of gene expression of OPC-like metaprogram marker genes with statistically significant changes upon Compound 11 or 14 treatments in BT869 neurospheres after 24 hours. Colored bars indicate z-scores of gene expression. rep, replicate.F, Tumor volume measurements (top) in BRG1/BRM inhibitor Compound 14 (20 mg/kg i.p. daily)– or BRG1/BRM degrader JQ-dS-4 (50 mg/kg i.p. daily)–treated mice bearing BT869 (H3.3K27M-glioma) subcutaneous tumors as compared with vehicle controls (n = 10 mice per group). Data are shown as mean ± SEM, P < 0.0001 (unpaired t test comparing vehicle and Compound 14 groups). Kaplan–Meier survival curves (bottom) of mice treated with either Compound 14 (20 mg/kg i.p. daily) or JQ-dS-4 (50 mg/kg i.p. daily) for 60 days in a subcutaneous BT869 xenograft model (n = 10 mice per group). The P value was calculated using the log-rank (Mantel–Cox) test. Gray bars show the duration of treatment. G, Tumor volume measurements (top) in BRG1/BRM inhibitor Compound 14 (20 mg/kg i.p. daily)–treated mice bearing SU-DIPGXIIIP* (H3.3K27M) subcutaneous tumors as compared with vehicle controls (n = 8 mice per group). Data are shown as mean ± SEM, P < 0.0001 (unpaired t test). Gray bar shows the duration of the treatment. Tumor volume (bottom) measured after 30 days of Compound 14 treatment compared with vehicle control in mice bearing SU-DIPGXIIIP* (H3.3K27M) subcutaneous tumors. P = 0.0017 (unpaired t test). H, Tumor volume measurements (top) in BRG1/BRM inhibitor Compound 14 (20 mg/kg i.p. daily)–treated mice bearing HSJD-GBM001 (H3WT) subcutaneous tumors as compared with vehicle controls (n = 10 mice per group). Data are shown as mean ± SEM, P = 0.578 (unpaired t test). Kaplan–Meier survival curves (bottom) of mice treated with Compound 14 (20 mg/kg i.p. daily) for 30 days in a subcutaneous xenograft model of HSJD-GBM001 (n = 10 mice per group). The P value was calculated using the log-rank (Mantel–Cox) test. Gray bars show the duration of treatment.](https://cdn.ncbi.nlm.nih.gov/pmc/blobs/3854/9716260/9c554723f22a/2880fig6.jpg)
Comment in
-
Epigenome Programming by H3.3K27M Mutation Creates a Dependence of Pediatric Glioma on SMARCA4.Cancer Discov. 2022 Dec 2;12(12):2906-2929. doi: 10.1158/2159-8290.CD-21-1492. Cancer Discov. 2022. PMID: 36305747 Free PMC article.
-
Epigenetic Rewiring Underlies SMARCA4-Dependent Maintenance of Progenitor State in Pediatric H3K27M Diffuse Midline Glioma.Cancer Discov. 2022 Dec 2;12(12):2730-2732. doi: 10.1158/2159-8290.CD-22-1030. Cancer Discov. 2022. PMID: 36458436 Free PMC article.
Comment on
-
Epigenome Programming by H3.3K27M Mutation Creates a Dependence of Pediatric Glioma on SMARCA4.Cancer Discov. 2022 Dec 2;12(12):2906-2929. doi: 10.1158/2159-8290.CD-21-1492. Cancer Discov. 2022. PMID: 36305747 Free PMC article.
References
-
- Schwartzentruber J, Korshunov A, Liu XY, Jones DT, Pfaff E, Jacob K, et al. Driver mutations in histone H3.3 and chromatin remodelling genes in paediatric glioblastoma. Nature 2012;482:226–31. - PubMed
-
- Mohammad F, Weissmann S, Leblanc B, Pandey DP, Hojfeldt JW, Comet I, et al. EZH2 is a potential therapeutic target for H3K27M-mutant pediatric gliomas. Nat Med 2017;23:483–92. - PubMed
Publication types
MeSH terms
Substances
Grants and funding
LinkOut - more resources
Full Text Sources
Other Literature Sources
Molecular Biology Databases
Miscellaneous
