. 2022 Nov;31(11):e4455.
doi: 10.1002/pro.4455.

Intrinsic protein disorder uncouples affinity from binding specificity

Affiliations

Intrinsic protein disorder uncouples affinity from binding specificity

Tamas Lazar et al. Protein Sci. 2022 Nov.

Abstract

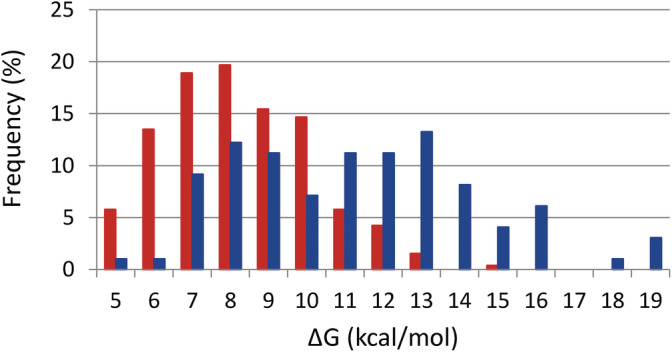
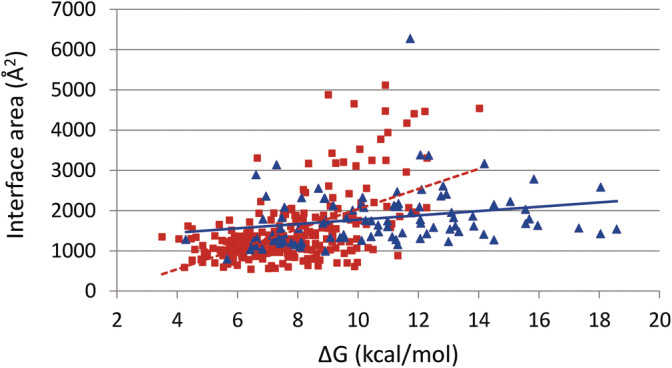
Intrinsically disordered proteins (IDPs) and intrinsically disordered regions (IDRs) of proteins often function by molecular recognition, in which they undergo induced folding. Based on prior generalizations, the idea prevails in the IDP field that due to the entropic penalty of induced folding, the major functional advantage associated with this binding mode is "uncoupling" specificity from binding strength. Nevertheless, both weaker binding and high specificity of IDPs/IDRs rest on limited experimental observations, making these assumptions more speculations than evidence-supported facts. The issue is also complicated by the rather vague concept of specificity that lacks an exact measure, such as the Kd for binding strength. We addressed these issues by creating and analyzing a comprehensive dataset of well-characterized ID/globular protein complexes, for which both the atomic structure of the complex and free energy (ΔG, Kd ) of interaction is known. Through this analysis, we provide evidence that the affinity distributions of IDP/globular and globular/globular complexes show different trends, whereas specificity does not connote to weaker binding strength of IDPs/IDRs. Furthermore, protein disorder extends the spectrum in the direction of very weak interactions, which may have important regulatory consequences and suggest that, in a biological sense, strict correlation of specificity and binding strength are uncoupled by structural disorder.

Keywords: IDPs; binding strength; conservation; disordered protein complexes; specificity; structural disorder.


Conflict of interest statement

The authors declare no conflicts of interest.

Figures

FIGURE 1
FIGURE 1
Distribution of free energy of binding in ID (red) and globular (blue) complexes. ID, intrinsically disordered
FIGURE 2
FIGURE 2
Examples of disordered complexes with a broad range of K d values and interface sizes: (a) cadherin ‐ β‐catenin, (b) inhibitor‐2 ‐ PP1, (c) hif1‐α ‐ CBP, (d) p53 ‐ p53‐binding protein 1, (e) ERBB receptor feedback inhibitor 1 ‐ EGFR, and (f) MAVS ‐ IRF3. ID parts are named first. PDB codes and K d values and interface (IF) sizes are indicated under the corresponding structures. Red: ID chain; blue: globular chain. ID, intrinsically disordered
FIGURE 3
FIGURE 3
Interface sizes of ID and globular complexes. (a) Interface size distribution of disordered (red) and globular (blue) complexes. (b) Relationship between the size and the number of constituent amino acids of half interfaces (ID complex IDP part: red square; ID complex globular part: rose circle; globular complex: blue triangle). ID, intrinsically disordered
FIGURE 4
FIGURE 4
Relationship between free energy of binding and the total interface size in disordered (red square) and globular (blue triangle) complexes. Dashed line in case of disordered complexes means that it is not a correct trendline but we could not fit better
FIGURE 5
FIGURE 5
Interaction types of ID and globular complexes. (a) Percental distribution of interaction types (HYD: hydrophobic; HBridge: hydrogen bond; ION: ionic; OTHER: disulfide bridges, aromatic‐aromatic, aromatic‐sulfur, and cation‐pi interactions) in strong and weak complexes (red: all ID complexes; dark red: strong; rose: weak ID complexes; blue: all globular complexes; dark blue: strong; light blue: weak globular complexes). (b) Number of interacting amino acids in ID and globular complexes. In the ID complexes, disordered and ordered partners are counted separately: ID idp part and ID glob part (red: all ID complexes; dark red: strong; rose: weak ID complexes; blue: all globular complexes; dark blue: strong; light blue: weak globular complexes). Error bars represent mean ± SD. ID, intrinsically disordered; SD, standard deviation
FIGURE 6
FIGURE 6
Interface conservation. (a) Mean conservation of protein surfaces and interfaces in ID (interface: red; surface: rose) and globular (interface: dark blue; surface: light blue) complexes. Significances are indicated with asterisks above the columns. (b) Relationship between conservation values of interfaces in disordered and globular chains in ID complexes. The diagonal y = x is shown as guiding line in red. (c) Conservation and binding strength. ID complex idp part: red square; ID complex globular part: rose circle; globular complex: blue triangle. Vertical line (ΔG = 8.2 kcal/mol) separates the weak (on the left) and strong (on the right) complexes. (d) Interface conservation of strong and weak ID and globular complexes. In ID complexes, disordered and ordered partners are counted separately: ID idp part and ID glob part (red: strong; rose: weak ID complexes; dark blue: strong; light blue: weak globular complexes.) Error bars represent mean ± SD. ID, intrinsically disordered; SD, standard deviation
FIGURE 7
FIGURE 7
iPat scores in ID and globular complexes. (a) Mean iPat scores of protein surfaces and interfaces in disordered (interface: red; surface: rose) and globular (interface: dark blue; surface: light blue) complexes. (b) Correlation between binding strength and interface mean iPat scores (ID complex idp part: red square; ID complex globular part: rose circle; globular complex: blue triangle). The vertical line (ΔG = 8.2 kcal/mol) separates the weak (on the left) and strong (on the right) complexes. (c) Mean interface iPat values of ID and globular complexes. In the ID complexes, disordered and ordered partners are counted separately: ID idp part and ID glob part (red: strong; rose: weak ID complexes; dark blue: strong; light blue: weak globular complexes.) Error bars represent mean ± SD. ID, intrinsically disordered; iPat, interface patterning; SD, standard deviation
FIGURE 8
FIGURE 8
Correlations of the binding free energy and interface size with the functional similarity. (a) Correlations between the binding free energy (ΔG) and GOSemSim for ID complexes (red square, r < 0.01) and for globular complexes (blue triangle, r = 0.29). (b) Correlations between the binding free energy (ΔG) and GOSemSim for ID complexes (red square, r = 0.03) and for globular complexes shown (blue triangle, r = 0.47). ID, intrinsically disordered; GO, gene ontology; SemSim, semantic similarity

Comment in

Similar articles

Cited by

References

    1. Tompa P. Intrinsically unstructured proteins. Trends Biochem Sci. 2002;27(10):527–533. - PubMed
    1. Tompa P. Unstructural biology coming of age. Curr Opin Struct Biol. 2011;21(3):419–425. - PubMed
    1. van der Lee R, Buljan M, Lang B, et al. Classification of intrinsically disordered regions and proteins. Chem Rev. 2014;114(13):6589–6631. - PMC - PubMed
    1. Wright PE, Dyson HJ. Linking folding and binding. Curr Opin Struct Biol. 2009;19(1):31–38. - PMC - PubMed
    1. Chakrabarti P, Chakravarty D. Intrinsically disordered proteins/regions and insight into their biomolecular interactions. Biophys Chem. 2022;283:106769. - PubMed

Publication types

MeSH terms

Substances

LinkOut - more resources