. 2022 Nov 7;221(11):e202011050.
doi: 10.1083/jcb.202011050. Epub 2022 Oct 28.

Viral protein engagement of GBF1 induces host cell vulnerability through synthetic lethality

Affiliations

Viral protein engagement of GBF1 induces host cell vulnerability through synthetic lethality

Arti T Navare et al. J Cell Biol. .

Abstract

Viruses co-opt host proteins to carry out their lifecycle. Repurposed host proteins may thus become functionally compromised; a situation analogous to a loss-of-function mutation. We term such host proteins as viral-induced hypomorphs. Cells bearing cancer driver loss-of-function mutations have successfully been targeted with drugs perturbing proteins encoded by the synthetic lethal (SL) partners of cancer-specific mutations. Similarly, SL interactions of viral-induced hypomorphs can potentially be targeted as host-based antiviral therapeutics. Here, we use GBF1, which supports the infection of many RNA viruses, as a proof-of-concept. GBF1 becomes a hypomorph upon interaction with the poliovirus protein 3A. Screening for SL partners of GBF1 revealed ARF1 as the top hit, disruption of which selectively killed cells that synthesize 3A alone or in the context of a poliovirus replicon. Thus, viral protein interactions can induce hypomorphs that render host cells selectively vulnerable to perturbations that leave uninfected cells otherwise unscathed. Exploiting viral-induced vulnerabilities could lead to broad-spectrum antivirals for many viruses, including SARS-CoV-2.


Figures

Figure 1.
Figure 1.
A chemogenomic screen identifies synthetic lethal partners of GBF1. (A) A schematic of the experimental design for chemogenomic screening with the GBF1 inhibitor golgicide A (GCA). A CRISPR extended knockout (EKO) library of NALM6-Cas9 cells was treated with 2 µg/ml doxycycline to induce individual gene knockouts via Cas9 expression. The pooled library was split into individual flasks and grown over an 8-d period in the presence or absence of 4 µM golgicide A (GCA). Following incubation, sgRNA frequencies were measured using Illumina sequencing, and log2 fold changes between GCA and control samples were compared. (B) A plot of relative sgRNA frequencies of all genes with genes passing a 0.05 FDR cutoff in white and black filled circles. The 53 genes with negative sgRNA fold change from GCA treatment represent putative SL interactors of GBF1. The 17 genes with overrepresented sgRNAs and positive sgRNA fold change represent putative GBF1 suppressors that may confer protection against GCA. Triangle represents no change in abundance and denotes MSMO1. (C) Gene ontology functional enrichment analysis of SL partners of GBF1. The 53 putative SL partners of GBF1 were analyzed in clusterProfiler against the entire KO gene collection from the CRISPR library to functionally classify the SL genes. Significantly enriched gene ontologies are plotted and ranked by their -log10, FDR-adjusted enrichment P value. The number of putative SL genes in each gene ontology is coded by the heatmap and ranges from 3 (yellow) to 9 (pink). (D) A combined PPI network of the 53 synthetic lethal interactors of GBF1 (green circles) and the 17 GBF1 suppressors (orange circles) was obtained from the STRING database and visualized using Cytoscape. Edges between two circles denote evidence-based interaction between the connecting proteins. Circles with red outlines highlight known targets of viral proteins, as per the VirHostNet (v2.0) virus-host PPIs database. Gene names of the proteins and their gene ontology functions are color matched.
Figure 2.
Figure 2.
Validation of putative synthetic lethal interactions in HeLa cells. (A) ARF1 displays a robust synthetic lethal interaction with GBF1. ARF1, HSP90, CSK, PRKAA1, the control gene MSMO1, and the top GBF1 suppressor gene ARF4 were silenced in HeLa cells with shRNA-mediated lentivirus transductions and incubated with golgicide A (GCA) at a concentration of 1.5 µM (left panel) or 4 µM (right panel) or DMSO alone for 48 h. CellTiter Blue reagent was added and fluorescence measurements were collected. The percent viability at each GCA concentration was calculated by dividing the fluorescence from a GCA-treated sample by its matched DMSO alone-treated control to compensate for DMSO solvent effects. Changes in cell viabilities for each knockdown (KD) cell line were then determined by comparing the respective percent viabilities to the MSMO1 KD control using a Brown Forsythe and Welch ANOVA multiple comparison test (Brown and Forsythe, 1974; Welch, 1951), with statistically significant differences indicated as: * if P value < 0.01; ** if P value < 0.001; *** if P value < 0.0001. Error bars represent the SEM from three biological replicates. (B) ARF1 KD cells show enhanced sensitivity in a GCA dose-response curve. A 200 µM GCA working solution in DMSO was serially diluted and co-plated with 20,000 cells per well of ARF1 KD and MSMO1 KD cells in a 96-well plate, with final GCA concentrations ranging from 0–100 µM. After 48 h, cell viability was measured with CellTiter Blue and the normalized fluorescence, relative to DMSO-treated samples, was calculated using the smallest and largest mean values to define 0 and 100%, respectively. A dose response curve of the normalized fluorescence was plotted against GCA concentration and IC50 values were calculated. The dose response curve and its 90% confidence interval were plotted from the results of four biological replicates per treatment.
Figure 3.
Figure 3.
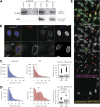
Poliovirus nonstructural protein 3A induces a vi-hypomorph of GBF1. (A) Poliovirus 3A physically interacts with GBF1. HeLa cells were transfected with FLAG* tagged poliovirus 3A or an empty control plasmid for 24 h. Equal amounts of lysates were prepared, and immunoaffinity enriched proteins bound to 3A-FLAG* protein. Affinity captured proteins were eluted and resolved on SDS-PAGE along with 1% of the total input lysate and the final wash. Resolved proteins were transferred to a PVDF membrane and immunoblotted using anti-GBF1 (top panel) and anti-FLAG (bottom panel) antibodies. This experiment was performed in triplicate. (B) Poliovirus 3A disperses GBF1 away from its perinuclear localization. HeLa cells transfected with FLAG* tagged poliovirus 3A, or an empty control plasmid were fixed, stained with fluorescently labeled antibodies against FLAG and GBF1, and imaged by wide-field fluorescence microscopy. (C and D) Images of GBF1 were analyzed and the distances of each GBF1 punctum to the nearest nucleus was determined and plotted across all distances (C) and those between 20 and 40 µM (D) for 42 control cells and 13 cells transfected with 3A-FLAG*. The corresponding box plots show statistically significant differences in GBF1 distribution between the two samples with *** representing a P value < 0.0001. (E) Poliovirus 3A induces fragmentation of the Golgi. HeLa cells were transfected with FLAG* tagged poliovirus 3A, and after 24 h fixed, stained with fluorescently labeled antibodies against FLAG (Red), GBF1 (green) and a Golgi marker protein 58 k (magenta). The nucleus was visualized by DAPI (cyan). Poliovirus 3A-FLAG* expressing cells are highlighted with arrows. Bar, 10 µm. Source data are available for this figure: SourceData F3.
Figure 4.
Figure 4.
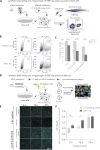
The 3A induced hypomorph of GBF1 sensitizes cells to ARF1-GBF1 synthetic lethality. (A–C) Synthetic lethal killing of a vi-hypomorph of GBF1 by poliovirus protein 3A. (A) ARF1 and MSMO1 were stably silenced in HeLa cells and transfected with FLAG*-tagged poliovirus 3A. Cell viabilities of ARF1 KD and MSMO1 KD cells transfected with 3A-FLAG* or an empty plasmid control were measured with CellTiterBlue. (B) The population (Side scatter [y-axis]) positively stained with R-phycoerythrin (PE)-conjugated α-FLAG (x-axis) was quantified to determine the number of cells positive for 3A-FLAG* in ARF1 KD and MSMO1 KD cells by flow cytometry, post 24 h. (C) Poliovirus 3A induces cell death in ARF1 KD cells. The viabilities of ARF1 KD and MSMO1 KD cells treated with 3A-alone or GCA-alone (1.5 μM) and a combination of 3A and GCA were measured using CellTiter Blue and plotted as a percentage of total cells. The percentage of viable cells was calculated by dividing the absolute fluorescence values of treated samples by the matched controls (un-transfected, DMSO-alone treated KD cells). A multiple unpaired t test was used to compare percent viability between the 3A-treated ARF1 KD and MSMO1 KD cells with **** representing P value < 0.000001. Error bars represent the SEM from six biological replicates. (D–F) Synthetic lethal killing of a vi-hypomorph of GBF1 by poliovirus replicon. (D) HeLa cells were transiently transfected with siRNAs targeting ARF1 or a nontargeting control. The KD or control cells were transfected with 25 ng of poliovirus replicon mRNA, and cells were incubated for 24 h. Cells were harvested and fixed at 8, 16, and 24 h post-transfection, immunostained, and imaged by fluorescence microscopy. (E) Representative immunofluorescence images of nontargeting and ARF1 KD cells transfected with poliovirus replicon or mock at 8, 16 and 24 h post-transfection. DAPI (cyan) was used to stain cell nuclei and the viral 3A-FLAG* protein was immunostained with a primary antibody against the FLAG tag (orange). (F) Quantification of cell depletion. DAPI signal was used to count the total number of imaged cells. Cell counts of the replicon-transfected samples were subtracted from and divided by the average cell counts of time-matched mocks to quantify cell death (cell loss as a fraction of mean mock cell counts) post-transfection over the course shown. A multiple t test was used to compare cell death between poliovirus replicon-transfected ARF1 KD and nontargeting controls at each time point. Statistically significant differences were observed at 8 h (P value <0.05 indicated as *) and at 16 h (P value <0.01, indicated as **). Error bars represent the SEM from nine biological replicates.
Figure 5.
Figure 5.
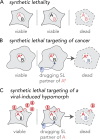
Extending the principle of synthetic lethal interactions to a virus-induced hypomorph. (A) Synthetic lethality is an extreme negative genetic interaction occurring between two genes. Here, genes “A” and “B” are not essential, and the cell remains viable upon the loss of either gene, depicted by red dotted outline of “A” or “B”, individually. However, when these deletions are combined in a single cell, as visualized in the third panel, this double loss of function critically impairs the cell, resulting in its death. Such gene-gene combinations are termed synthetic lethal (SL) partners. (B) The principle of synthetic lethality has been successfully exploited in the development of certain cancer therapies by targeting the synthetic lethal partner of the cancer-causing oncogene, depicted by a red “A.” In the cancerous cell, gene “A” has been mutated, depicted as “A*,” leading to an enhanced dependency by the cancer cell for its synthetic lethal partner “B.” Drugs that target the otherwise nonessential gene B induce cell death when combined with its SL partner, A*. Therefore, inhibiting the function of B can selectively kill cancerous cells while sparing noncancerous bystander cells. (C) Like the example in cancer, a viral infection provides opportunities for specifically targeting infected cells by synthetic lethality. When a cell is infected, host factors, depicted as the red letter “A,” are recruited by viral proteins to support viral reproduction. The normal function of the host factor is thus attenuated by the presence of the virus, inducing a hypomorph, red letter “A,” which sensitizes the infected cell to inhibition of its SL partner by an inhibitory drug.
Figure S1.
Figure S1.
GCA dose-response assay in Nalm6 and HeLa cells. Nalm-6 and HeLa cells were incubated with serially diluted GCA or DMSO (4×) and cellTiterBlue reagent was added after 24 and 48 h for Nalm-6 and 48 h for HeLa cells. Metabolically active cells convert the reagent into a fluorescent product, and the fluorescence intensity recorded by a plate reader is directly proportional to the number of live cells. The fluorescence of the GCA-treated samples was normalized to the equivalent DMSO-treated controls and IC30 values were determined using synergy software. IC30 values of Nalm-6 cell line over time were averaged (IC30 average = ∼4.0 µM), to determine the concentration of GCA to be used in the chemogenomic drug screening assay. The IC30 value of HeLa cells at 48 h was comparable to that of the Nalm-6 cells.
Figure S2.
Figure S2.
Validation of shRNA and siRNA-mediated knockdown of genes. (A) Four druggable putative synthetic lethal partners of GBF1: ARF1, PRKAA1, CSK, and HSP90; a putative GBF1 suppressor, ARF4; and a gene showing no GCA-induced chemogenomic interactions with GBF1, MSMO1, were silenced in HeLa cells via shRNA-mediated lentivirus transductions and selected on puromycin for 72 h. Cell pellets from each knockdown cell-line were collected, lysed, and the total protein concentrations were measured using a bicinchoninic acid assay. Equal amounts of total protein from the control and knockdown cells were resolved by SDS-PAGE, transferred to PVDF and probed with the indicated antibodies. (B) For experiments with siRNA, HeLa cells were transiently transfected with siRNAs targeting ARF1 and a nontargeting control. After 48 h post-transfection, the control and KD cells were harvested and replated for IF imaging experiment (Fig. 4, D–F, main text). Cell pellets were collected and used for WB analysis as described above. β-actin was used as a loading control. Protein depletion relative to the respective loading control was calculated using ImageJ software and the resulting percent knockdown efficiencies (% KD) are reported. Source data are available for this figure: SourceData FS2.

Update of

Similar articles

Cited by

References

    1. Beijersbergen, R.L., Wessels L.F.A., and Bernards R.. 2017. Synthetic lethality in cancer therapeutics. Annu. Rev. Cancer Biol. 1:141–161. 10.1146/annurev-cancerbio-042016-073434 - DOI
    1. Beller, M., Sztalryd C., Southall N., Bell M., Jäckle H., Auld D.S., and Oliver B.. 2008. COPI complex is a regulator of lipid homeostasis. PLoS Biol. 6:e292. 10.1371/journal.pbio.0060292 - DOI - PMC - PubMed
    1. Belov, G.A., Fogg M.H., and Ehrenfeld E.. 2005. Poliovirus proteins induce membrane association of GTPase ADP-ribosylation factor. J. Virol. 79:7207–7216. 10.1128/JVI.79.11.7207-7216.2005 - DOI - PMC - PubMed
    1. Belov, G.A., Altan-Bonnet N., Kovtunovych G., Jackson C.L., Lippincott-Schwartz J., and Ehrenfeld E.. 2007. Hijacking components of the cellular secretory pathway for replication of poliovirus RNA. J. Virol. 81:558–567. 10.1128/JVI.01820-06 - DOI - PMC - PubMed
    1. Belov, G.A., Feng Q., Nikovics K., Jackson C.L., and Ehrenfeld E.. 2008. A critical role of a cellular membrane traffic protein in poliovirus RNA replication. PLoS Pathog. 4:e1000216. 10.1371/journal.ppat.1000216 - DOI - PMC - PubMed

Publication types

MeSH terms