

Association of Race and Area Deprivation With Breast Cancer Survival Among Black and White Women in the State of Georgia
- PMID: 36306134
- PMCID: PMC9617173
- DOI: 10.1001/jamanetworkopen.2022.38183
Association of Race and Area Deprivation With Breast Cancer Survival Among Black and White Women in the State of Georgia
Abstract
Importance: Increasing evidence suggests that low socioeconomic status and geographic residence in disadvantaged neighborhoods contribute to disparities in breast cancer outcomes. However, little epidemiological research has sought to better understand these disparities within the context of location.
Objective: To examine the association between neighborhood deprivation and racial disparities in mortality among Black and White patients with breast cancer in the state of Georgia.
Design, setting, and participants: This population-based cohort study collected demographic and geographic data from patients diagnosed with breast cancer between January 1, 2004, and February 11, 2020, in 3 large health care systems in Georgia. A total of 19 580 patients with breast cancer were included: 12 976 from Piedmont Healthcare, 2285 from Grady Health System, and 4319 from Emory Healthcare. Data were analyzed from October 2, 2020, to August 11, 2022.
Exposures: Area deprivation index (ADI) scores were assigned to each patient based on their residential census block group. The ADI was categorized into quartile groups, and associations between ADI and race and ADI × race interaction were examined.
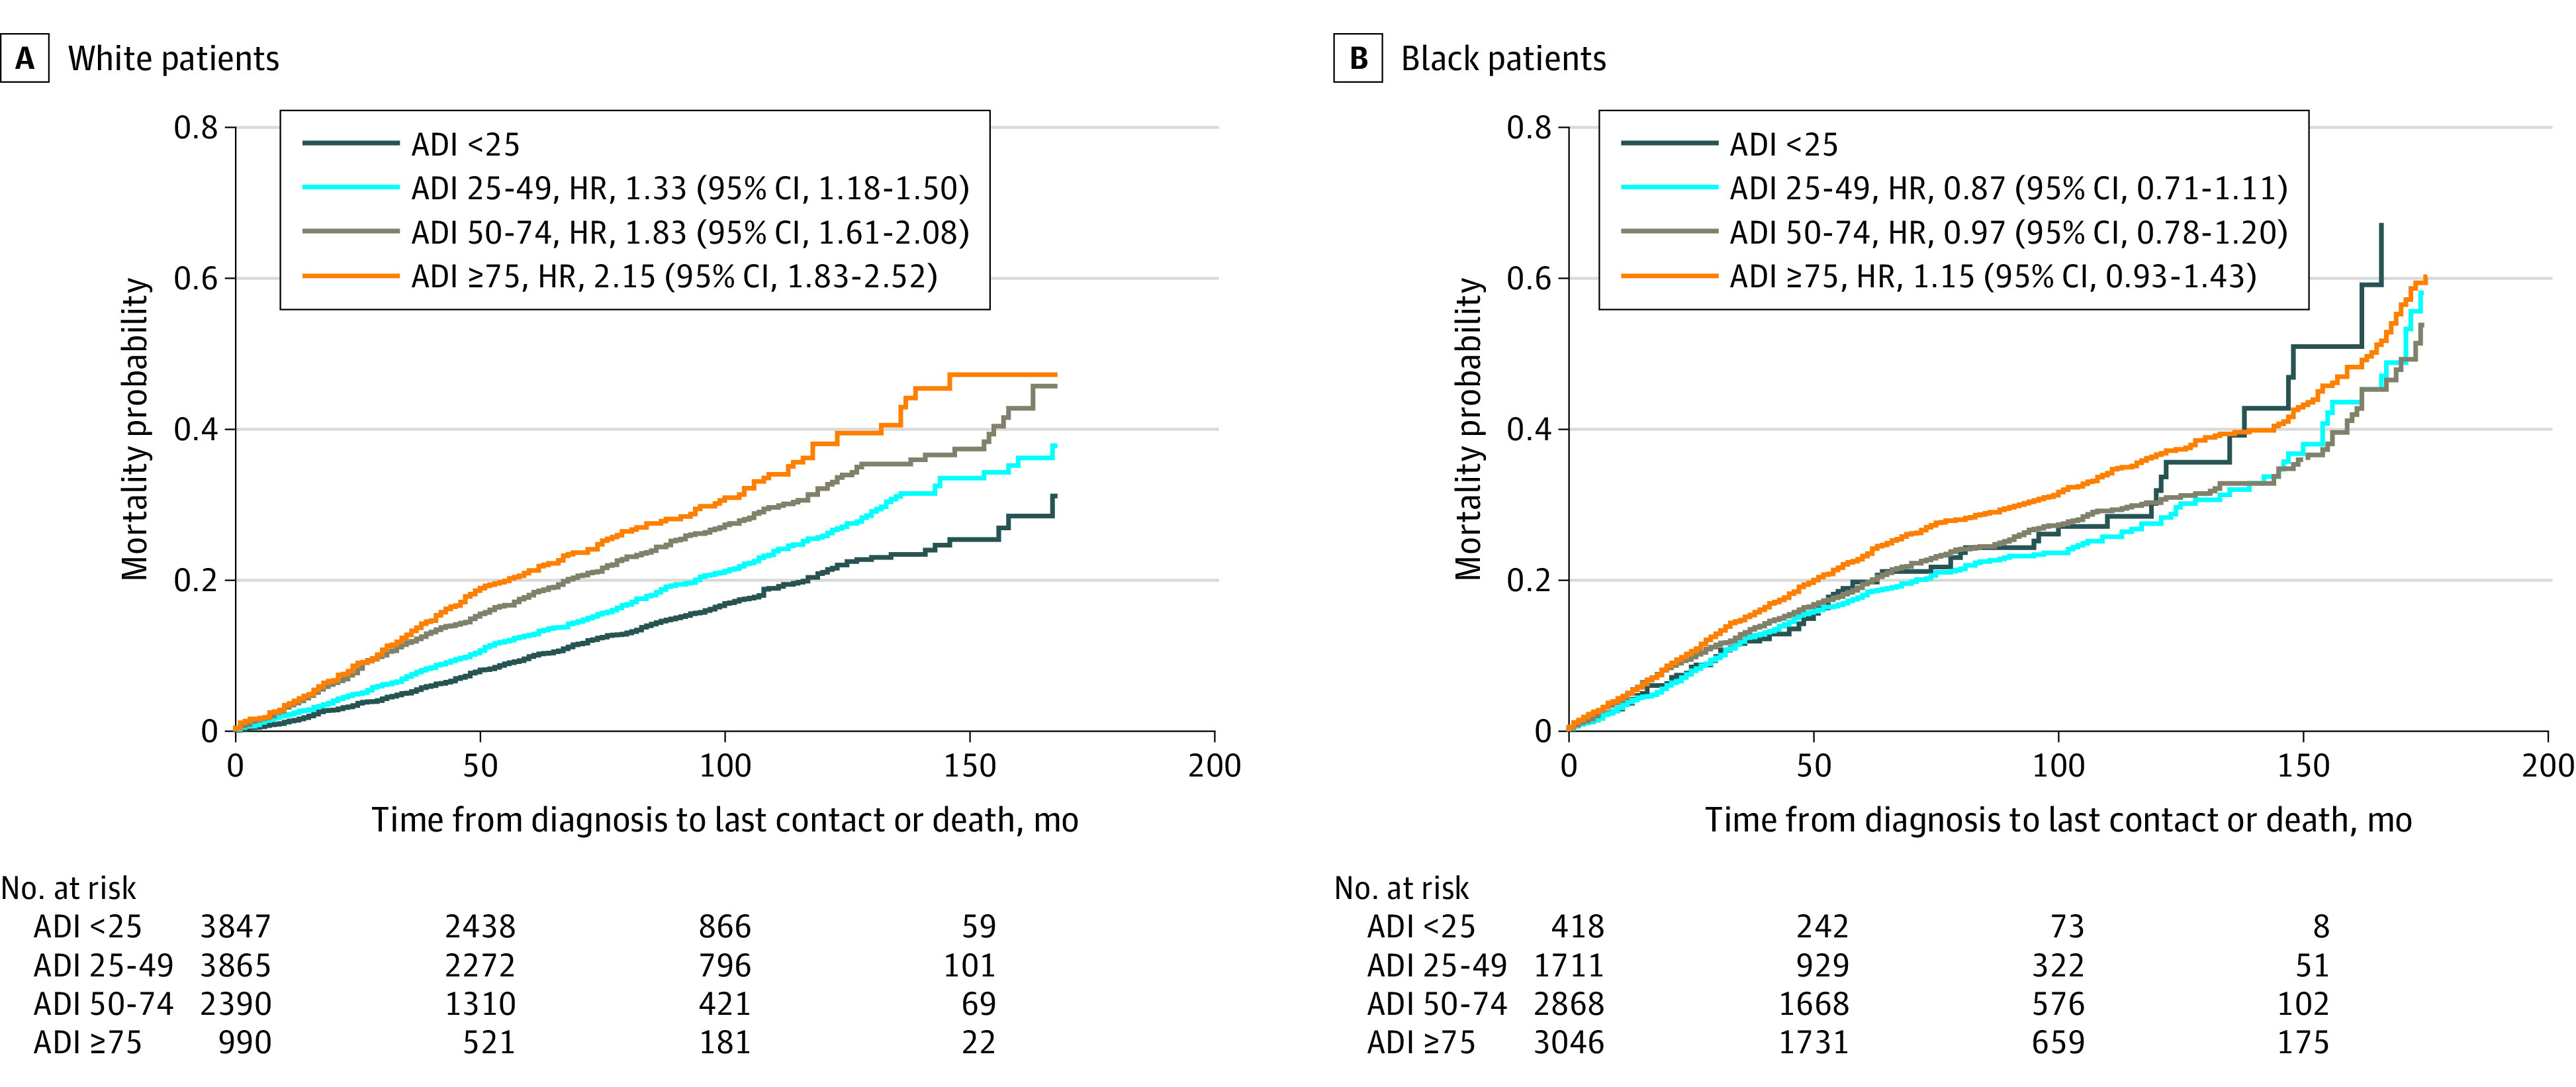
Main outcomes and measures: Cox proportional hazards regression models were used to compute hazard ratios (HRs) and 95% CIs associating ADI with overall mortality by race. Kaplan-Meier curves were used to visualize mortality stratified across racial and ADI groups.
Results: Of the 19 580 patients included in the analysis (mean [SD] age at diagnosis, 58.8 [13.2] years), 3777 (19.3%) died during the course of the study. Area deprivation index contributed differently to breast cancer outcomes for Black and White women. In multivariable-adjusted models, living in a neighborhood with a greater ADI (more deprivation) was associated with increased mortality for White patients with breast cancer; compared with the ADI quartile of less than 25 (least deprived), increased mortality HRs were found in quartiles of 25 to 49 (1.22 [95% CI, 1.07-1.39]), 50 to 74 (1.32 [95% CI, 1.13-1.53]), and 75 or greater (1.33 [95% CI, 1.07-1.65]). However, an increase in the ADI quartile group was not associated with changes in mortality for Black patients with breast cancer (quartile 25 to 49: HR, 0.81 [95% CI, 0.61-1.07]; quartile 50 to 74: HR, 0.91 [95% CI, 0.70-1.18]; and quartile ≥75: HR, 1.05 [95% CI, 0.70-1.36]). In neighborhoods with an ADI of 75 or greater, no racial disparity was observed in mortality (HR, 1.11 [95% CI, 0.92-1.36]).
Conclusions and relevance: Black women with breast cancer had higher mortality than White women in Georgia, but this disparity was not explained by ADI: among Black patients, low ADI was not associated with lower mortality. This lack of association warrants further investigation to inform community-level approaches that may mitigate the existing disparities in breast cancer outcomes in Georgia.
Conflict of interest statement
Figures


Similar articles
-
Neighborhood Deprivation and Breast Cancer Mortality Among Black and White Women.JAMA Netw Open. 2024 Jun 3;7(6):e2416499. doi: 10.1001/jamanetworkopen.2024.16499. JAMA Netw Open. 2024. PMID: 38865125 Free PMC article.
-
Racial Disparities in Outcomes After THA and TKA Are Substantially Mediated by Socioeconomic Disadvantage Both in Black and White Patients.Clin Orthop Relat Res. 2023 Feb 1;481(2):254-264. doi: 10.1097/CORR.0000000000002392. Epub 2022 Sep 14. Clin Orthop Relat Res. 2023. PMID: 36103368 Free PMC article.
-
Neighborhood and Individual Socioeconomic Disadvantage and Survival Among Patients With Nonmetastatic Common Cancers.JAMA Netw Open. 2021 Dec 1;4(12):e2139593. doi: 10.1001/jamanetworkopen.2021.39593. JAMA Netw Open. 2021. PMID: 34919133 Free PMC article.
-
The application of neighborhood area deprivation index to improve health equity across the spectrum of heart failure: a review.Heart Fail Rev. 2025 May;30(3):589-604. doi: 10.1007/s10741-025-10492-4. Epub 2025 Mar 29. Heart Fail Rev. 2025. PMID: 40158031 Review.
-
Adherence to Endocrine Therapy and Racial Outcome Disparities in Breast Cancer.Oncologist. 2021 Nov;26(11):910-915. doi: 10.1002/onco.13964. Epub 2021 Sep 28. Oncologist. 2021. PMID: 34582070 Free PMC article. Review.
Cited by
-
The impact of socioeconomic factors on pancreatic cancer care utilization.PLoS One. 2025 May 7;20(5):e0320518. doi: 10.1371/journal.pone.0320518. eCollection 2025. PLoS One. 2025. PMID: 40333789 Free PMC article.
-
Structural determinants of racial disparities in breast cancer survival in Alabama.Cancer Epidemiol Biomarkers Prev. 2025 Jul 9:10.1158/1055-9965.EPI-25-0195. doi: 10.1158/1055-9965.EPI-25-0195. Online ahead of print. Cancer Epidemiol Biomarkers Prev. 2025. PMID: 40632137 Free PMC article.
-
The association between neighborhood socioeconomic status and breast cancer incidence and mortality risk: a large-scale cohort studies systematic review and meta-analysis.Breast Cancer. 2025 Aug 30. doi: 10.1007/s12282-025-01764-w. Online ahead of print. Breast Cancer. 2025. PMID: 40885809 Review.
-
The Association of Neighborhood-Level Deprivation with Glioblastoma Outcomes: A Single Center Cohort Study.Res Sq [Preprint]. 2025 Jan 30:rs.3.rs-5913656. doi: 10.21203/rs.3.rs-5913656/v1. Res Sq. 2025. Update in: J Neurooncol. 2025 Jun;173(2):457-467. doi: 10.1007/s11060-025-05002-3. PMID: 39975914 Free PMC article. Updated. Preprint.
-
Real-World Type 2 Diabetes Second-Line Treatment Allocation Among Patients.medRxiv [Preprint]. 2025 Mar 28:2025.03.26.25324631. doi: 10.1101/2025.03.26.25324631. medRxiv. 2025. PMID: 40196266 Free PMC article. Preprint.
References
-
- Georgia Department of Public Health . Cancer reports. Updated November 18, 2021. Accessed March 15, 2021. https://dph.georgia.gov/cancer-reports
-
- National Cancer Institute. SEER Cancer Statistics Review (CSR) 1975-2014. Updated April 2, 2018. Accessed March 16, 2021. https://seer.cancer.gov/archive/csr/1975_2014/
-
- Centers for Disease Control and Prevention. United States cancer statistics: public information data. Updated October 7, 2021. Accessed March 16, 2021. https://wonder.cdc.gov/cancer.html
MeSH terms
Grants and funding
LinkOut - more resources
Full Text Sources
Medical
