. 2023 Feb 1;21(2):102-114.
doi: 10.1158/1541-7786.MCR-22-0509.

Downregulation of iNOS/NO Promotes Epithelial-Mesenchymal Transition and Metastasis in Colorectal Cancer

Affiliations

Downregulation of iNOS/NO Promotes Epithelial-Mesenchymal Transition and Metastasis in Colorectal Cancer

Qiang Du et al. Mol Cancer Res. .

Abstract

Metastasis is the major cause of cancer-related death in patients with colorectal cancer. Although inducible nitric oxide synthase (iNOS) is a crucial regulator of cancer development and progression, its roles in epithelial-mesenchymal transition (EMT) and the pathogenesis of metastatic colorectal cancer have not been fully investigated. Primary colorectal cancer and liver metastatic tissue specimens were analyzed showing 90% of liver metastatic colorectal cancer with reduced expressions of iNOS compared with 6% of primary colorectal cancer. The Cancer Genome Atlas database analyses via cBioPortal reveal that mRNA expression of iNOS negatively correlated with selected EMT markers in colorectal cancer in a cancer type-dependent manner. The transcriptomic profiling (RNA sequencing data) indicates that iNOS knockdown in SW480 colorectal cancer cells induced an EMT program with upregulated expression of selected stem-cell markers. iNOS knockdown did not alter E-cadherin mRNA expression but re-localized it from membrane to cytoplasm through iNOS-GATA4-Crb2-E-cadherin pathway. iNOS knockdown induced a change in cell morphology, and promoted cell invasion and migration in vitro, and metastasis in vivo.

Implications: iNOS downregulation-induced pathway networks mediate the EMT program and metastasis. As an EMT inducer, the reduced-iNOS may serve as a potential therapeutic target for patients with colorectal cancer.


Figures

Figure 1. iNOS expression was downregulated in patients with metastatic colorectal cancer and cell line and correlated with the selected EMT markers in colorectal cancer. A, representative images of immunofluorescence staining are shown to compare iNOS expression between the SW480 and SW620 cells. Green and red signal represents the staining of iNOS and F-actin, respectively (scale bars, 20 μm). B, total RNAs and protein collected from cultured SW480 and SW620 cells were analyzed for the expression of iNOS by qRT-PCR: ****, P < 0.0001 (top), and Western blot (bottom), respectively. C, tumor tissues were collected from patients with primary and metastatic colorectal cancer. H&E staining is shown (top; scale bars, 50 mm). Representative images of Immunofluorescence staining are shown to compare iNOS expressions between the primary and the metastatic colorectal cancer. Green signal represents the staining of iNOS (bottom; scale bars, 50 μm). D, immunofluorescence staining analyses of the tissue specimens from 50 patients with primary and equal metastatic colon cancer were performed to compare the iNOS expression. Immunofluorescence staining scores for the iNOS expression were generated and χ2 test was used, P = 0.0034. E, total RNAs collected from normal, primary, and metastatic colorectal cancer tissues were subjected to RT-PCR for iNOS expression normalized to β-actin. F, the representative images of the cBioPortal TCGA database analysis showed the correlations of the mRNA expressions between iNOS and selected EMT markers in the indicated cancer types.
Figure 1.
iNOS expression was downregulated in patients with metastatic colorectal cancer and cell line and correlated with the selected EMT markers in colorectal cancer. A, representative images of immunofluorescence staining are shown to compare iNOS expression between the SW480 and SW620 cells. Green and red signal represents the staining of iNOS and F-actin, respectively (scale bars, 20 μm). B, total RNAs and protein collected from cultured SW480 and SW620 cells were analyzed for the expression of iNOS by qRT-PCR: ****, P < 0.0001 (top), and Western blot (bottom), respectively. C, tumor tissues were collected from patients with primary and metastatic colorectal cancer. H&E staining is shown (top; scale bars, 50 mm). Representative images of Immunofluorescence staining are shown to compare iNOS expressions between the primary and the metastatic colorectal cancer. Green signal represents the staining of iNOS (bottom; scale bars, 50 μm). D, immunofluorescence staining analyses of the tissue specimens from 50 patients with primary and equal metastatic colon cancer were performed to compare the iNOS expression. Immunofluorescence staining scores for the iNOS expression were generated and χ2 test was used, P = 0.0034. E, total RNAs collected from normal, primary, and metastatic colorectal cancer tissues were subjected to RT-PCR for iNOS expression normalized to β-actin. F, the representative images of the cBioPortal TCGA database analysis showed the correlations of the mRNA expressions between iNOS and selected EMT markers in the indicated cancer types.
Figure 2. iNOS knockdown mediated EMT in SW480 cells. (A, top and bottom), SW480-shiNOS and SW480-shControl cells were cultured for 36 hours. iNOS expressions at mRNA and protein level between SW480-shiNOS and SW480-shControl cells were evaluated by Western blot (A, top) and qRT-PCR (A, bottom): ****, P < 0.0001. B, the RNA-seq data were analyzed and the gene expressions of the selected EMT markers demonstrated in volcano plot. C, the RNA-seq data were analyzed by using IPA, heatmap shows that EMT-pathway genes were mediated by iNOS knockdown (n =  2). D, SW480-shiNOS and SW480-shControl cells were cultured for 48 hours, the representative images were taken (Scale bars, 50 μm).
Figure 2.
iNOS knockdown mediated EMT in SW480 cells. A, SW480-shiNOS and SW480-shControl cells were cultured for 36 hours. iNOS expressions at mRNA and protein level between SW480-shiNOS and SW480-shControl cells were evaluated by Western blot (A, top) and qRT-PCR (A, bottom): ****, P < 0.0001. B, the RNA-seq data were analyzed and the gene expressions of the selected EMT markers demonstrated in volcano plot. C, the RNA-seq data were analyzed by using IPA, heatmap shows that EMT-pathway genes were mediated by iNOS knockdown (n =  2). D, SW480-shiNOS and SW480-shControl cells were cultured for 48 hours, the representative images were taken (Scale bars, 50 μm).
Figure 3. iNOS knockdown regulated the expressions of EMT-TFs and enhanced stem-cell properties. A and B, SW480-shiNOS and SW480-shControl cells were subjected to culture for 36 hours, and nuclear proteins were harvested for Western blot with the indicated antibodies, Lamin A/C as loading control (top); and the total RNAs were extracted, and SNAI2 expression was analyzed by qRT-PCR: *, P < 0.05; **, P < 0.01 (bottom); the cells for Immunofluorescence staining (B), the corresponding color represents the staining of TWIST1 and SNAIL2 as indicated. (Scale bars, 20 μm). C, DLD1, HT-29, HCT116 and RKO cells were subjected to seed for 24 hours, and treated with SNAP, a NO donor (100 μmol/L), or L-NIL, an iNOS inhibitor (100 μmol/L) for 24 hours. Nuclear proteins were harvested for Western blot with the indicated antibodies (top). Total RNA was extracted for qRT-PCR: *, P < 0.05; **, P < 0.01; ***, P < 0.001; and ****, P < 0.0001 (bottom). D, HT-29 and HCT116 cells were subjected to seed for 24 hours, and treated with SNAP (0, 50, 100, 300, and 500 μmol/L) for 24 hours. Nuclear proteins were harvested for Western blot with the indicated antibodies. E, APC mutation rates among the selected cancer types based on the analyses of cBioPortal TCGA databases. F, the RNA-seq data were analyzed and the expressions of the selected stem-cell markers displayed in volcano plot. G, RNA-seq indicates that knockdown iNOS regulated the gene expressions of promoting hybrid EMT, cancer stemness, and LGR5 expression.
Figure 3.
iNOS knockdown regulated the expressions of EMT-TFs and enhanced stem-cell properties. A and B, SW480-shiNOS and SW480-shControl cells were subjected to culture for 36 hours, and nuclear proteins were harvested for Western blot with the indicated antibodies, Lamin A/C as loading control (top); and the total RNAs were extracted, and SNAI2 expression was analyzed by qRT-PCR: *, P < 0.05; **, P < 0.01 (bottom); the cells for Immunofluorescence staining (B), the corresponding color represents the staining of TWIST1 and SNAIL2 as indicated. (Scale bars, 20 μm). C, DLD1, HT-29, HCT116 and RKO cells were subjected to seed for 24 hours, and treated with SNAP, a NO donor (100 μmol/L), or L-NIL, an iNOS inhibitor (100 μmol/L) for 24 hours. Nuclear proteins were harvested for Western blot with the indicated antibodies (top). Total RNA was extracted for qRT-PCR: *, P < 0.05; **, P < 0.01; ***, P < 0.001; and ****, P < 0.0001 (bottom). D, HT-29 and HCT116 cells were subjected to seed for 24 hours, and treated with SNAP (0, 50, 100, 300, and 500 μmol/L) for 24 hours. Nuclear proteins were harvested for Western blot with the indicated antibodies. E,APC mutation rates among the selected cancer types based on the analyses of cBioPortal TCGA databases. F, the RNA-seq data were analyzed and the expressions of the selected stem-cell markers displayed in volcano plot. G, RNA-seq indicates that knockdown iNOS regulated the gene expressions of promoting hybrid EMT, cancer stemness, and LGR5 expression.
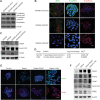
Figure 4. iNOS knockdown induced E-cadherin translocation from membrane to cytoplasm via iNOS-GATA4-Crb2-E-cadherin pathway. A, SW480-shiNOS and SW480-shControl cells were cultured for 36 hours, Western blots show the change of E-cadherin localization and N-cadherin expression. B, SW480 cells treated as A, Immunofluorescence staining was conducted with the indicated antibodies. The representative images show the corresponding color signal representing the staining of iNOS, E-cadherin, and N-cadherin as indicated in the SW480-shiNOS cells compared with their controls (Scale bars, 25 μm). C, SW480, SW620, SW480-shiNOS, and SW480-shControl cells were cultured for 36 hours, nuclear or total protein was extracted for Western blot analysis with the indicated antibodies. D, RNA-seq indicates that the listed gene expressions were regulated by iNOS knockdown. E, 293 cells was transfected with GATA4 gene (2 μg) for 6 h in 35-mm dish, then the cells treated with SNAP (100 μmol/L) or L-NIL (100 μmol/L) for 24 hours. Representative Immunofluorescence staining images show the green and red signal representing the staining of GATA4 and SNAIL2, respectively. (Scale bars, 25 μm). F, 293 cells were treated as (E), nuclear or total proteins were collected for Western blot.
Figure 4.
iNOS knockdown induced E-cadherin translocation from membrane to cytoplasm via iNOS-GATA4-Crb2-E-cadherin pathway. A, SW480-shiNOS and SW480-shControl cells were cultured for 36 hours, Western blots show the change of E-cadherin localization and N-cadherin expression. B, SW480 cells treated as in A, immunofluorescence staining was conducted with the indicated antibodies. The representative images show the corresponding color signal representing the staining of iNOS, E-cadherin, and N-cadherin as indicated in the SW480-shiNOS cells compared with their controls (Scale bars, 25 μm). C, SW480, SW620, SW480-shiNOS, and SW480-shControl cells were cultured for 36 hours, nuclear or total protein was extracted for Western blot analysis with the indicated antibodies. D, RNA-seq indicates that the listed gene expressions were regulated by iNOS knockdown. E, 293 cells was transfected with GATA4 gene (2 μg) for 6 h in 35-mm dish, then the cells treated with SNAP (100 μmol/L) or L-NIL (100 μmol/L) for 24 hours. Representative Immunofluorescence staining images show the green and red signal representing the staining of GATA4 and SNAIL2, respectively. (Scale bars, 25 μm). F, 293 cells were treated as in E, nuclear or total proteins were collected for Western blot.
Figure 5. iNOS Downregulation prevented SW480 cells from anoikis and promoted cell migration and invasion. A, SW480-shiNOS and SW480-shControl cells were subjected to suspended culture with shaking for 0, 4, 8, 24, 48, and 72 hours, and harvested for Western blot with the indicated antibodies. β-actin as loading controls. B, confluent monolayers of SW480-shiNOS versus SW480-shControl cells were wounded as shown for 0, 18, and 36 hours to compare the cell motility (scale bars, 25 μm). C, colon cancer cell migration and invasion were regulated by downregulated iNOS gene. The representative images of the migration and invasiveness of SW480-shiNOS versus SW480-shControl cells, which were cultured using Boyden chambers for 4 hours (Scale bars, 200 μm). D, and E, the numbers of cell migration and invasion: **, P < 0.01 and ***, P < 0.001 in a comparison of the SW480-shiNOS treated groups with SW480-shControl. This representative experiment was selected from three with the similar results.
Figure 5.
iNOS Downregulation prevented SW480 cells from anoikis and promoted cell migration and invasion. A, SW480-shiNOS and SW480-shControl cells were subjected to suspended culture with shaking for 0, 4, 8, 24, 48, and 72 hours, and harvested for Western blot with the indicated antibodies. β-actin as loading controls. B, confluent monolayers of SW480-shiNOS versus SW480-shControl cells were wounded as shown for 0, 18, and 36 hours to compare the cell motility (scale bars, 25 μm). C, colon cancer cell migration and invasion were regulated by downregulated iNOS gene. The representative images of the migration and invasiveness of SW480-shiNOS versus SW480-shControl cells, which were cultured using Boyden chambers for 4 hours (Scale bars, 200 μm). D and E, the numbers of cell migration and invasion: **, P < 0.01 and ***, P < 0.001 in a comparison of the SW480-shiNOS treated groups with SW480-shControl. This representative experiment was selected from three with the similar results.
Figure 6. iNOS Downregulation promoted EMT and metastasis in vivo. A, SW480 cells and CTCs were cultured on slides for 36 hours and followed Immunofluorescence staining. The green and red signal represents the staining of iNOS and EpCAM, respectively (Scale bars, 25 μm). B, the percentages of iNOS gene expression among the CTC samples, n = 15. C, cells treated as in A, the representative images are shown for immunofluorescence staining with the indicated antibodies. EpCAM and CD45 are the epithelial and immune cell marker, respectively. The corresponding color signal represents the staining as indicated (Scale bars, 25 μm). D, the RNA-seq data were analyzed by using IPA, heatmap shows the transcriptomic profiling of colorectal cancer metastatic signaling induced by iNOS knockdown. E, representative H&E images of section from SCID mouse lymph node and stomach bearing metastatic colon cancer of SW480-shiNOS (n = 10) and SW480-shControl cells (n = 10). (Scale bars, 50 μm). F, the statistics of the metastatic tumors between the two groups of experimental mice, P < 0.0055 by Fisher exact test. G, RNA-seq shows the selected metastasis suppressors were downregulated by iNOS knockdown.
Figure 6.
iNOS Downregulation promoted EMT and metastasis in vivo.A, SW480 cells and CTCs were cultured on slides for 36 hours and followed Immunofluorescence staining. The green and red signal represents the staining of iNOS and EpCAM, respectively (Scale bars, 25 μm). B, the percentages of iNOS gene expression among the CTC samples, n = 15. C, cells treated as in A, the representative images are shown for immunofluorescence staining with the indicated antibodies. EpCAM and CD45 are the epithelial and immune cell marker, respectively. The corresponding color signal represents the staining as indicated (Scale bars, 25 μm). D, the RNA-seq data were analyzed by using IPA, heatmap shows the transcriptomic profiling of colorectal cancer metastatic signaling induced by iNOS knockdown. E, representative H&E images of section from SCID mouse lymph node and stomach bearing metastatic colon cancer of SW480-shiNOS (n = 10) and SW480-shControl cells (n = 10). (Scale bars, 50 μm). F, the statistics of the metastatic tumors between the two groups of experimental mice, P < 0.0055 by Fisher exact test. G, RNA-seq shows the selected metastasis suppressors were downregulated by iNOS knockdown.
Figure 7. iNOS Downregulation promotes colorectal cancer EMT and metastasis. Schematic mechanisms of iNOS downregulation promotes colorectal cancer EMT and metastasis based on the current study findings and the pathway analysis of the RNA-seq data by IPA. In this chart, the arrow indicates activation, while flat-end line shows inhibition in signaling pathways. Prior studies showed that APC mutation induced Wnt/β-catenin pathway was key for inhibit NF-κB signaling and maintain iNOS/NO at a low level Low iNOS expression activates growth factor pathways (as IPA indicated, the results published by others are shown in the white background) and Smad4 to upregulate the expression of EMT-TFs and EMT inducers leading to activate EMT. EMT plays key roles for the induction of cancer cell stemness and anoikis resistance, all which contribute to cancer metastasis. Meanwhile, low iNOS/NO also inhibits metastatic suppressors, which removes the brake on metastases.
Figure 7.
iNOS Downregulation promotes colorectal cancer EMT and metastasis. Schematic mechanisms of iNOS downregulation promotes colorectal cancer EMT and metastasis based on the current study findings and the pathway analysis of the RNA-seq data by IPA. In this chart, the arrow indicates activation, while flat-end line shows inhibition in signaling pathways. Prior studies showed that APC mutation induced Wnt/β-catenin pathway was key for inhibit NF-κB signaling and maintain iNOS/NO at a low level Low iNOS expression activates growth factor pathways (as IPA indicated, the results published by others are shown in the white background) and Smad4 to upregulate the expression of EMT-TFs and EMT inducers leading to activate EMT. EMT plays key roles for the induction of cancer cell stemness and anoikis resistance, all which contribute to cancer metastasis. Meanwhile, low iNOS/NO also inhibits metastatic suppressors, which removes the brake on metastases.

Comment in

  • 1541-7786. doi: 10.1158/1541-7786.MCR-21-2-HI

Similar articles

Cited by

References

    1. Lambert AW, Weinberg RA. Linking EMT programs to normal and neoplastic epithelial stem cells. Nat Rev Cancer 2021;21:325–38. - PubMed
    1. Dongre A, Weinberg RA. New insights into the mechanisms of epithelial–mesenchymal transition and implications for cancer. Nat Rev Mol Cell Biol 2019;20:69–84. - PubMed
    1. Gurzu S, Silveanu C, Fetyko A, Butiurca V, Kovacs Z, Jung I. Systematic review of the old and new concepts in the epithelial–mesenchymal transition of colorectal cancer. World J Gastroenterol 2016;22:6764–75. - PMC - PubMed
    1. de Craene B, Berx G. Regulatory networks defining EMT during cancer initiation and progression. Nat Rev Cancer 2013;13:97–110. - PubMed
    1. Kang E, Seo J, Yoon H, Cho S. The posttranslational regulation of epithelial–mesenchymal transition-inducing transcription factors in cancer metastasis. Int J of Mol Sci 2021;22:3591. - PMC - PubMed

Publication types

MeSH terms