. 2022 Oct 27;185(22):4153-4169.e19.
doi: 10.1016/j.cell.2022.09.033.

TREM2 drives microglia response to amyloid-β via SYK-dependent and -independent pathways

Affiliations

TREM2 drives microglia response to amyloid-β via SYK-dependent and -independent pathways

Shoutang Wang et al. Cell. .

Abstract

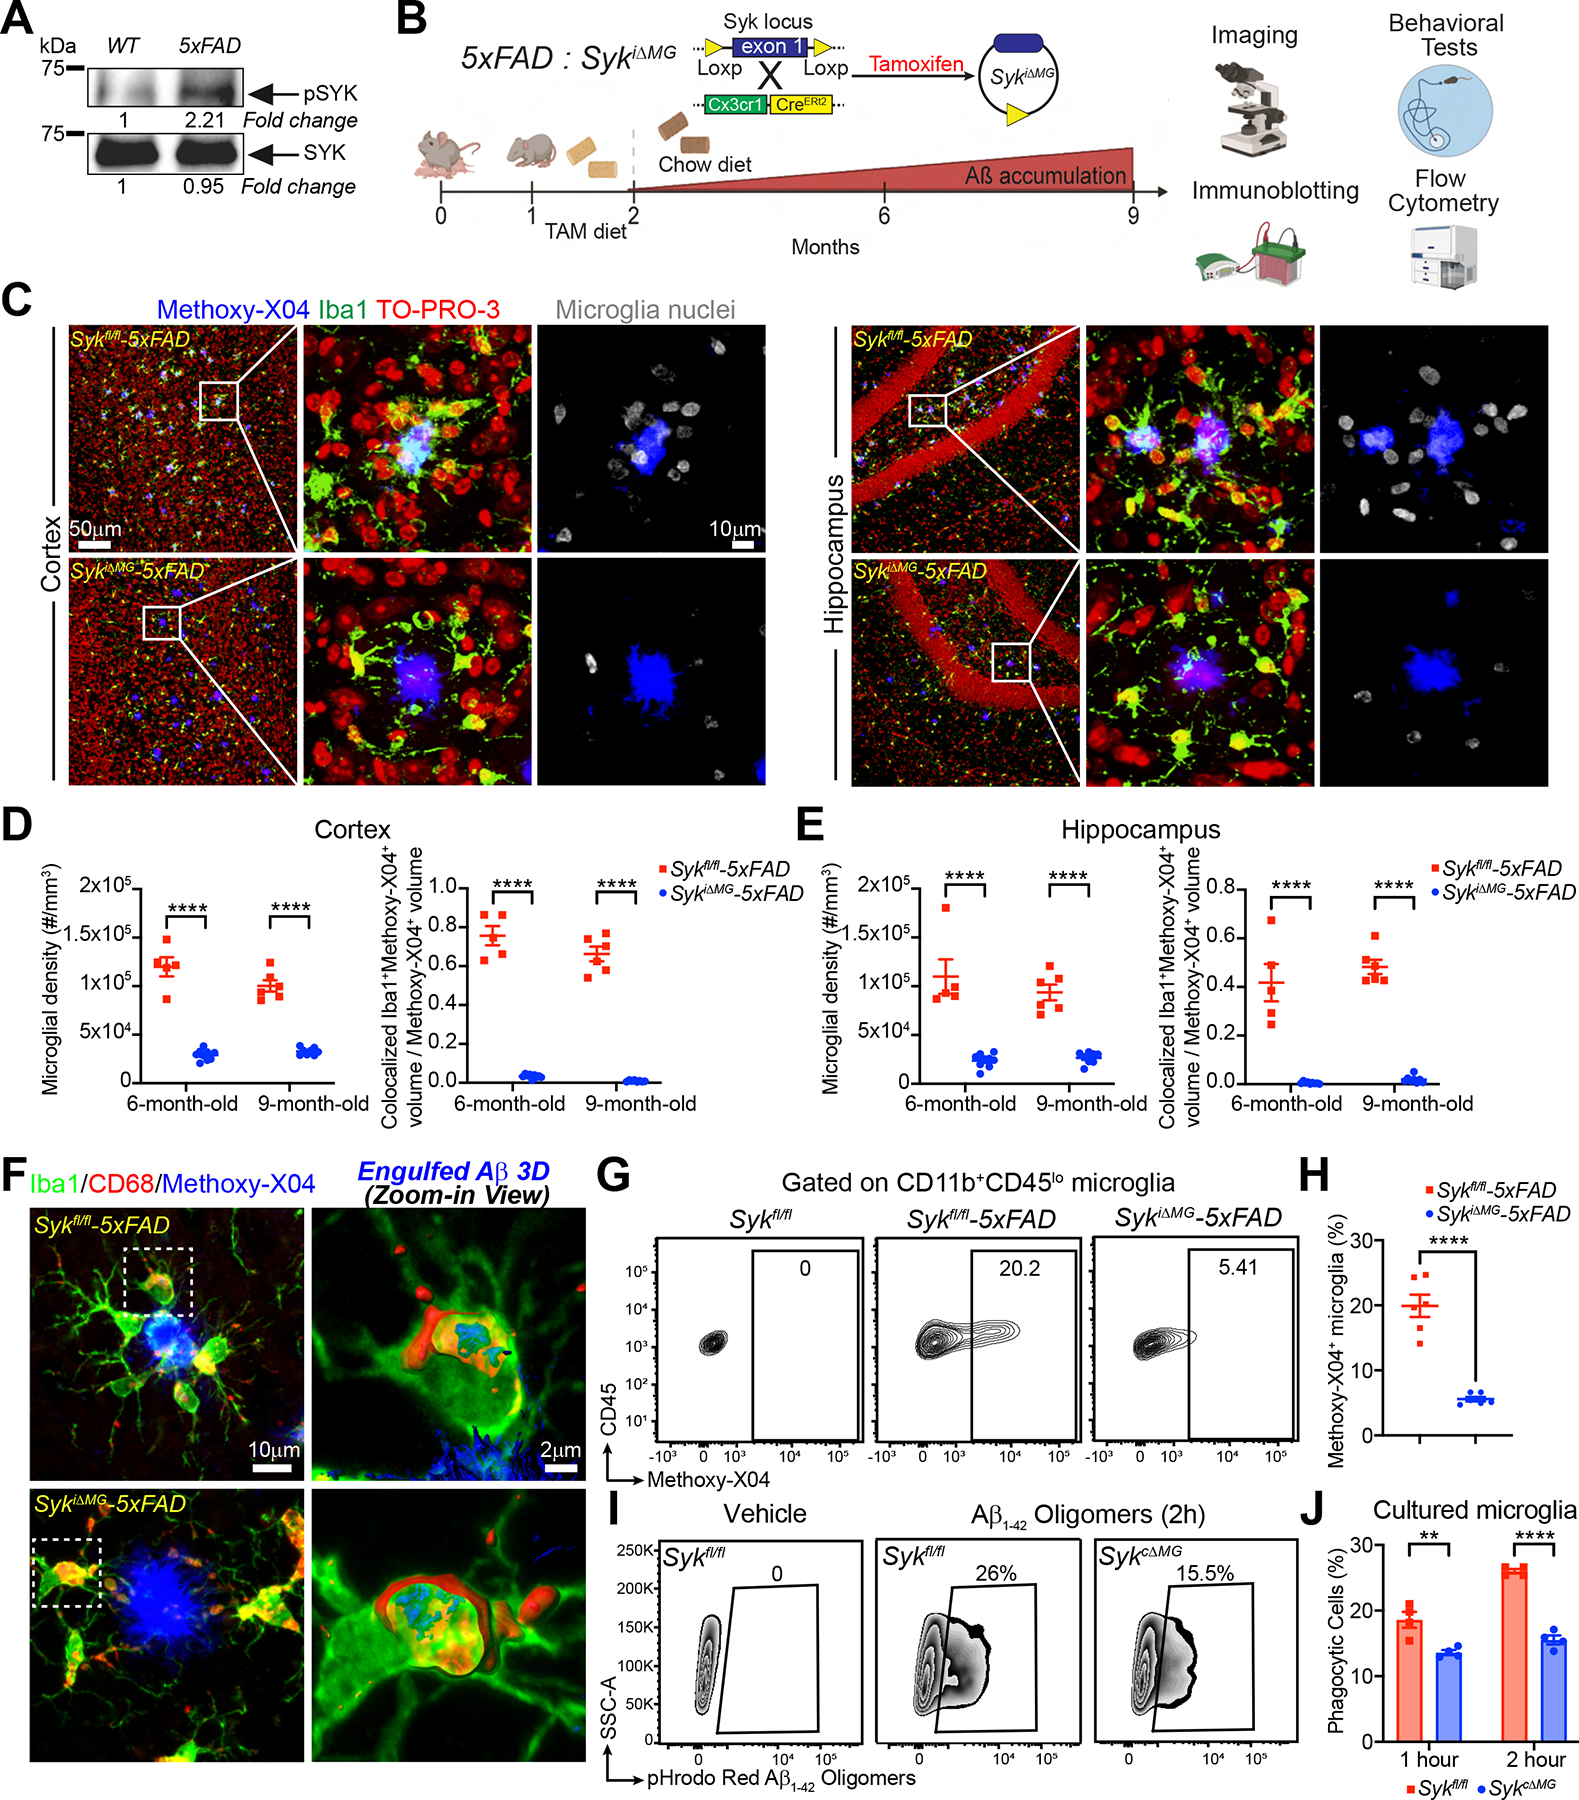
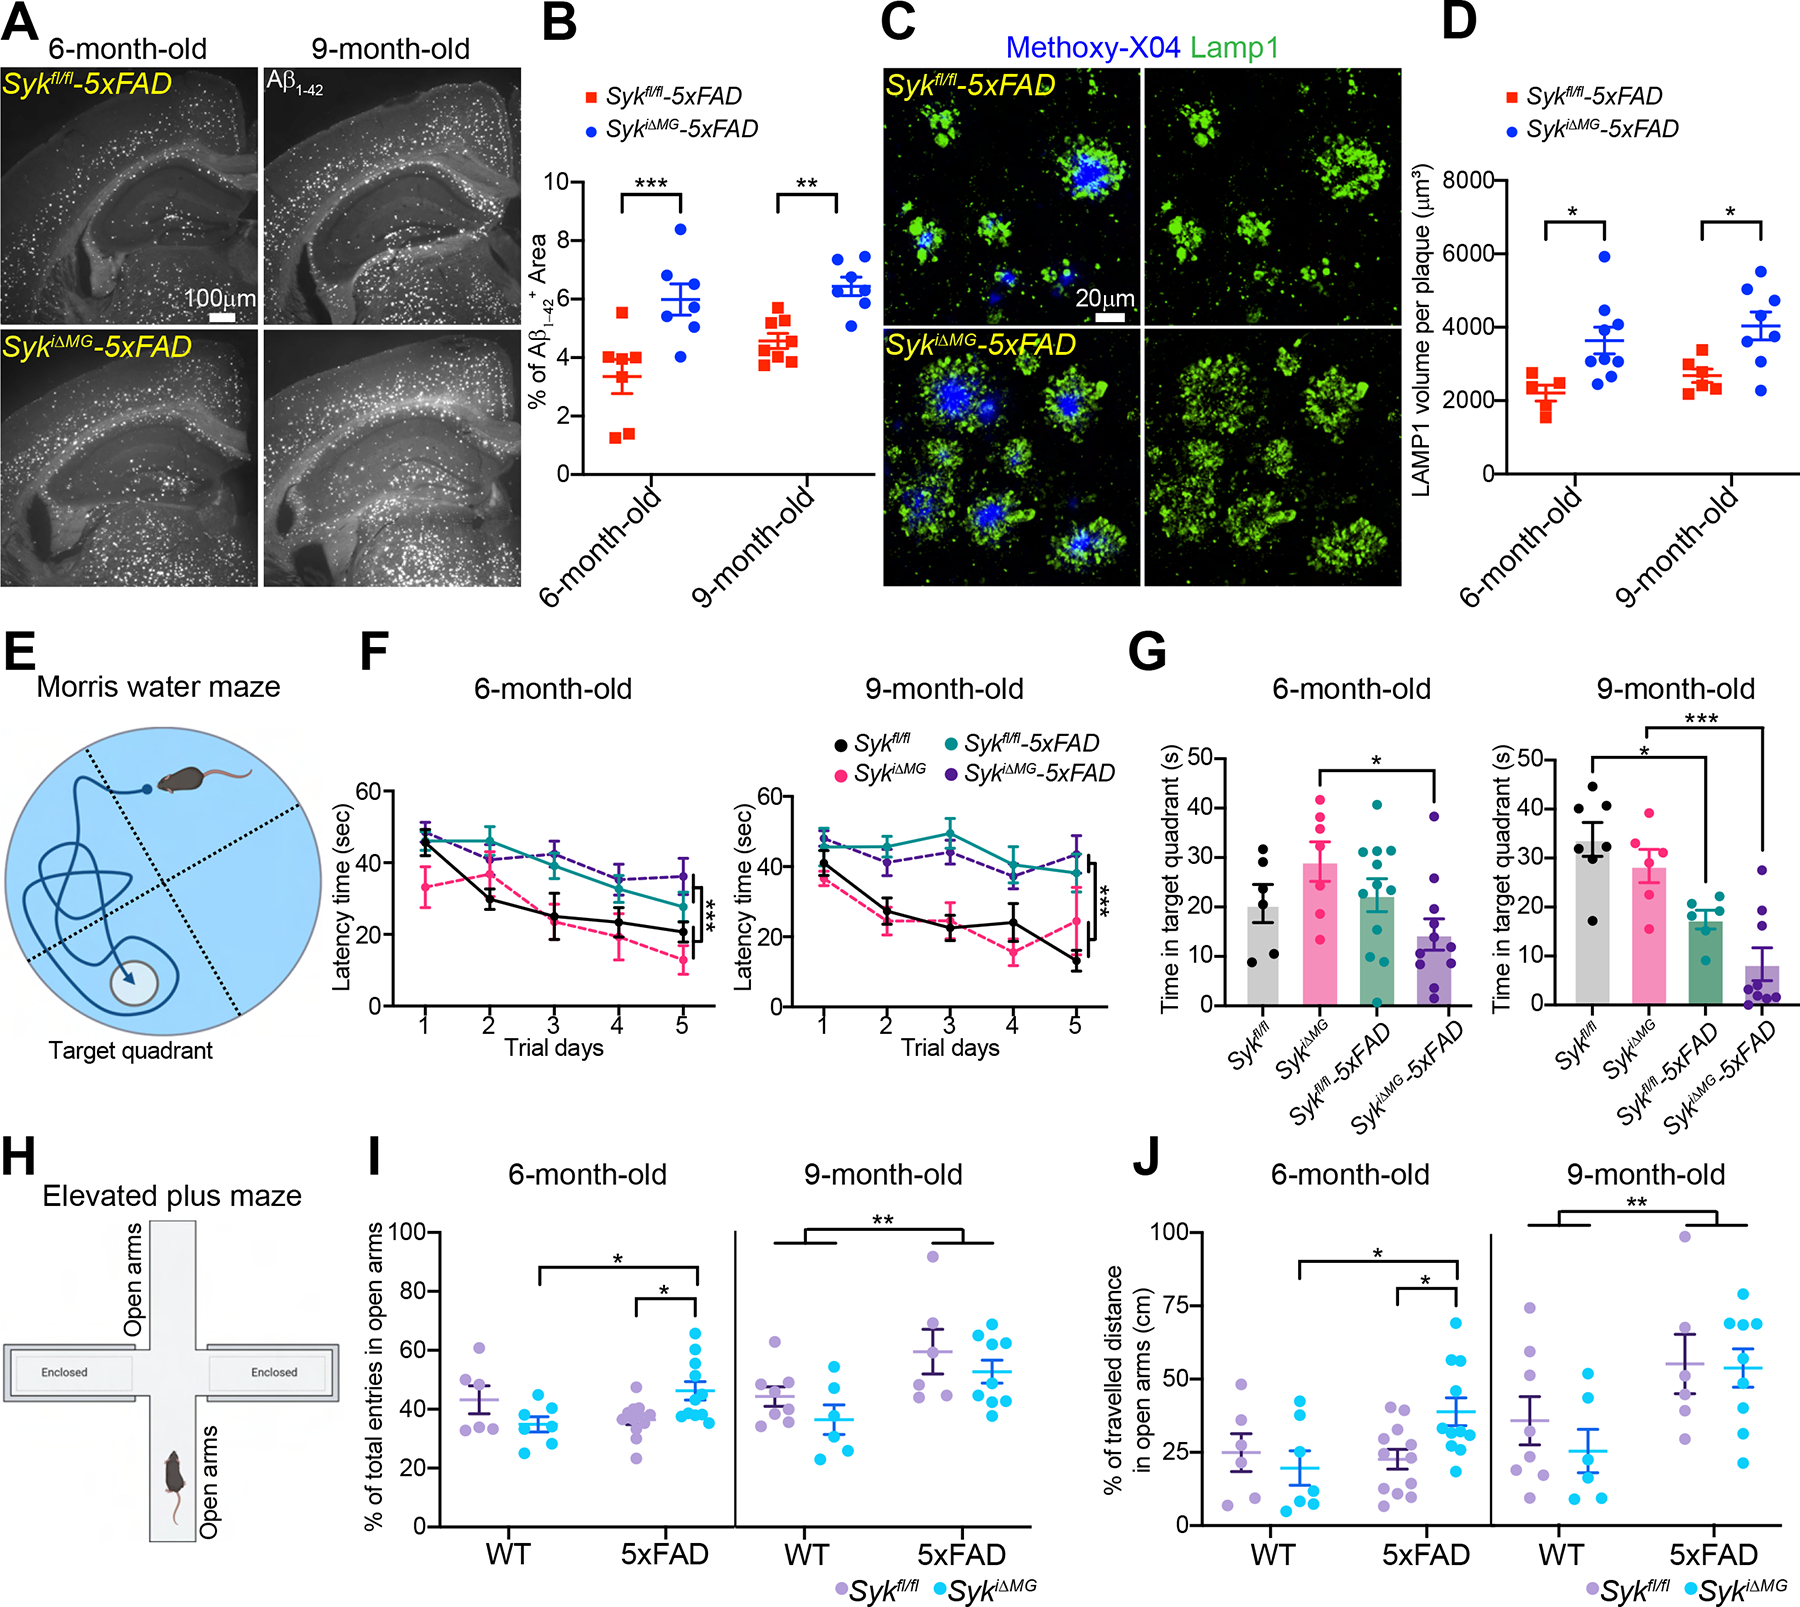
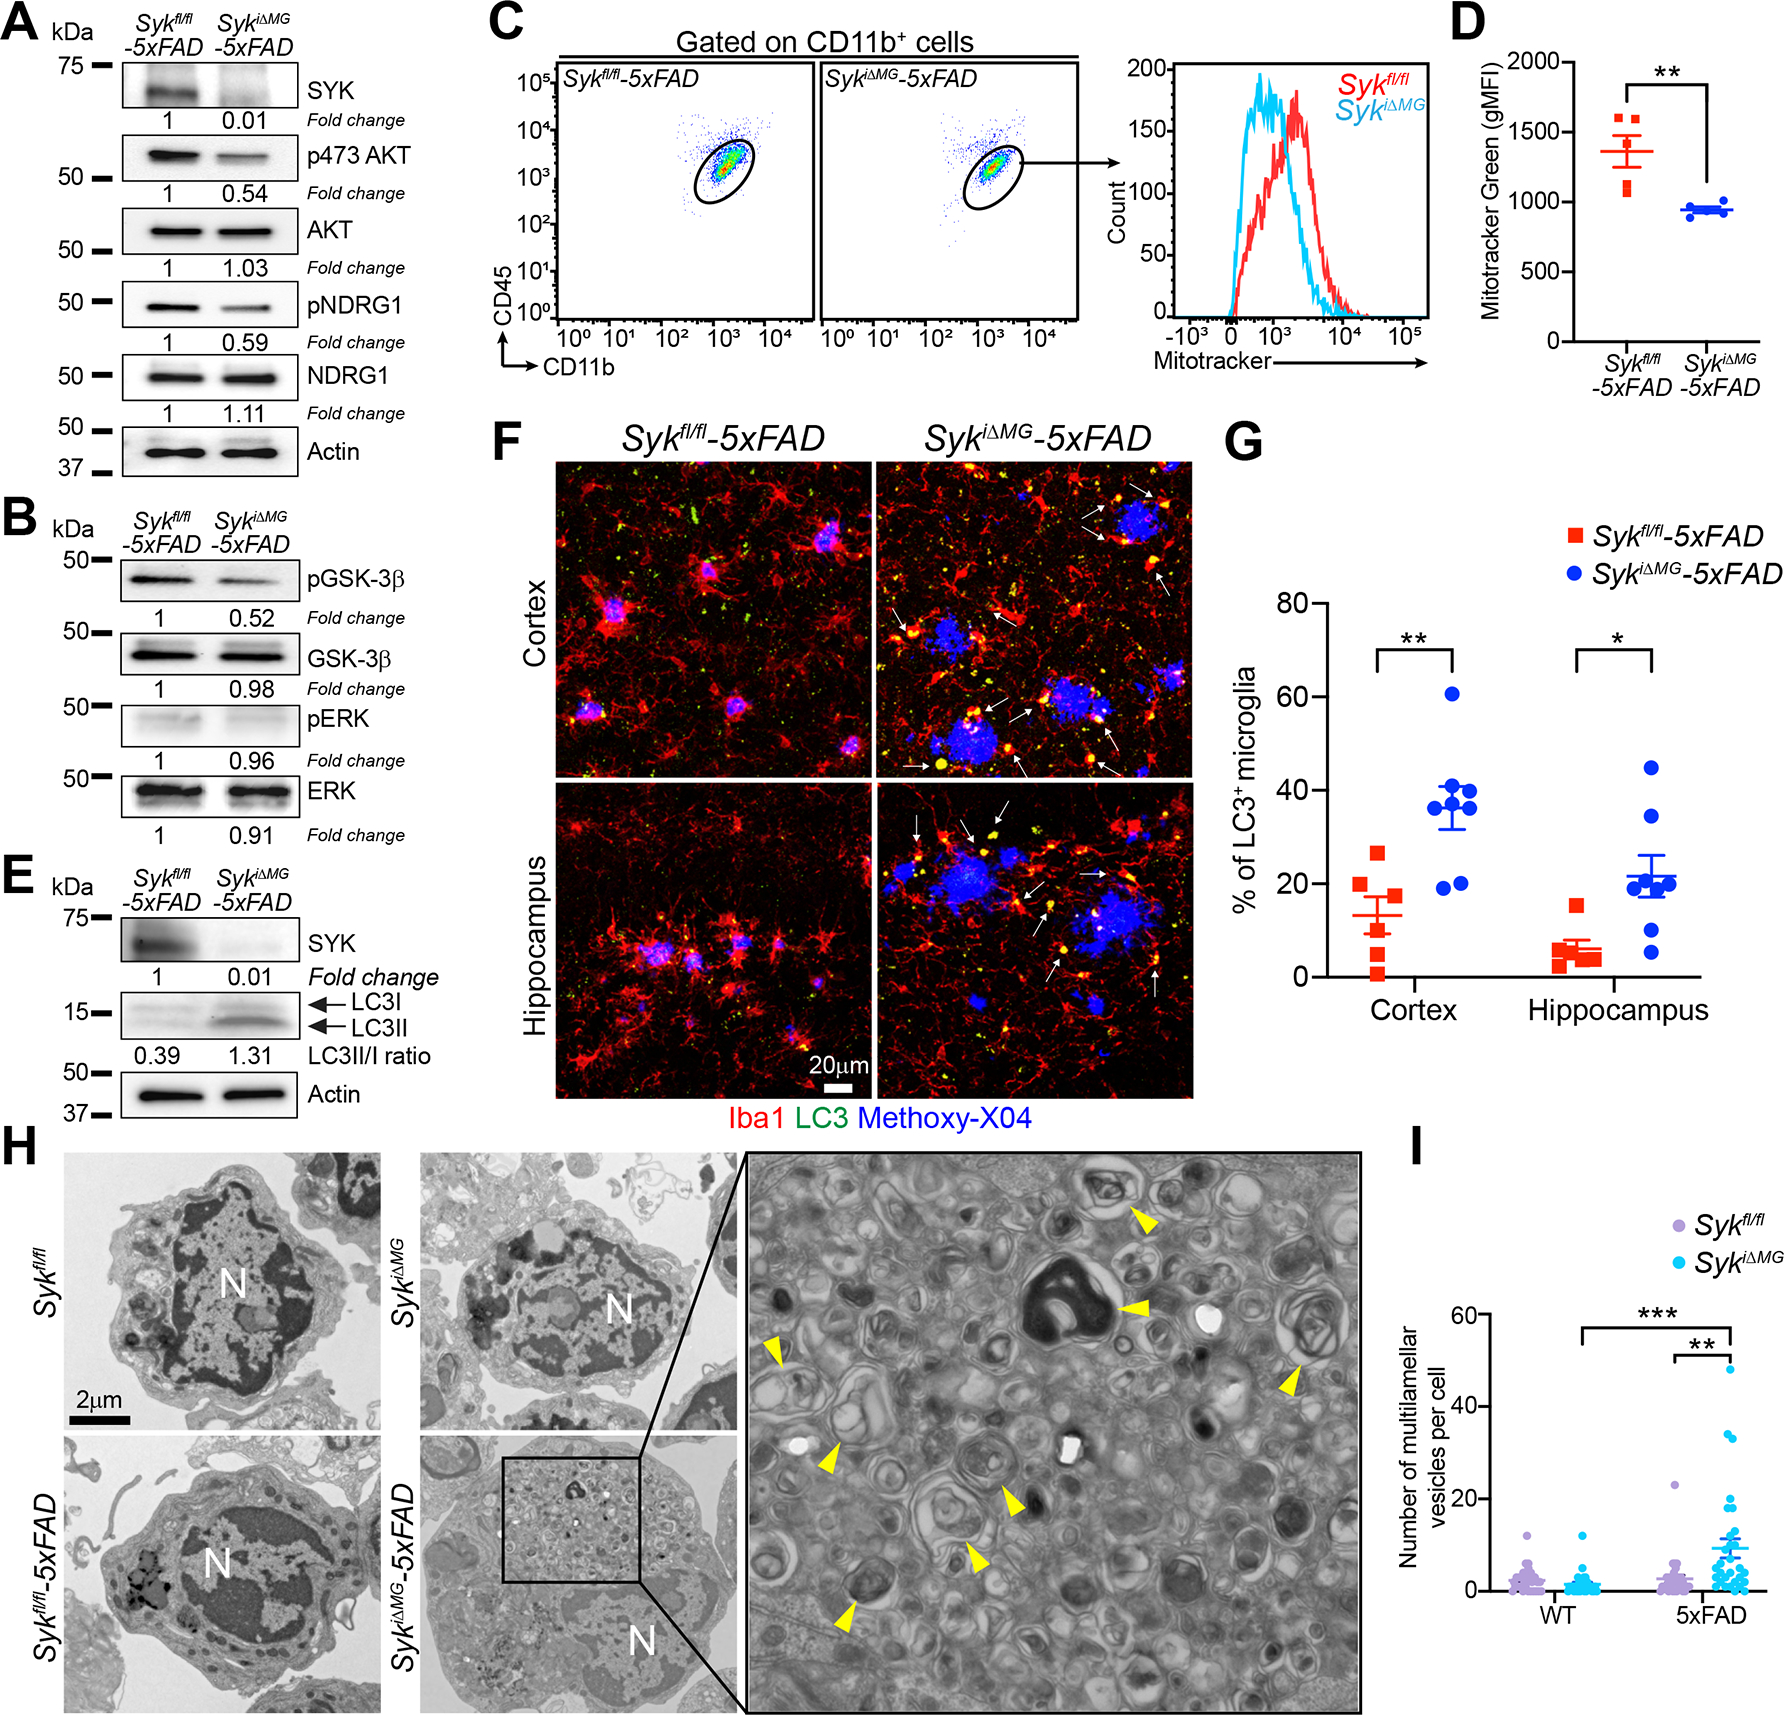
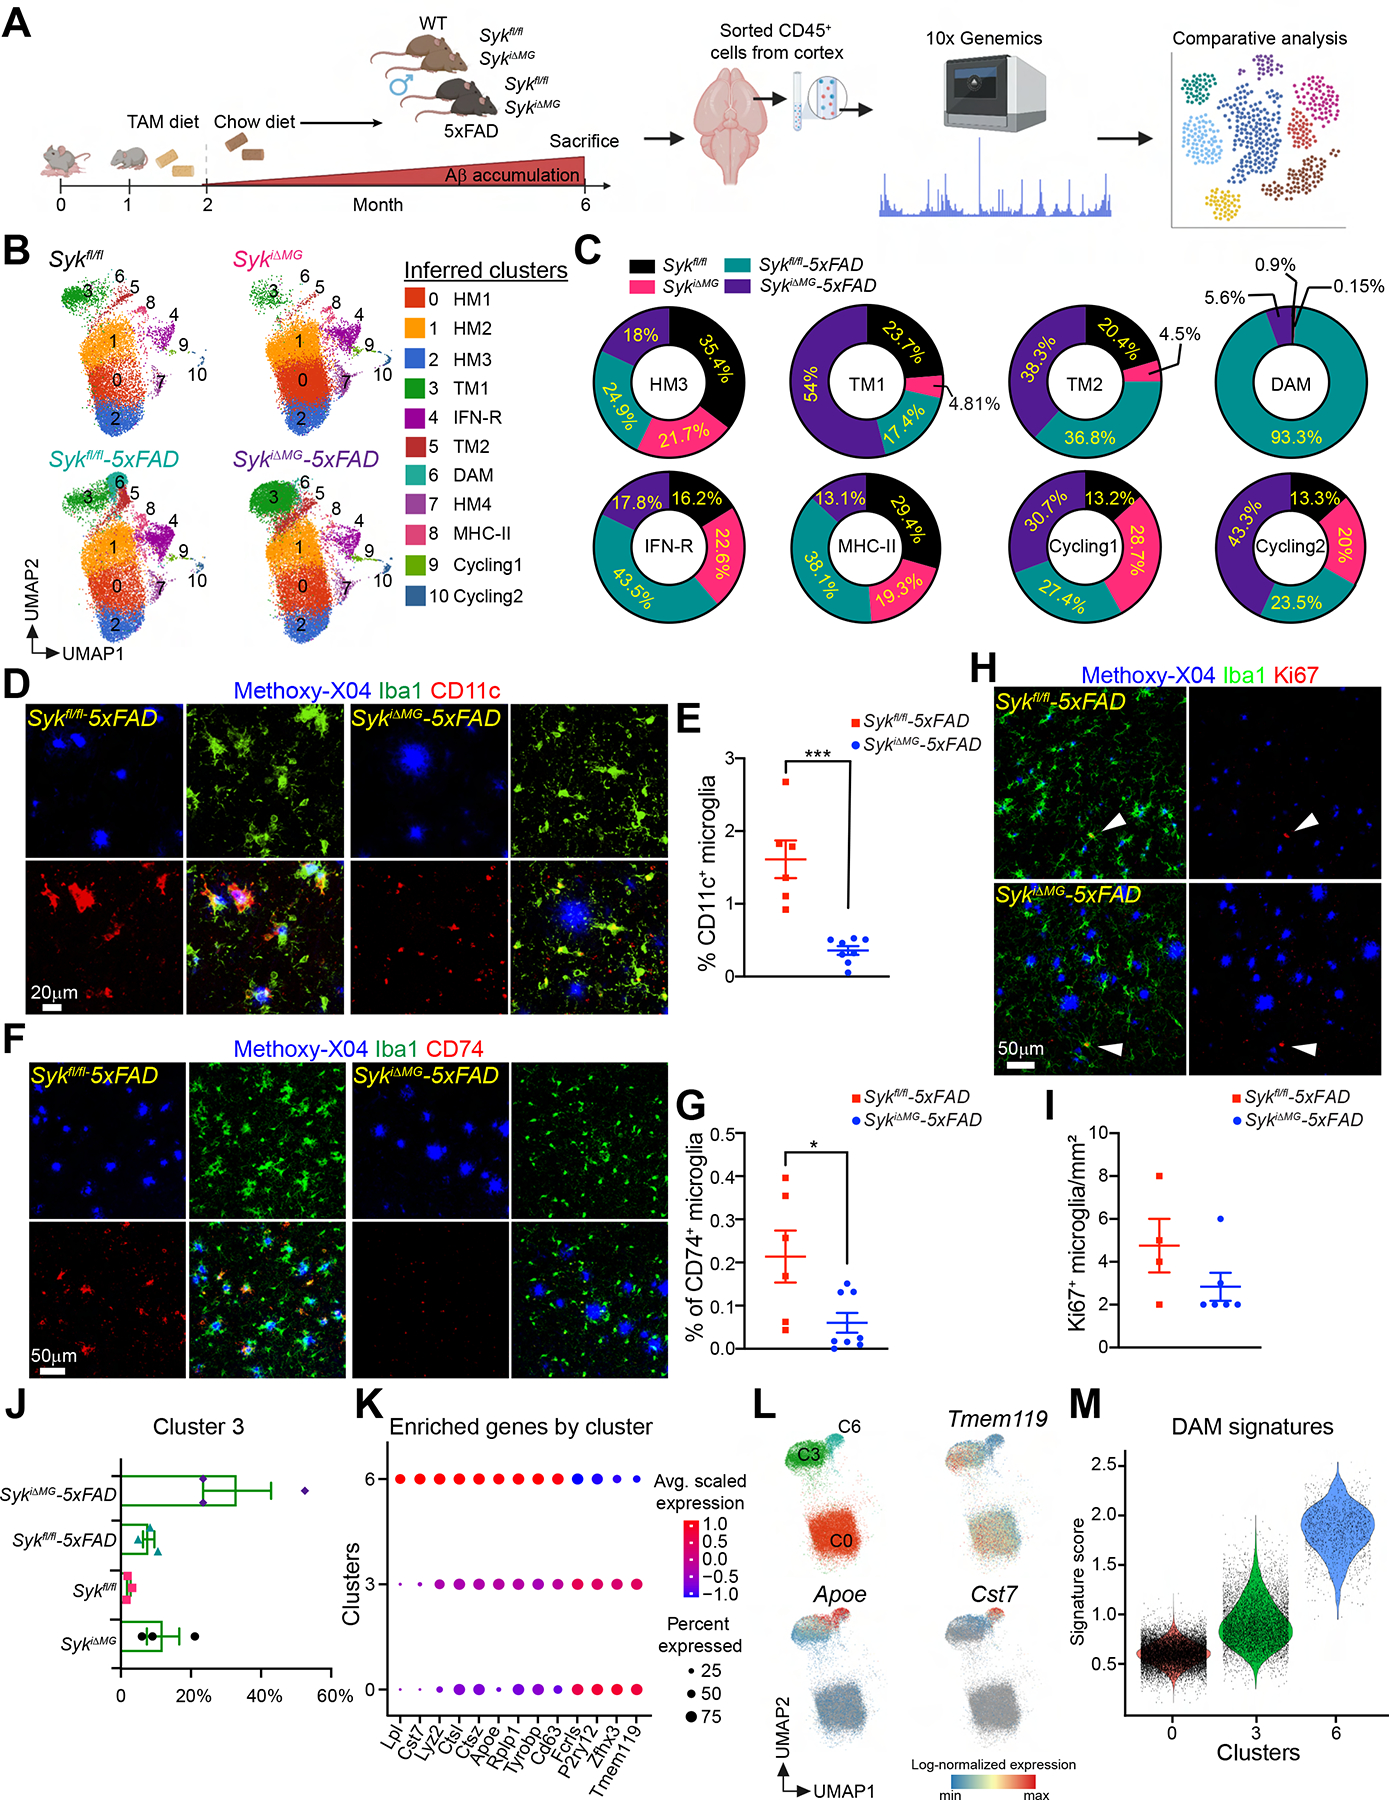
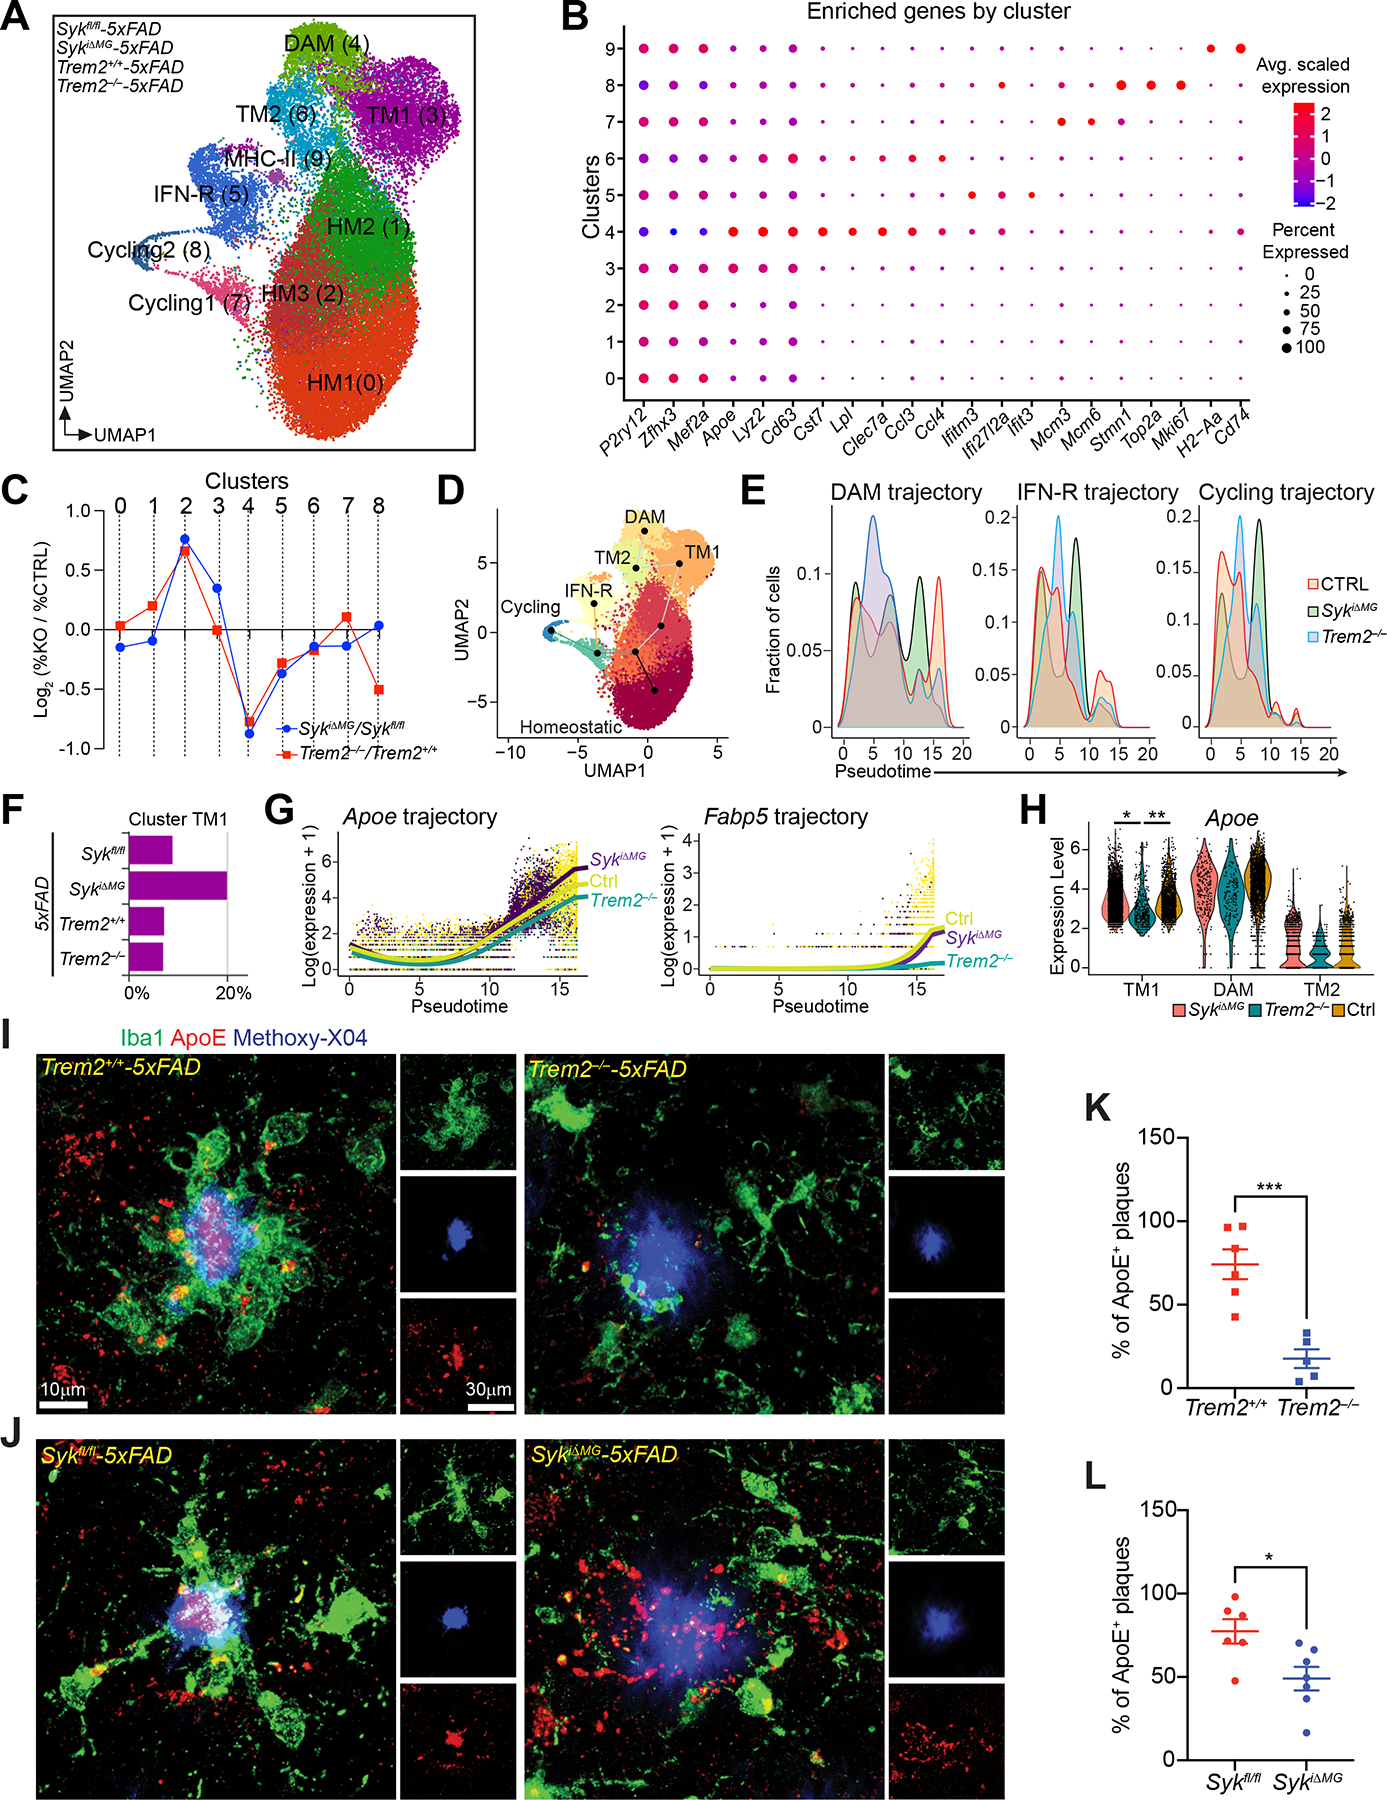
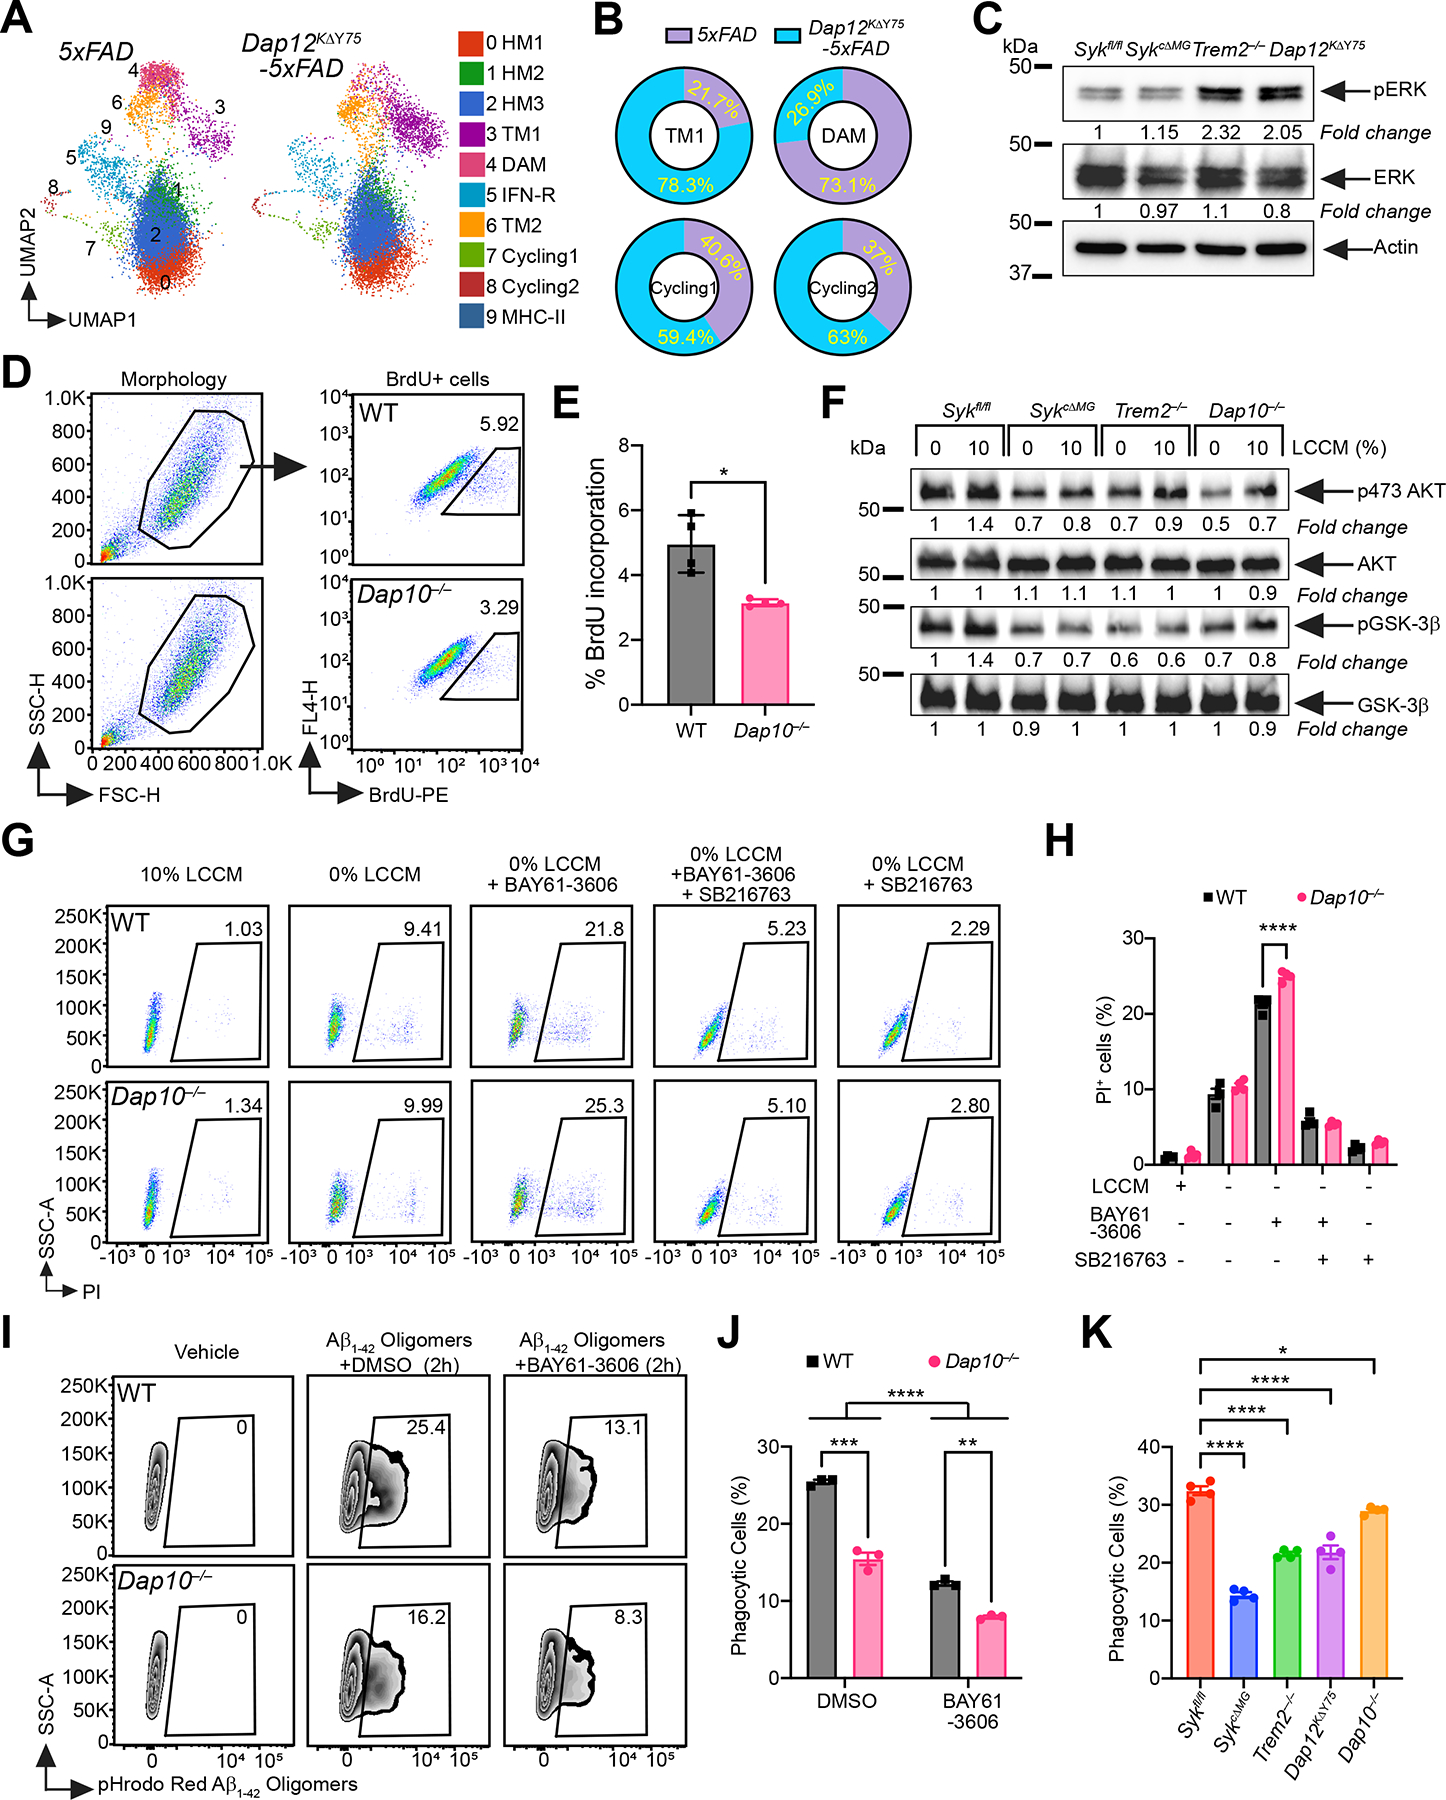
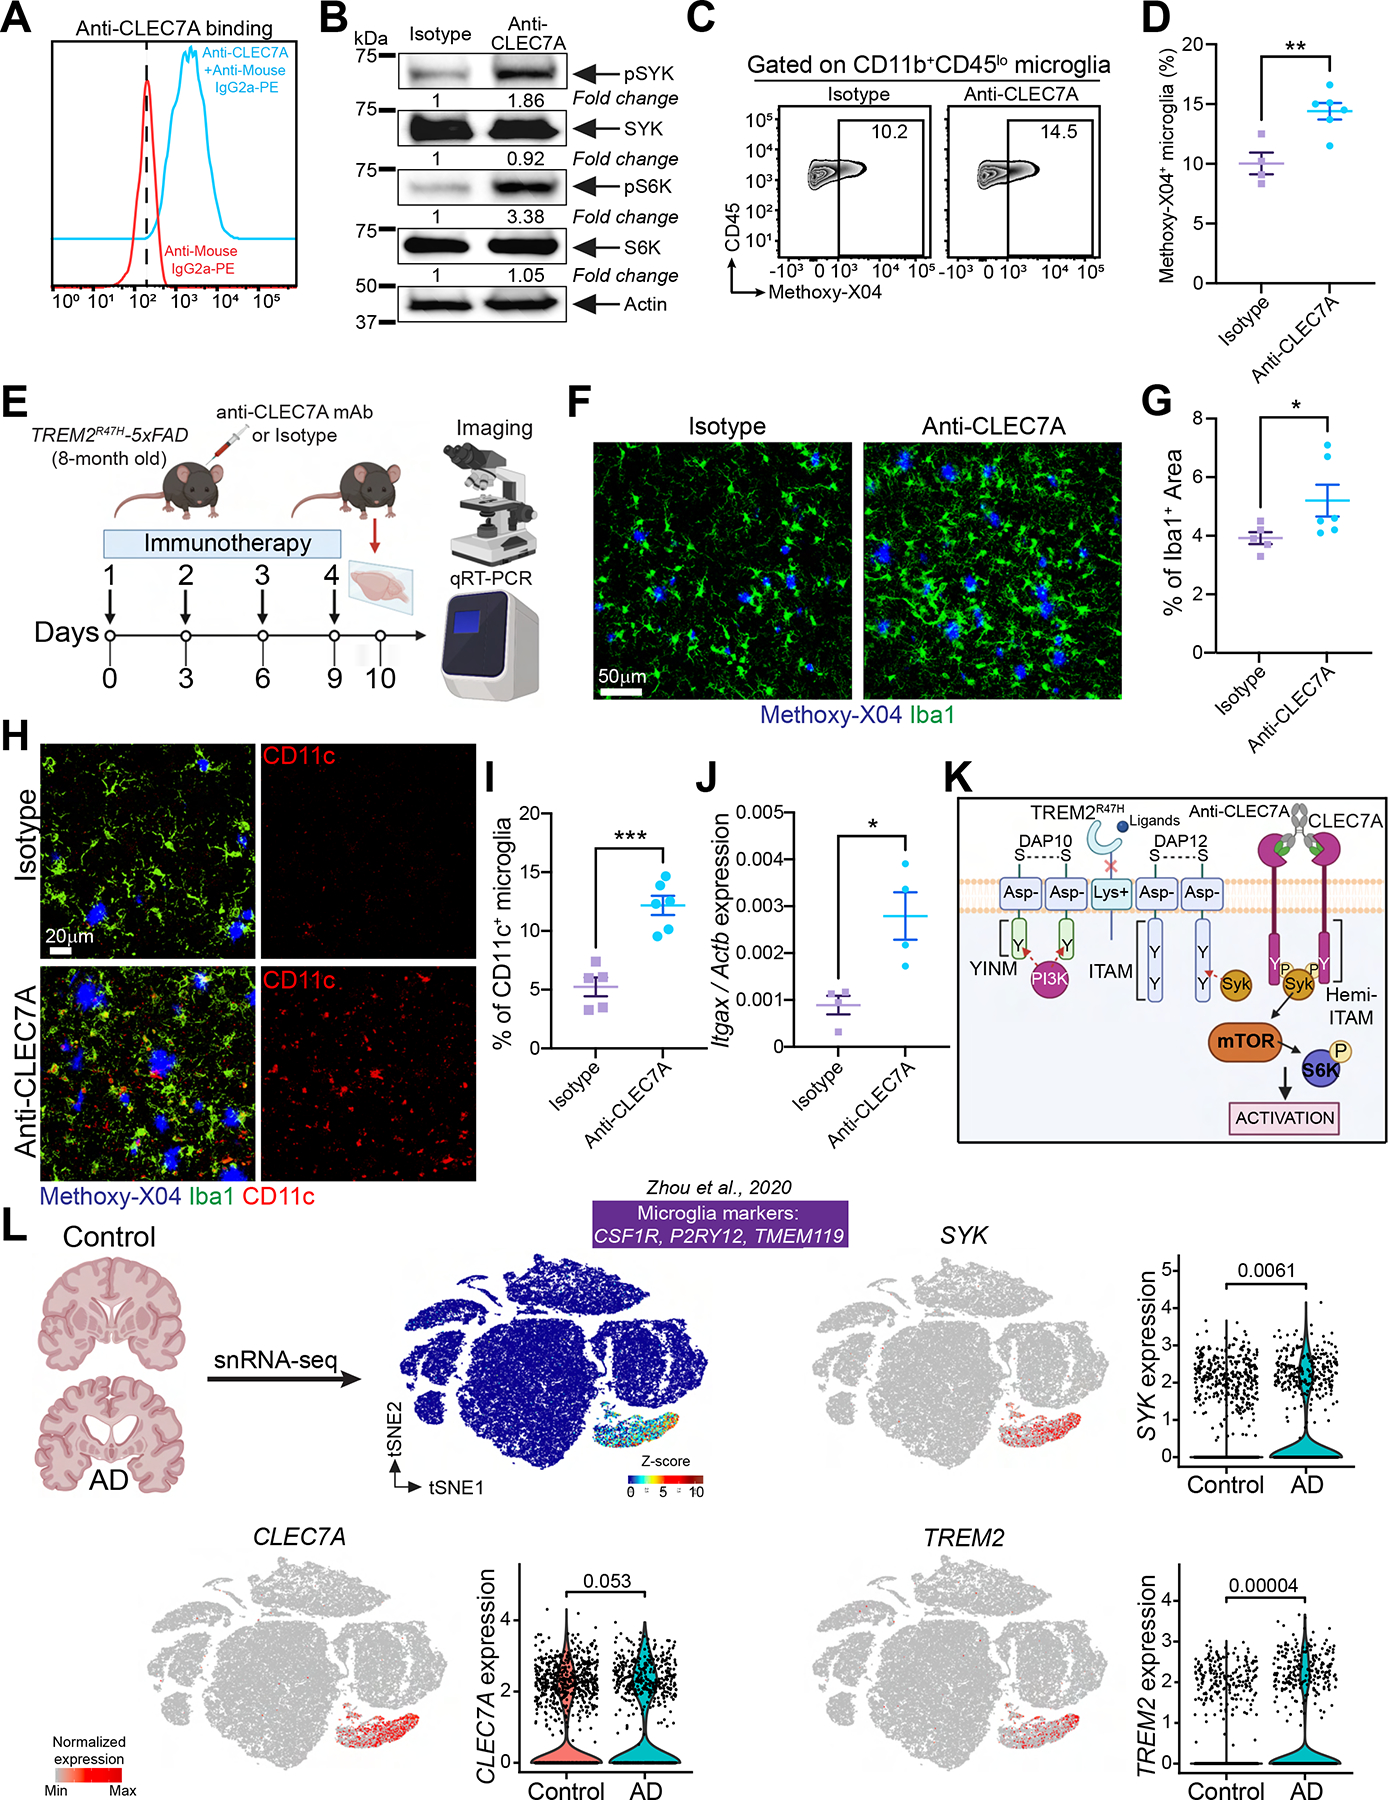
Genetic studies have highlighted microglia as pivotal in orchestrating Alzheimer's disease (AD). Microglia that adhere to Aβ plaques acquire a transcriptional signature, "disease-associated microglia" (DAM), which largely emanates from the TREM2-DAP12 receptor complex that transmits intracellular signals through the protein tyrosine kinase SYK. The human TREM2R47H variant associated with high AD risk fails to activate microglia via SYK. We found that SYK-deficient microglia cannot encase Aβ plaques, accelerating brain pathology and behavioral deficits. SYK deficiency impaired the PI3K-AKT-GSK-3β-mTOR pathway, incapacitating anabolic support required for attaining the DAM profile. However, SYK-deficient microglia proliferated and advanced to an Apoe-expressing prodromal stage of DAM; this pathway relied on the adapter DAP10, which also binds TREM2. Thus, microglial responses to Aβ involve non-redundant SYK- and DAP10-pathways. Systemic administration of an antibody against CLEC7A, a receptor that directly activates SYK, rescued microglia activation in mice expressing the TREM2R47H allele, unveiling new options for AD immunotherapy.

Keywords: Alzheimer's disease; ApoE; Dectin1; GSK-3β; Syk; TREM2; immunotherapy; metabolism; microglia; signaling.


Conflict of interest statement

Declaration of interests M. Colonna is a member of Vigil Neuro scientific advisory board (SAB), is consultant for Cell Signaling Technology and NGM Bio, has received research grants from Vigil Neuro during the conduct of the study, and has a patent to TREM2 pending. DMH co-founded and is on the SAB of C2N Diagnostics; is on the SAB of Denali, Genentech, and Cajal Neuroscience; consults for Alector; and is on the Advisory Board for Cell.

Figures

Figure 1.
Figure 1.. Conditional deletion of Syk in microglia abolishes their capacity to respond to Aβ plaques and uptake Aβ
(A) Immunoblot of SYK and pSYK protein on sorted microglia from 8-month-old WT and 5×FAD mice. Representative of two independent experiments. (B) Schematic of the experimental design. (C) Representative confocal images of cortex and dentate gyrus from 9-month-old Sykfl/fl- and SykiΔMG-5×FAD mice. (D and E) Quantification of microglia density within a 15-μm radius from the plaque surfaces and Iba1+methoxy-X04+ colocalization volume normalized by total methoxy-X04+ volume, in either cortex or hippocampus of 6- and 9- month-old mice of each genotype. Data points represent the average of two technical repeats (one experiment; n = 5–9 mice/genotype). (F) 3D reconstruction of microglia from 6-month-old Sykfl/fl- and SykiΔMG-5×FAD mice, showing engulfed Aβ inside CD68+ phagosomes. (G) Representative FACS plots of methoxy-X04+ microglia from 6-month-old Sykfl/fl, Sykfl/fl-5×FAD and SykiΔMG-5×FAD mice. (H) Percentage of methoxy-X04+ microglia from each genotype (two independent experiments; n = 6 mice/genotype). (I) Representative FACS plots of Sykfl/fl and SykcΔMG primary microglia cultured with pHrodo-Red labeled Aβ1–42 for 2 hours. (J) Quantification of Aβ1–42 uptake by primary microglia from each genotype. Representative of three independent experiments (n = 4 technical repeats/group). **, P < 0.01; ****, P < 0.0001- by two-way ANOVA with Sidak’s multiple comparisons test (D, E and J), or two-tailed unpaired Student’s t test (H). Data are presented as mean ± SEM. See also Figure S1 in the supplemental information.
Figure 2.
Figure 2.. SYK deficiency in microglia exacerbates Aβ pathology and leads to behavior and memory defects
(A) Representative images of Aβ1–42 staining in 6- and 9-month-old Sykfl/fl-5×FAD and SykiΔMG-5×FAD mice. (B) Percentage of Aβ1–42+ area in the cortex of 6- and 9-month-old mice of each genotype. Data points represent the average of three technical repeats (one experiment; n = 7–8 mice/genotype). (C) Representative confocal images of methoxy-X04 and Lamp1+ dystrophic neurites in the cortex of 9-month-old Sykfl/fl-5×FAD and SykiΔMG-5×FAD mice. (D) Volumes of dystrophic neurites per plaque in 6- and 9-month-old mice of each genotype. Data points represent the average of two technical repeats (one experiment; n = 5–9 mice/genotype). (E-G) Morris water maze tests on 6- and 9-month-old Sykfl/fl and SykiΔMG mice with or without 5×FAD transgenes. F) Latency time to submerged platform; (G) time in target quadrant without submerged platform. (H-J) Elevated plus maze test on 6- and 9-month-old Sykfl/fl and SykiΔMG mice with or without 5×FAD transgenes. (I) Percentage of entries into open arms; (J) percentage of travelled distance in open arms. Sample size of behavioral tests: 6-month-old Sykfl/fl (n=6), SykiΔMG (n=7), Sykfl/fl-5×FAD (n=12) and SykiΔMG-5×FAD (n=11); 9-month-old Sykfl/fl (n=7), SykiΔMG (n=6), Sykfl/fl-5×FAD (n=6) and SykiΔMG-5×FAD (n=9). *, P < 0.05; **, P < 0.01; ***, P < 0.001 by two-way ANOVA with Sidak’s multiple comparisons test (B, D, F, I and J), or one-way ANOVA with Tukey’s multiple comparisons test (G). Data are presented as mean ± SEM. See also Figure S2 in the supplemental information.
Figure 3.
Figure 3.. SYK deficiency impairs the PI3K-AKT-GSK3-β-mTOR axis, and augments autophagy in microglia of 5×FAD mice
(A and B) Immunoblots of the indicated molecules on sorted microglia from 9-month-old Sykfl/fl-5×FAD and SykiΔMG-5×FAD mice. Representative of two independent experiments. (C and D) Quantification of mitochondrial mass in microglia from 9-month-old Sykfl/fl-5×FAD and SykiΔMG-5×FAD mice assessed by MitoTracker Green incorporation (two independent experiments; n = 5 mice/genotype). (E) Immunoblot of the LC3II/LC3I ratio on sorted microglia from 9-month-old Sykfl/fl- 5×FAD and SykiΔMG-5×FAD mice. Representative of two independent experiments. (F) Representative confocal images of methoxy-X04, Iba1, and LC3 staining in the cortex and hippocampus of 9-month-old Sykfl/fl-5×FAD and SykiΔMG-5×FAD mice (arrows indicate microglial LC3+ vesicles). (G) Percentage of LC3+ microglia in 9-month-old mice of each genotype. Data points represent the average of two technical repeats (one experiment; n = 6–8 mice/genotype). (H) Representative TEM images of microglia sorted from 9-month-old Sykfl/fl and SykiΔMG mice, with or without 5×FAD transgenes (N = nucleus; yellow arrowheads = multivesicular structures). (I) Number of multivesicular structures per microglia (n = 30 cells/genotype). *, P < 0.05; **, P < 0.01; ***, P < 0.001 by two-tailed unpaired Student’s t test (D), or two-way ANOVA with Sidak’s multiple comparisons test (G and I). Data are presented as mean ± SEM. See also Figure S3 in the supplemental information.
Figure 4.
Figure 4.. SYK deficiency in microglia hampers microglial activation in 5×FAD mice
(A) Schematic of the experimental design. (B) UMAP plots of microglia from each genotype (n = 3 mice/genotype). Cluster annotation based on expression of signature genes shown in Figure S5. (C) Proportional contribution of each genotype to designated clusters. (D and F) Representative confocal images of methoxy-X04, Iba-1 and CD11c or CD74 staining in the cortex of 6-month-old Sykfl/fl-5×FAD and SykiΔMG-5×FAD mice. (E and G) Percentage of CD11c+ or CD74+ microglia in the cortex of each genotype. Data points represent the average of two technical repeats (one experiment; n = 6–8 mice/genotype). (H) Representative confocal images of methoxy-X04, Iba-1, and Ki67 in the cortex of 6-month-old Sykfl/fl-5×FAD and SykiΔMG-5×FAD mice. (I) Quantification of Ki67+ microglia from indicated mice. Data points represent the average of two technical repeats (representative of two independent experiments; white arrows indicate Ki67+ microglia; n = 4–6 mice/genotype). (J) Relative abundance of cluster 3 (TM1) in all genotypes. (K) Average scaled expression levels of selected signature genes for clusters 0 (HM1), 3 (TM1) and 6 (DAM). (L) UMAP plots showing enrichment of selected signature in clusters 0 (HM1), 3 (TM1) and 6 (DAM). (M) Violin plots of the DAM signature scores in clusters 0 (HM1), 3 (TM1) and 6 (DAM). *, P < 0.05; ***, P < 0.001 by two-tailed unpaired Student’s t test. Data are presented as mean ± SEM. See also Figure S5 and S6 in the supplemental information.
Figure 5.
Figure 5.. scRNA-seq reveals distinct defects in the DAM trajectories of SYK- and TREM2-deficient microglia
(A) UMAP plots of microglia from each genotype (n = 2–3 mice/genotype). (B) Average scaled expression levels of selected signature genes per cluster. (C) Log2 fold-change of cluster sizes in SykiΔMG-5×FAD and Trem2/-5×FAD respective to controls (Sykfl/fl-5×FAD and Trem2+/+-5×FAD). (D) UMAP plot showing the projection of the three identified phenotypic trajectories. (E) Pseudotime distribution of microglia from each genotype along DAM, IFN-R, and cycling trajectories. CTRL group is a pool of microglia from Sykfl/fl-5×FAD and Trem2+/+-5×FAD mice. (F) Relative abundance of cluster TM1 for each genotype. (G) Expression levels of Apoe and Fabp5 along the DAM trajectory for indicated genotypes. CTRL group is a pool of microglia from Sykfl/fl-5×FAD and Trem2+/+-5×FAD mice. (H) Violin plots comparing Apoe expression among indicated genotypes in selected clusters (TM1, TM2 and DAM). CTRL group is a pool of microglia from Sykfl/fl-5×FAD and Trem2+/+-5×FAD mice. (I and J) Representative confocal images of methoxy-X04, Iba-1 and ApoE staining the cortex of 6-month-old Trem2+/+-5×FAD, Trem2/-5×FAD, Sykfl/fl-5×FAD and SykiΔMG-5×FAD mice. (K and L) Percentage of ApoE-positive plaques in each genotype. Data points represent the average of two technical repeats (one experiment; n = 5–7 mice/genotype). *, P < 0.05; **, P < 0.01; ***, P < 0.001 by two-tailed unpaired Student’s t test (K and L), or mixed model (H) (see METHOD DETAILS). Data are presented as mean ± SEM.
Figure 6.
Figure 6.. DAP10 activates microglia independently of SYK
(A) UMAP plots of microglia from each genotype (n = 3–4 mice/genotype). Cluster annotation based on expression of signature genes shown in Figure 5B and S5. (B) Proportional contribution of each genotype to designated clusters. (C) Immunoblots of ERK and pERK on BMDM from indicated genotypes. Representative of two independent experiments. (D) Representative FACS plots of BrdU staining on WT and Dap10/ primary microglia. (E) Percentage of BrdU+ microglia in each genotype. Representative of three independent experiments (n = 4 technical repeats/genotype). (F) Immunoblots of AKT, pSer473 AKT, GSK3-β and pGSK3-β on cultured primary microglia from indicated genotypes, with or without 10% LCCM stimulation. Representative of two independent experiments. (G) Representative FACS plots of PI staining on WT and Dap10/ BMDM, cultured 48 hours under five different conditions: 1) 10% LCCM; 2) 0% LCCM; 3) 0% LCCM + BAY61–3606 (SYK inhibitor); 4) 0% LCCM + BAY61–3606 + SB216763 (GSK-3β inhibitor); 5) 0% LCCM + SB216763. (H) Percentage of dead BMDMs in each genotype, at the indicated conditions. Representative of three independent experiments (n = 4 technical repeats/group). (I) Representative FACS plots of WT and Dap10/ BMDMs cultured with pHrodo-Red labeled Aβ1–42 for 2 hours, with or without SYK inhibitor. (J) Quantification of Aβ1–42 uptake by BMDMs from each genotype, with or without SYK inhibitor. Representative of three independent experiments (n = 3 technical repeats/group). (K) Same experiment as in (I and J), on BMDMs of indicated genotypes. Representative of three independent experiments (n = 4 technical repeats/genotype). *, P < 0.05; **, P < 0.01; ***, P < 0.001; ****, P < 0.0001 by two-tailed unpaired Student’s t test (E), two-way ANOVA with Sidak’s multiple comparisons test (H and J), or one-way ANOVA with Tukey’s multiple comparisons test (K). Data are presented as mean ± SEM.
Figure 7.
Figure 7.. Acute treatment with anti-CLEC7A induces microglial activation in TREM2R47H-5×FAD mice
(A) Cultured WT primary microglia from P4 neonates stained with anti-CLEC7A. Cells stained only with secondary Ab served as negative control. Representative of three independent experiments. (B) Immunoblot of SYK, pSYK, S6K and pS6K on primary microglia treated with either isotype control or anti-CLEC7A. Representative of two independent experiments. (C) Representative FACS plots of methoxy-X04+ microglia from TREM2R47H-5×FAD mice, injected ip. with either isotype control or anti-CLEC7A. WT mice served as a negative control to set the methoxy-X04+ gate. (D) Percentage of methoxy-X04+ microglia in the tested groups (two independent experiments; n = 4–6 mice/group). (E) Schematic of the experimental design. (F) Representative confocal images of Iba1 and methoxy-X04 staining in the cortex of TREM2R47H-5×FAD mice injected with either isotype control or anti-CLEC7A. (G) Percentage of Iba1+ area in the tested groups. Data points represent the average of two technical repeats (one experiment; n = 5–6 mice/group). (H) Representative confocal images of methoxy-X04, Iba-1 and CD11c in the cortex of TREM2R47H-5×FAD mice injected with either isotype control or anti-CLEC7A. (I) Percentage of CD11c+ microglia in the tested groups. Data points represent the average of two technical repeats (one experiment; n = 5–6 mice/group). (J) Itgax mRNA levels assessed by qRT-PCR in whole cortical tissue from TREM2R47H-5×FAD mice injected with either isotype control or anti-CLEC7A (one experiment; n = 4 mice/group). (K) Cartoon summarizing the hypothetical pharmacodynamics of anti-CLEC7A in microglia. (L) tSNE plots of human brain cells from AD patients and control subjects analyzed by snRNA-seq. Expression of SYK, CLEC7A and TREM2 is displayed. *, P < 0.05, **, P < 0.01, ***, P < 0.001 by two-tailed unpaired Student’s t test (D, G, I and J), or Wilcoxon rank-sum test (L). Data are presented as mean ± SEM. See also Figure S7 in the supplemental information.

Comment in

References

    1. Askew K, Li K, Olmos-Alonso A, Garcia-Moreno F, Liang Y, Richardson P, Tipton T, Chapman MA, Riecken K, Beccari S, et al. (2017). Coupled Proliferation and Apoptosis Maintain the Rapid Turnover of Microglia in the Adult Brain. Cell Rep. 18, 391–405. - PMC - PubMed
    1. Atagi Y, Liu CC, Painter MM, Chen XF, Verbeeck C, Zheng H, Li X, Rademakers R, Kang SS, Xu H, et al. (2015). Apolipoprotein E is a ligand for triggering receptor expressed on myeloid cells 2 (TREM2). J. Biol. Chem 290, 26043–26050. - PMC - PubMed
    1. Van den Berge K, Roux de Bézieux H, Street K, Saelens W, Cannoodt R, Saeys Y, Dudoit S, and Clement L (2020). Trajectory-based differential expression analysis for single-cell sequencing data. Nat. Commun 11, 1201. - PMC - PubMed
    1. Brown GD, Taylor PR, Reid DM, Willment JA, Williams DL, Martinez-Pomares L, Wong SYC, and Gordon S (2002). Dectin-1 is a major β-glucan receptor on macrophages. J. Exp. Med 196, 407–412. - PMC - PubMed
    1. Chen Y, and Colonna M (2021). Microglia in Alzheimer’s disease at single-cell level. Are there common patterns in humans and mice? J. Exp. Med 218, 1–10. - PMC - PubMed

Publication types

LinkOut - more resources