. 2022 Dec 12;40(12):1566-1582.e10.
doi: 10.1016/j.ccell.2022.10.004. Epub 2022 Oct 27.

The m6A reader IGF2BP2 regulates glutamine metabolism and represents a therapeutic target in acute myeloid leukemia

Affiliations

The m6A reader IGF2BP2 regulates glutamine metabolism and represents a therapeutic target in acute myeloid leukemia

Hengyou Weng et al. Cancer Cell. .

Abstract

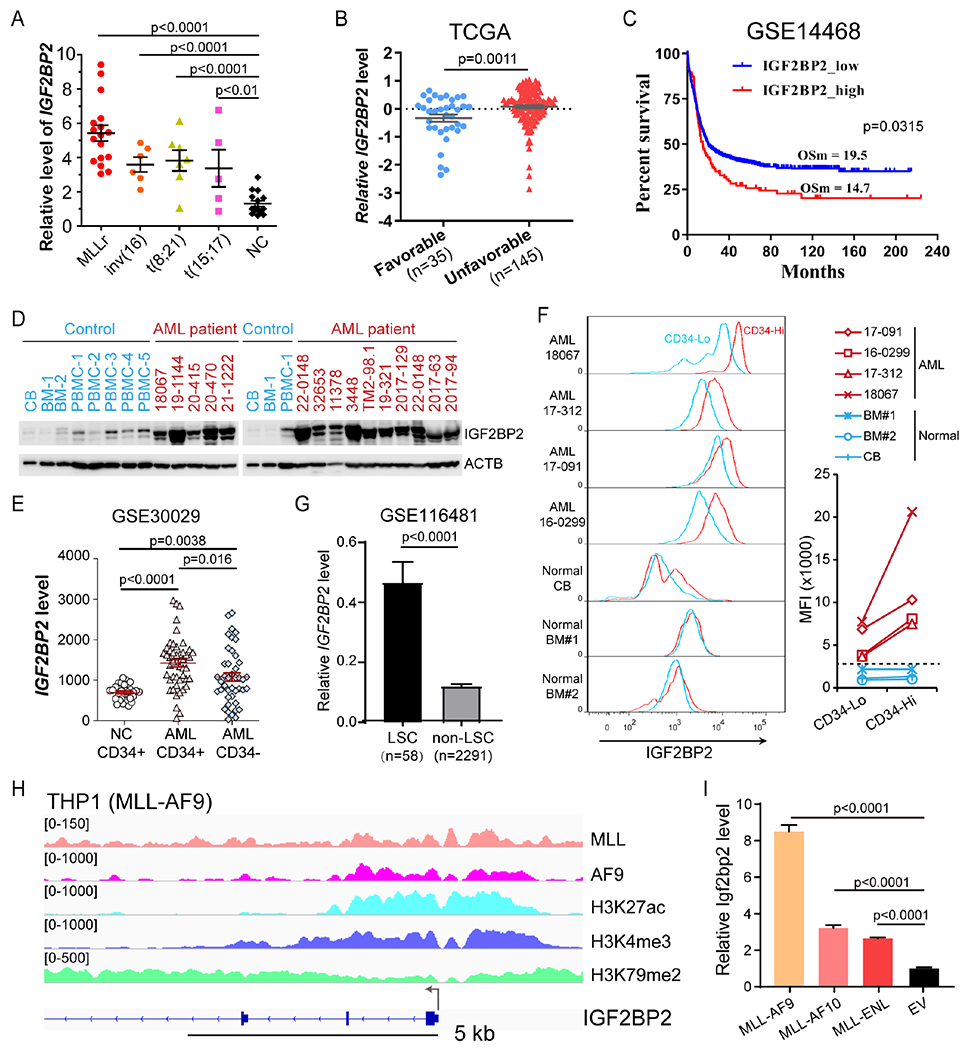
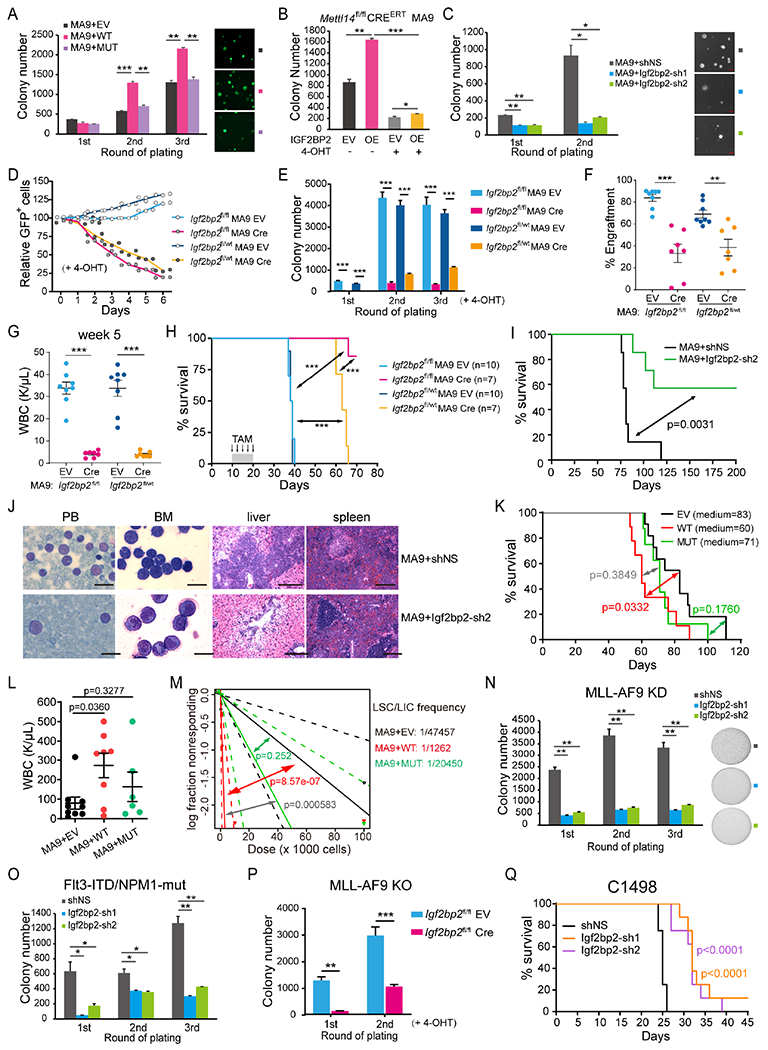
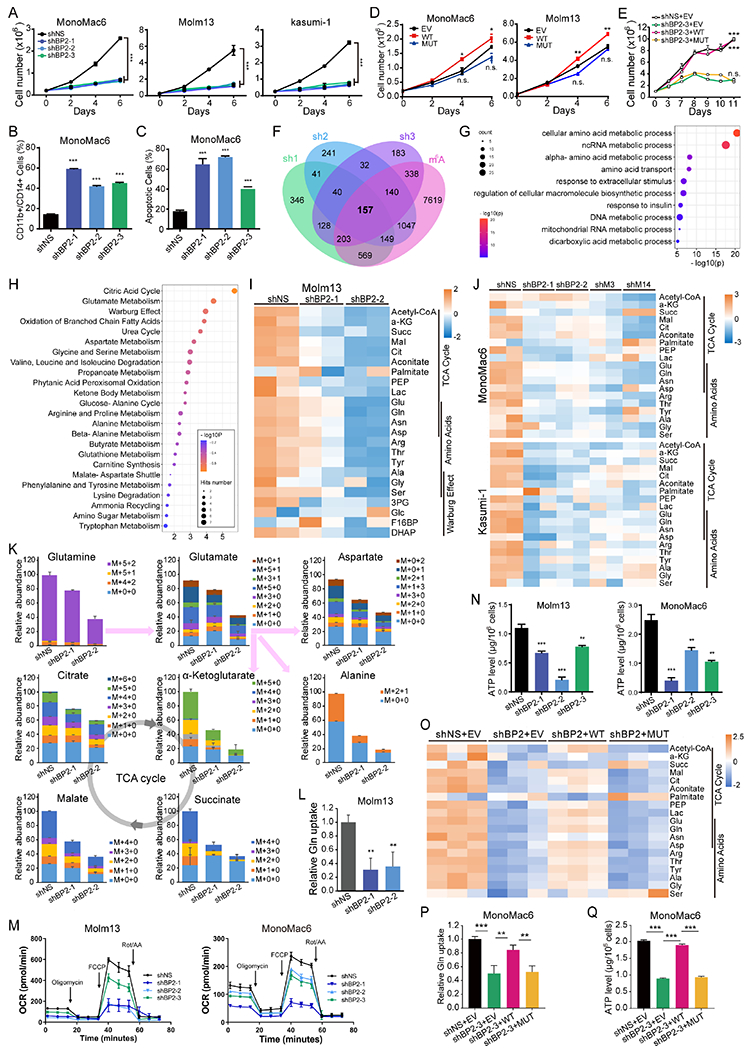
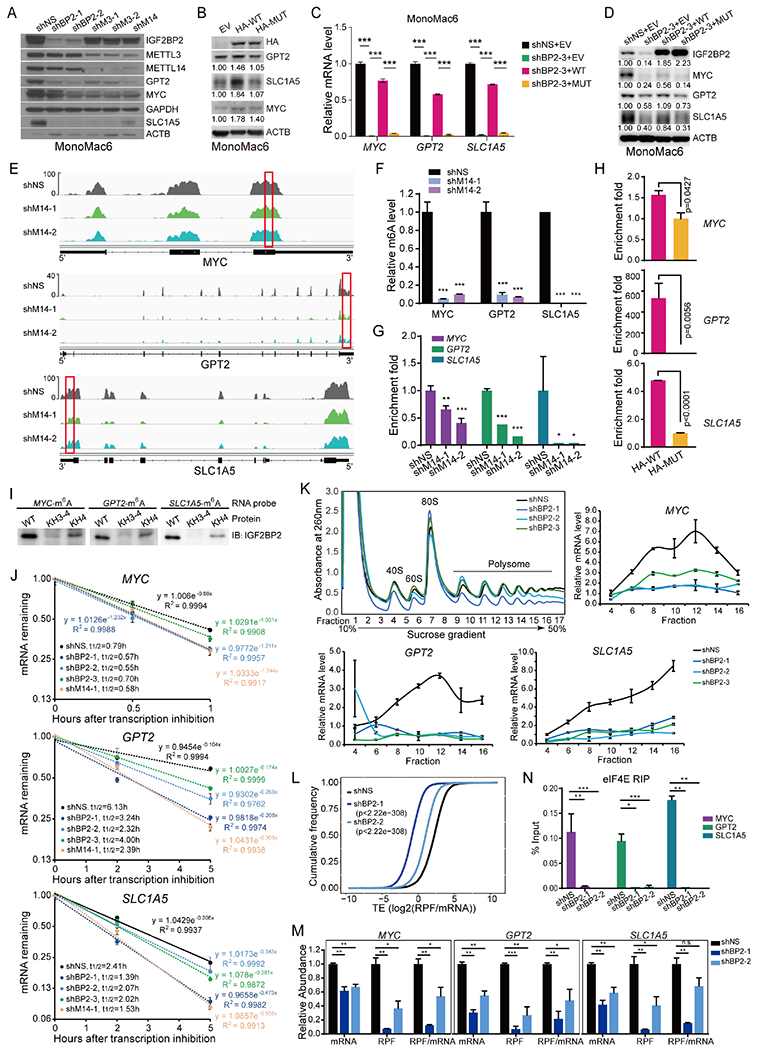
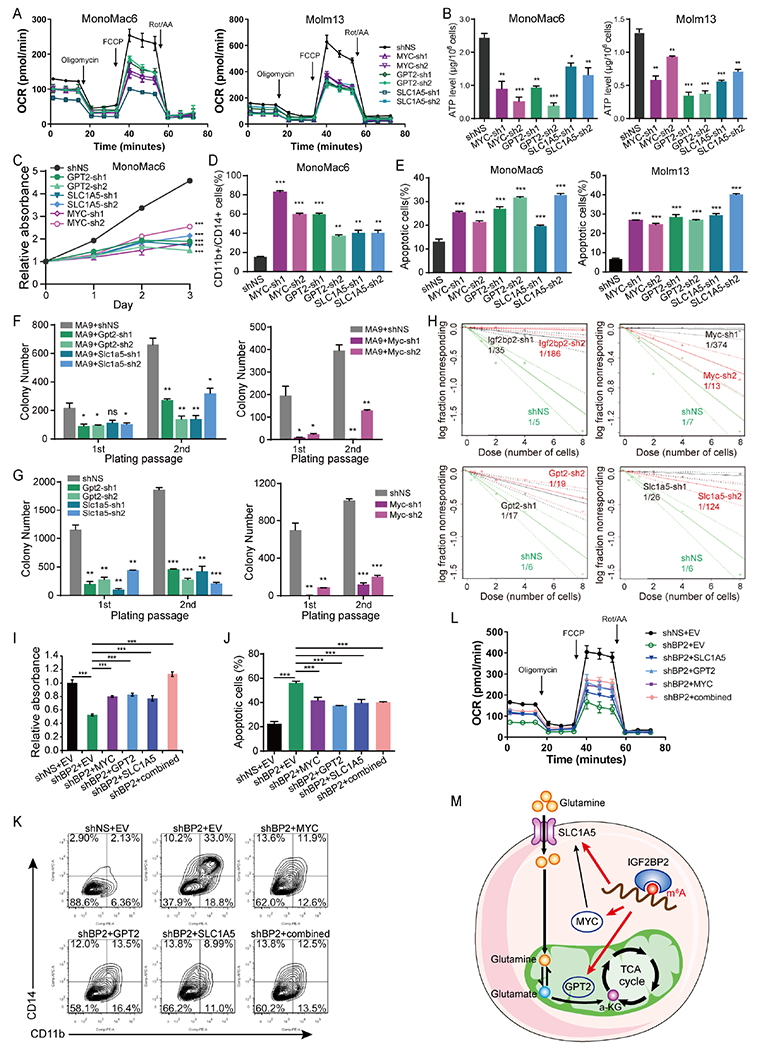
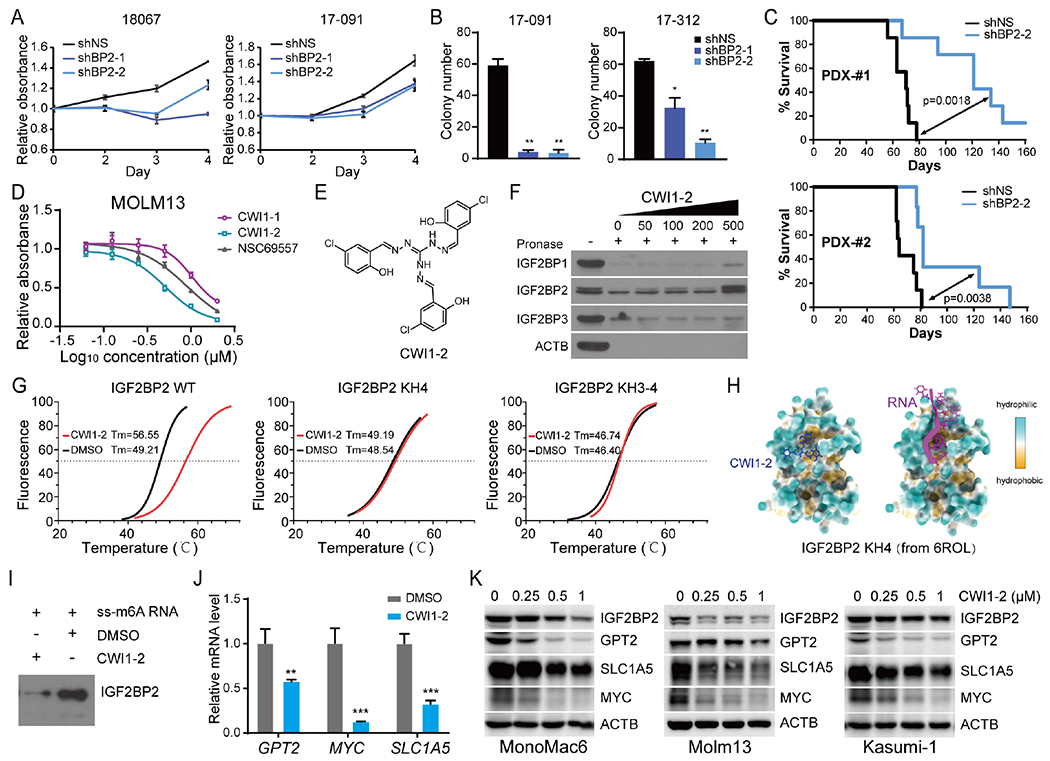
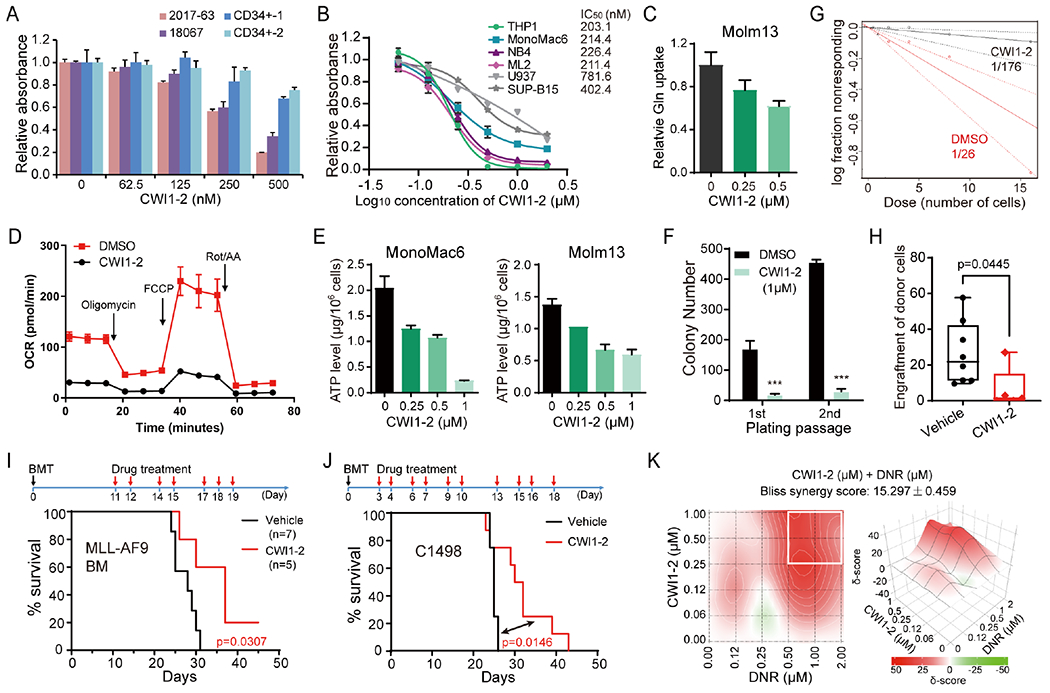
N6-Methyladenosine (m6A) modification and its modulators play critical roles and show promise as therapeutic targets in human cancers, including acute myeloid leukemia (AML). IGF2BP2 was recently reported as an m6A binding protein that enhances mRNA stability and translation. However, its function in AML remains largely elusive. Here we report the oncogenic role and the therapeutic targeting of IGF2BP2 in AML. High expression of IGF2BP2 is observed in AML and associates with unfavorable prognosis. IGF2BP2 promotes AML development and self-renewal of leukemia stem/initiation cells by regulating expression of critical targets (e.g., MYC, GPT2, and SLC1A5) in the glutamine metabolism pathways in an m6A-dependent manner. Inhibiting IGF2BP2 with our recently identified small-molecule compound (CWI1-2) shows promising anti-leukemia effects in vitro and in vivo. Collectively, our results reveal a role of IGF2BP2 and m6A modification in amino acid metabolism and highlight the potential of targeting IGF2BP2 as a promising therapeutic strategy in AML.

Keywords: GPT2; IGF2BP2; MYC; SLC1A5; acute myeloid leukemia; glutamine metabolism; leukemia stem cells; m(6)A modification; mitochondria oxygen consumption; targeted therapy.


Conflict of interest statement

Declaration of interests A US patent (no. 17/794,922) has been filed, with J.C., H. Weng, H.H., D.H., Y.M., H.L., and X.D. as inventors. J.C. is a Scientific Advisor for Race Oncology.

Figures

Figure 1
Figure 1. Elevated IGF2BP2 level correlates with a poor prognosis in AML patients
(A) qPCR showing expression of IGF2BP2 in AML patients and healthy donors. (B) Normalized IGF2BP2 RNA level in AML patients with favorable and unfavorable risk from TCGA. (C) Kaplan–Meier survival analyses of AML patients based on their IGF2BP2 expression level. OSm, medium overall survival. nlow = 425, nhigh = 93. The X-tile software was used to determine the optimal cutoff values for predicting survival. (D) Western blotting using normal CB, BM or peripheral blood mononuclear cells (PBMC) from healthy control (blue) or AML patients (red). (E) Expression of IGF2BP2 in CD34+ and CD34− fractions from BM of healthy donors (NC) or AML patients as detected by microarray. (F) Flow cytometry analysis of IGF2BP2 expression based on the expression of CD34 in MNCs from AML patients or normal CB or BM. Mean fluorescence intensity (MFI) was compared between CD34 low (Lo) and high (Hi) populations. (G) Expression of IGF2BP2 in LSCs and non-LSCs from scRNA-seq data. (H) IGV tracks of ChIP-seq data in THP1 cells. (I) Relative expression of Igf2bp2 mRNA in mouse HSPCs transduced with empty vector (EV) or MLL-fusions. Data are represented as mean ± SD. See also Figure S1 and Table S1.
Figure 2
Figure 2. IGF2BP2 promotes AML initiation/development and maintenance as an m6A reader
(A) CFA using mouse HSPCs transduced with MSCVneo-MLL-AF9 (MA9) plus MSCV-PIG (EV), IGF2BP2-WT (WT), or IGF2BP2-KH3-4 (MUT) retroviruses. Colony numbers and photos of GFP-expressing colonies are shown. (B) CFA using HSPCs from Mettl14fl/fl-CREERT mice. 4-Hydroxytamoxifen (4-OHT, 1 μM) was added at the first round of plating to induce Mettl14 KO. OE, overexpression. (C) CFA using mouse HSPCs transduced with MA9 plus shRNA targeting Igf2bp2 or negative control (shNS). (D) Growth competition assays. MA9-transduced Igf2bp2fl/fl or Igf2bp2fl/wt HSPCs were infected with Cre-ERT2-IRES-GFP (Cre) or ERT2-IRES-GFP (EV) lentiviruses, followed by 4-OHT treatment. Percentages of GFP+ cells were measured by flow cytometry. (E) CFA using Igf2bp2fl/fl or Igf2bp2fl/wt HSPCs transduced with MA9 retrovirus and Cre or EV lentivirus. (F, G) Donor cell percentages (F) and WBCs (G) in PB of recipient mice 5 weeks after BMT using cells collected from first plating of CFA in (E). (H, I) Kaplan–Meier curves showing the effect of Igf2bp2 KO (H) or KD (I) on MA9-induced de novo leukemogenesis in lethally irradiated recipient mice. TAM, tamoxifen. (J) Wright–Giemsa staining of PB and BM, and hematoxylin and eosin (H&E) staining of liver (LV) and spleen (SP) of the primary BMT recipient mice at the end point. Bar= 20 μm (for PB and BM) or 200 μm (for SP and LV). (K) Kaplan–Meier curves showing the effect of IGF2BP2 overexpression on MA9-induced de novo leukemogenesis in lethally irradiated recipient mice. (L) WBC counts of mice from (K). (M) LDA using BM leukemia cells from BMT mice in (K). (N, O) CFA using BM cells from MA9 (N) or Flt3-ITD/NPM1-mut (O) leukemia mice. (P) CFA using Cre or EV transduced BM cells from Igf2bp2fl/fl MA9 EV leukemia mice. (Q) Kaplan–Meier curves showing the effect of IGF2BP2 KD on C1498 induced AML onset and progression in recipient mice. Data are represented as mean ± SD. *p < 0.05; **p < 0.01; ***p < 0.001; t test. See also Figure S2.
Figure 3
Figure 3. IGF2BP2 regulates glutamine uptake and metabolism in AML cells as an m6A reader
(A) Viable cell counting of AML cell lines with or without IGF2BP2 KD. (B, C) Flow cytometric analyses of differentiated (CD11b+ or CD14+, B) and apoptotic (Annexin V+, C) cells after IGF2BP2 KD. (D) Viable cell counting of AML cells lentivirally transduced with WT or MUT IGF2BP2 or empty vector (EV). (E) Viable cell counting of MonoMac6 cells transduced with shRNA (shBP2-3) targeting 3’ UTR of IGF2BP2 plus EV, WT, or MUT IGF2BP2-overexpression vector. (F) Venn diagram showing overlapping of significantly (FC<0.667, p<0.0.5) downregulated genes in MonoMac6 cells transduced with different shRNAs targeting IGF2BP2. Information regarding existence of m6A signal or not in MonoMac6 cells (GSE97408) in each transcript was included for analysis. (G) Bubble diagram showing GO enrichment of the 157 candidate targets of IGF2BP2 in (F). (H) Bubble diagram showing enrichment of metabolic pathways by the metabolites with reduced level after IGF2BP2 KD in Molm13 cells. (I, J) Heatmap showing levels of representative metabolites after KD of IGF2BP2 (I), METTL3, or METTL14 (J) in indicated AML cells. (K) Total levels and isotopologue distribution (M+x+y; x, numbers of 13C; y, numbers of 15N) of TCA cycle intermediates and indicated amino acids measured by LC-MS in Molm13 cells transduced with IGF2BP2 shRNAs or shNS and grown in media containing 13C5;15N2-glutamine. (L) Effect of IGF2BP2 KD on glutamine uptake. (M, N) OCR (M) and ATP level (N) changes in AML cells upon IGF2BP2 KD. (O) Heatmap showing levels of representative metabolites in the TCA cycle in IGF2BP2 KD MonoMac6 cells rescued with WT or MUT IGF2BP2. (P, Q) Glutamine uptake (P) and ATP levels (Q) in IGF2BP2 KD cells rescued with WT or MUT IGF2BP2. Data are represented as mean ± SD. **p < 0.01; ***p < 0.001; n.s., not significant; t test. See also Figure S3.
Figure 4
Figure 4. MYC, GPT2, and SLC1A5 are direct targets of IGF2BP2
(A, B) Western blot showing expression change of MYC, GPT2, and SLC1A5 after KD of IGF2BP2, METTL3, or METTL14 (A), or overexpression of HA-tagged wildtype (HA-WT) or KH3-4 mutated (HA-MUT) IGF2BP2 (B). Band intensity in (B) was quantified by ImageJ2. (C, D) mRNA (C) and protein (D) levels of MYC, GPT2, and SLC1A5 in IGF2BP2 KD cells rescued with WT or MUT IGF2BP2. (E) IGV tracks showing the m6A distribution in indicated transcripts in MonoMac6 cells. Red rectangles depict high-confidence m6A regions for RIP-qPCR validation. (F) Evaluation of relative m6A abundance changes at annotated specific loci in MonoMac6 cells by utilizing Bst DNA polymerase-mediated cDNA extension and qPCR assays. (G) RIP assays using IGF2BP2 antibody were followed by qPCR in METTL14 KD or control MonoMac6 cells. (H) RIP assays using HA antibody were followed by qPCR in U937 cells with ectopically expressed WT or MUT IGF2BP2. (I) RNA pulldown assays using recombinant WT, KH3-4, or KH4 mutated IGF2BP2 protein with m6A-modified RNA oligos corresponding to IGF2BP2 binding sites in MYC, GPT2, and SLC1A5 mRNAs. (J) The mRNA half-life (t1/2) of target genes in MonoMac6 cells with KD of IGF2BP2 or METTL14. (K) Polysome fractionation of MonoMac6 cell lysates (top left) and subsequent qPCR assays. Actb mRNA was used as a reference in qPCR. (L) Cumulative frequency of global translation efficiency (TE) changes upon IGF2BP2 KD in MonoMac6 cells. (M) Relative abundance of MYC, GPT2, and SLC1A5 mRNA, ribosome protected fragment (RPF), and RFP/mRNA in control (shNS) and IGF2BP2 KD MonoMac6 cells from Ribo-seq. (N) RIP assays using eIF4E antibody were followed by qPCR in IGF2BP2 KD or control Molm13 cells. Data are represented as mean ± SD. *, p < 0.05; **, p < 0.01; ***, p < 0.001. t test. See also Figure S4.
Figure 5
Figure 5. MYC, GPT2, and SLC1A5 are functionally important targets of IGF2BP2 in AML cells
(A, B) Effects of target genes KD on OCR (A) and ATP levels (B) in AML cells. (C-E) Effects of the depletion of target genes on cell growth (C), differentiation (D), and apoptosis (E) in AML cells. (F) Effect of the depletion of Gpt2, Slc1a5 or Myc on the colony-forming/replating capacity of mouse HSPCs immortalized by MA9. (G) CFA using BM cells fromMA9 leukemic mice. (H) In vitro LDA. Logarithmic plots showing the percentage of nonresponding wells at different doses of mouse HSPCs cotransduced with MA9 and shNS or shRNAs targeting Gpt2, Slc1a5, or Myc. Nonresponding wells are wells without colonies. (I) MonoMac6 cells were transduced with shNS or IGF2BP2-sh1, and with or without lentiviruses encoding GPT2, SLC1A5, or MYC alone or in combination. Cells were seeded for MTT assays after puromycin selection, and the absorbance was measured at day 3. (J, K) Flow cytometry analyses showing the rescue effect of overexpression of individual target genes alone or in combination on apoptosis (J) and differentiation (K) of MonoMac6 cells induced by IGF2BP2 KD. (L) OCR in MonoMac6 cells with indicated treatment. (M) Proposed working model of IGF2BP2 in regulating glutamine metabolism in an m6A-dependent manner. Data are represented as mean ± SD. n.s., not significant; *p < 0.05; **p < 0.01; ***p < 0.001; t test. See also Figure S5.
Figure 6
Figure 6. Identification of CWI1-2 as an IGF2BP2 inhibitor
(A, B) MTT assays (A) and CFA (B) of patient-derived AML cells with or without IGF2BP2 KD. (C) Kaplan-Meier survival curves showing effect of IGF2BP2 KD on leukemia-inducing capacity of patient-derived AML cells in NRGS immunodeficient mice. (D) MTT assays at 48 hours after drug treatment. (E) Structure of the compound CWI1-2. (F) DARTS assays with Molm13 cell lysates in the presence of indicated concentration of CWI1-2. (G) Boltzmann fitting curves of the cell-free thermal shift assay showing binding of CWI1-2 (12 μM) with fluorescence-labeled recombinant IGF2BP2 proteins as indicated. (H) Docking model of CWI1-2 (left) and RNA (right) on KH4 of IGF2BP2 based on the 6ROL structure from the Protein Data Bank. (I) RNA pulldown assays. (J) qPCR showing effect of CWI1-2 (0.5 μM, 24 hours) treatment on expression of MYC, GPT2, and SLC1A5 in MonoMac6 cells. 18S rRNA was used as a reference. (K) Western blot showing effect of CWI1-2 on the protein level of IGF2BP2 targets in AML cells. Data are represented as mean ± SD. **p < 0.01; ***p < 0.001; t test. See also Figure S6.
Figure 7
Figure 7. CWI1-2 exhibits potent anti-leukemia efficacy in vitro and in vivo
(A) MTT assays of patient-derived AML cells or CD34+ CB cells from healthy controls in the presence of CWI1-2. (B) MTT assays and the IC50 values of CWI1-2 in leukemia cell lines after 48 hours of treatment. (C-E) AML cell lines were treated with indicated concentration of CWI1-2 for 24 hours and subjected to the examination of glutamine uptake (C), OCR (D), and ATP levels (E). (F) Effect of CWI1-2 on the colony-forming/replating capacity of MA9-immortalized mouse HSPCs. (G) The in vitro LDA using MA9-immortalized mouse HSPCs. (H) Engraftment of donor cells in the PB of recipient mice after transplanting with BM cells from MA9-induced leukemic mice and subsequent i.v. injection of CWI1-2 or vehicle control. (I) Kaplan-Meier survival curves of recipient mice in (H). (J) Kaplan-Meier survival curves of mice transplanted with C1498 cells and treated with CWI1-2 or vehicle control. Days of BMT and drug treatment were shown in the upper panels in (I) and (J), with black arrows indicating BMT while red arrows indicating drug treatment. (K) Synergistic effect of CWI1-2 with DNR on inhibition of the survival/growth of C1498 cells as determined by the Bliss independent model. Drug combinations with the strongest synergistic effects are outlined with white squares. δ-score represents the percentage of response beyond expectation due to drug interactions. Data are represented as mean ± SD. ***p < 0.001; t test. See also Figure S7.

Similar articles

Cited by

References

    1. Shi H Wei J He C Where, When, and How: Context-Dependent Functions of RNA Methylation Writers, Readers, and Erasers. Mol Cell 2019; 74: 640–650. - PMC - PubMed
    1. Yang Y Hsu PJ Chen YS Yang YG Dynamic transcriptomic m(6)A decoration: writers, erasers, readers and functions in RNA metabolism. Cell Res 2018; 28: 616–624. - PMC - PubMed
    1. Deng X Su R Weng H Huang H Li Z Chen J RNA N(6)-methyladenosine modification in cancers: current status and perspectives. Cell Res 2018; 28: 507–517. - PMC - PubMed
    1. Huang H Weng H Chen J m(6)A Modification in Coding and Non-coding RNAs: Roles and Therapeutic Implications in Cancer. Cancer Cell 2020; 37: 270–288. - PMC - PubMed
    1. Liu J Yue Y Han D Wang X Fu Y Zhang L Jia G Yu M Lu Z Deng X et al. A METTL3-METTL14 complex mediates mammalian nuclear RNA N6-adenosine methylation. Nat Chem Biol 2014; 10: 93–95. - PMC - PubMed

Publication types

MeSH terms