

Review
doi: 10.1016/S2468-2667(22)00197-9.
Epub 2022 Oct 26.
The 2022 Europe report of the Lancet Countdown on health and climate change: towards a climate resilient future
Affiliations
- PMID: 36306805
- PMCID: PMC9597587
- DOI: 10.1016/S2468-2667(22)00197-9
Item in Clipboard
Review
The 2022 Europe report of the Lancet Countdown on health and climate change: towards a climate resilient future
Lancet Public Health.
2022 Nov.
Erratum in
-
Correction to Lancet Public Health 2022; 7: e942-65.Lancet Public Health. 2022 Dec;7(12):e993. doi: 10.1016/S2468-2667(22)00287-0. Epub 2022 Nov 3. Lancet Public Health. 2022. PMID: 36335979 Free PMC article. No abstract available.
No abstract available
Conflict of interest statement
Declaration of interests VK and OS are staff members of the WHO Regional Office for Europe. The authors alone are responsible for the views expressed in this publication and they do not necessarily represent the decisions or policies of the World Health Organization. The designations employed and the presentation of the material in this publication do not imply the expression of any opinion whatsoever on the part of WHO concerning the legal status of any country, territory, city or area or of its authorities, or concerning the delimitation of its frontiers or boundaries. Dotted and dashed lines on maps represent approximate border lines for which there may not yet be full agreement. All other authors declare no competing interests.
Figures
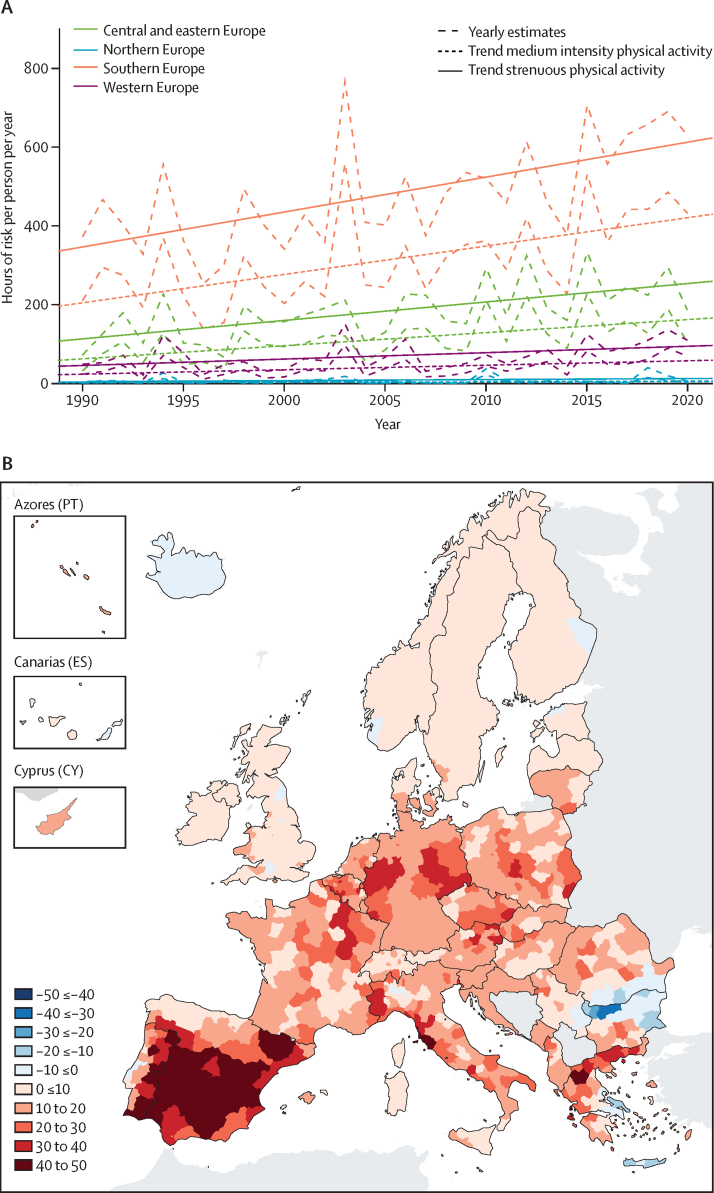
Heat and human health in Europe (A) Hours of risk per person per year (1990–2020) with 95% confidence intervals for physical-activity-related heat stress per European region, for activities of medium and high intensity. (B) Trends in heat related mortality incidence (annual death per million per decade) in Europe for the general population (2000–20).
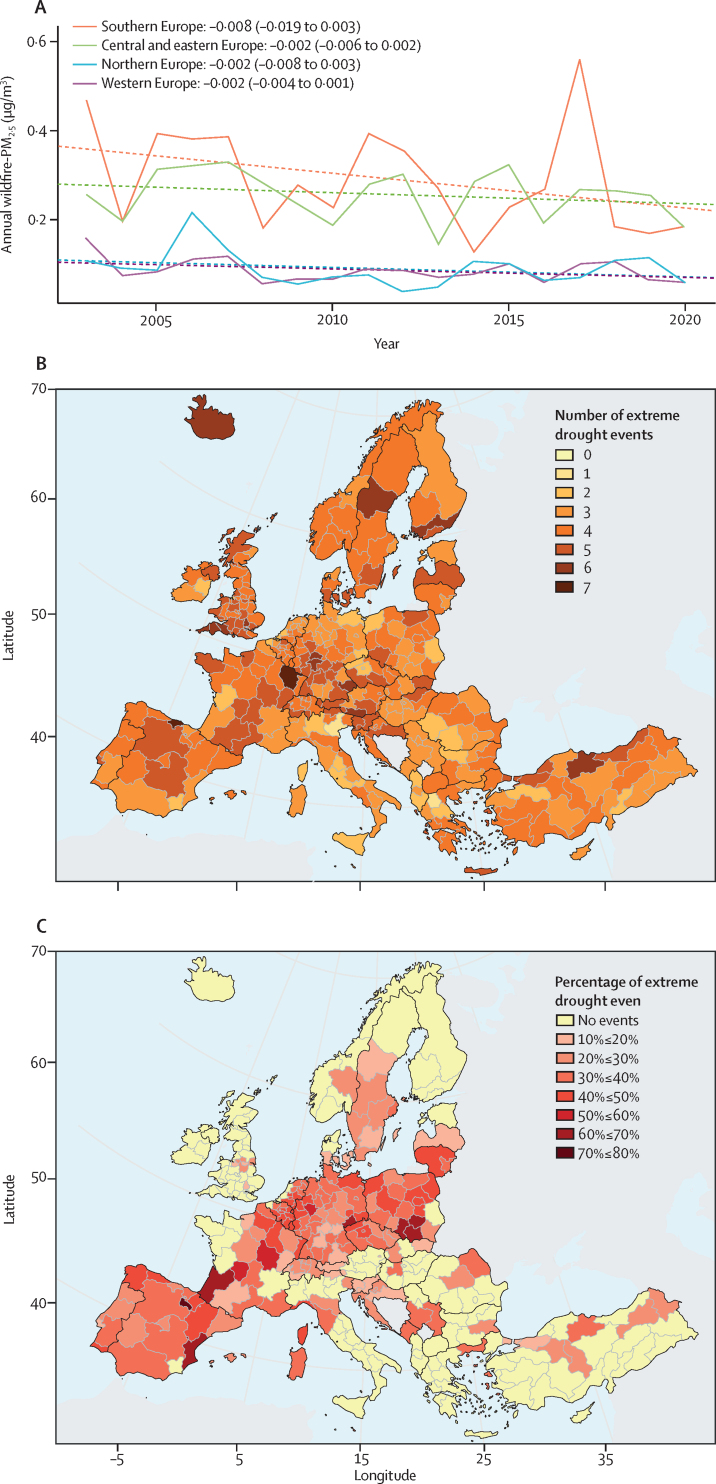
Extreme climatic events and related impacts in Europe (A) Annual average population-weighted wildfire-PM2·5 exposure by European region (bold) and linear trend (dashed) during the period 2003–20. Slope coefficients (95% CI) corresponding to the linear trend (wildfire-PM2·5 exposure change per 1-year increase) are shown as text. The negative trend lines are not statistically significant (appendix pp 28–35). (B) Total number of extreme drought events (SPEI6 ≤–1·6) during the extended summer period (April to September) in Europe between 1951 and 2020. (C) Percentage of extreme drought events (observed between 1951 and 2020) that occurred in the most recent 10 years (2011–20). SPEI6= Standardised Precipitation-Evapotranspiration Index 6.
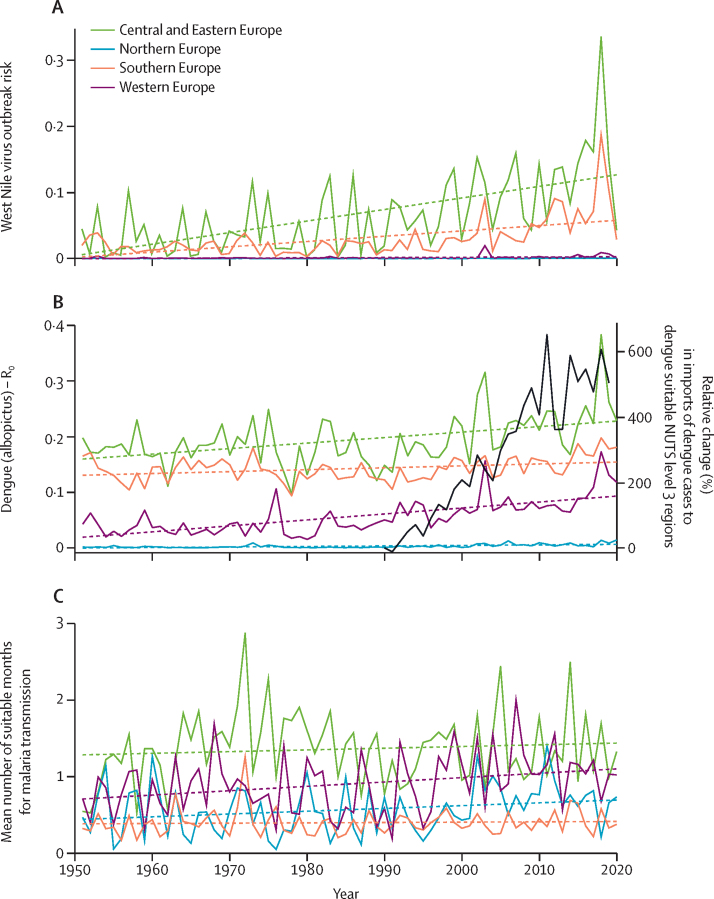
Climate suitability for West Nile virus, dengue, and malaria in Europe (A) Change in the estimated West Nile virus transmission risk probability between 1951 and 2020 in Europe. (B) R0 for dengue by European regions between 1951 and 2020. Black curve shows estimated relative change of yearly number of dengue case importations per NUTS level 3 region to transmission-suitable locations in Europe from dengue-endemic regions between 1990 and 2019. (C) Mean number of months suitable for Plasmodium vivax transmission between 1951 and 2020, grouped by European region. The number of suitable months was calculated as the number of months per year with precipitation more than 80 mm, average temperature between 14·5°C and 33°C, and relative humidity more than 60%, in land types highly suitable for Anopheles mosquitoes. Linear regression was used to estimate trends (A–C). R0=reproduction rate.
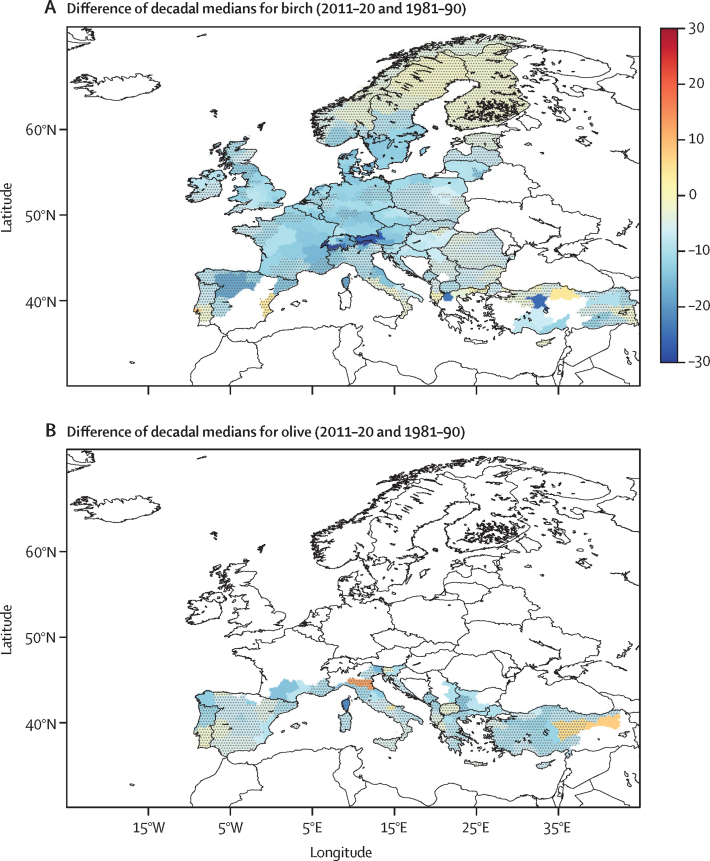
Difference of decadal medians (days) in the start of clinically relevant pollen seasons in Europe Change of decadal medians in start of clinically relevant pollen season (days) for (A) birch and (B) olive in Europe at NUTS level 2, comparing 2011–20 with 1981–90. Dot-shaded areas have statistically insignificant trends (p value >0·1). White areas (without shade) had clinically relevant seasons that occurred less than 5 times between 1981 and 1990 or 2011 and 2020.
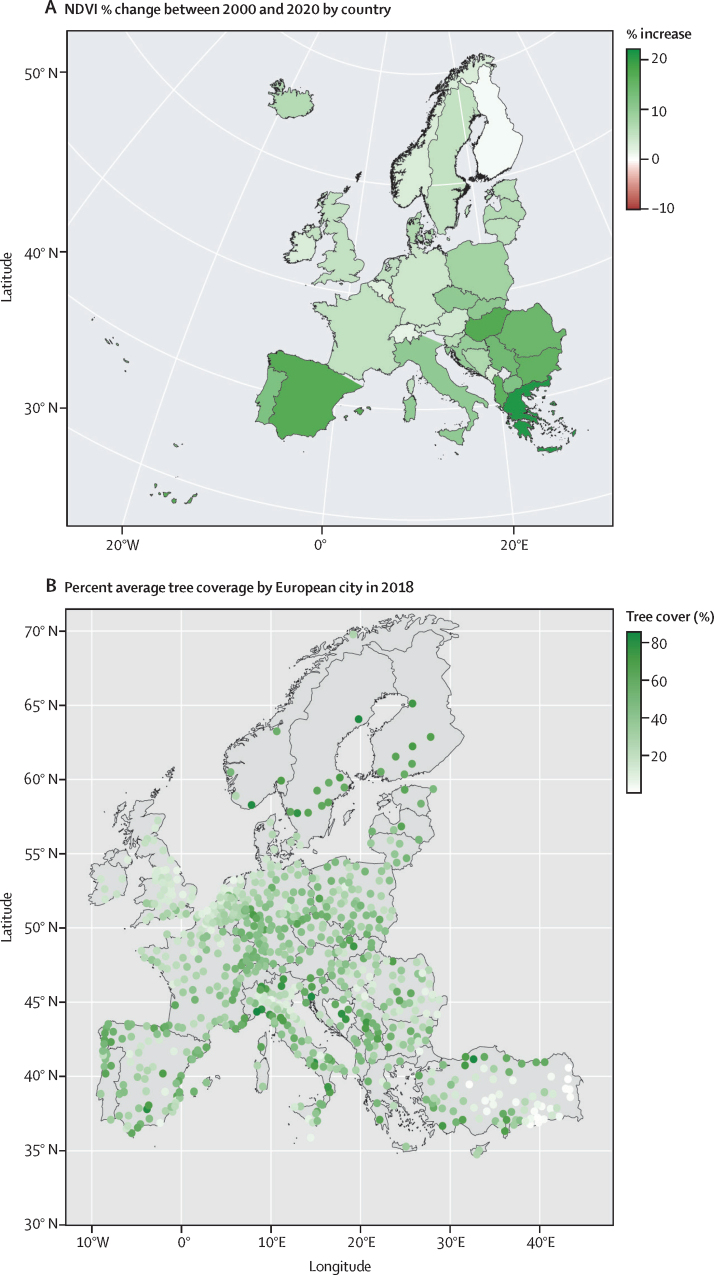
Green space exposure in Europe (A) Change of the NDVI in Europe by country comparing 2020 with 2000. (B) Percent average tree coverage by European city in 2018. NDVI=normalised difference vegetation index.
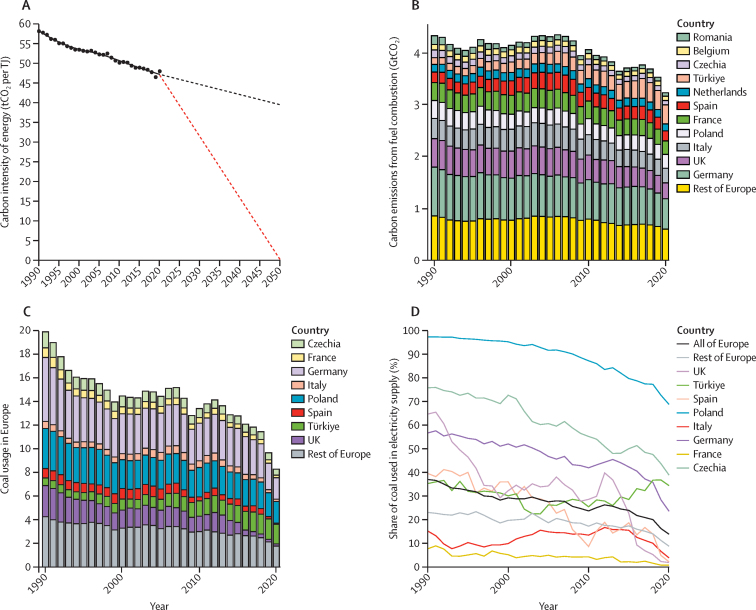
Carbon intensity of the energy system and coal phase-out in Europe (A) Carbon intensity of total energy supply in Europe from 1990 to 2020. Red dashed line shows the rate of reduction required to meet net-zero by 2050. Black dashed lines show extrapolation of current rate of reduction. (B) Carbon emissions from the combustion of fuels from 1990 to 2020 for countries with emissions greater than 0·1 GtCO2 per year. (C) Coal use in Europe from 1990 to 2020 by country. (D) Share of electricity (%) generated by coal combustion in Europe from 1990 to 2020 by country.
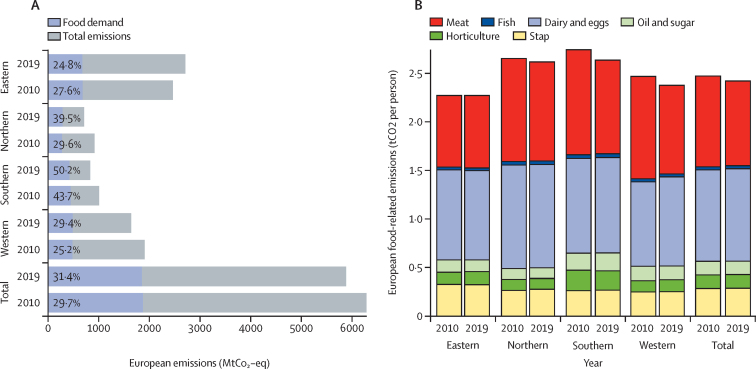
Life cycle emissions from food demand in Europe (A) Greenhouse gas emissions from food demand as a proportion of total territorial emissions (%) by European region in absolute terms (2010 and 2019). (B) Food-related CO2 emissions per person by European region and food group (2010 and 2019).
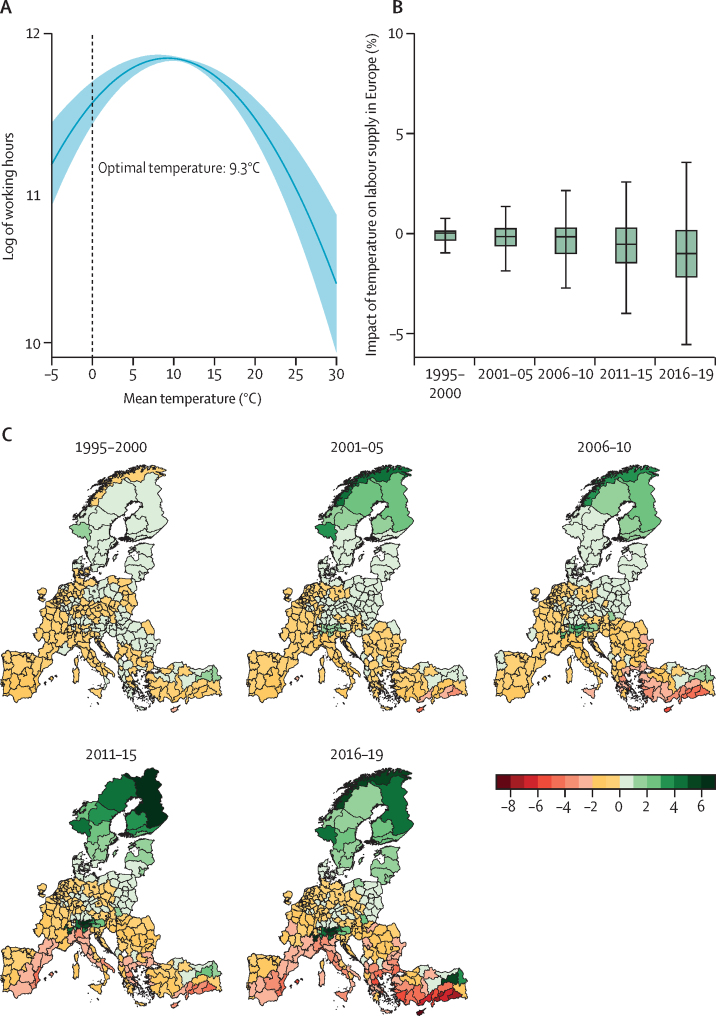
Labour supply and temperature in Europe (A) Non-linear (quadratic) relationship between mean temperature and log of number of working hours (blue line) from 1995 to 2019 with 95% confidence interval (light blue shading). The estimates are generated from a fixed-effects regression with the log of the number of working hours and ERA5-Land temperature data at the NUTS 2 level. The specification also includes precipitation and its second-degree polynomial, and NUTS level 2 and year fixed-effects. The standard errors are clustered at the country level. (B) Percentage change in the number of working hours (weighted by total number of working hours in 2019) due to change in temperature compared with the baseline period of 1965–94. (C) Change in high-exposure labour supply (%) in Europe due to temperature change; counterfactual analysis for each time period compared with the long-term mean of 1965–94. ERA5-Land=European Centre for Medium Range Weather Forecasts. NUTS 2=Nomenclature of Territorial Units for Statistics level 2.
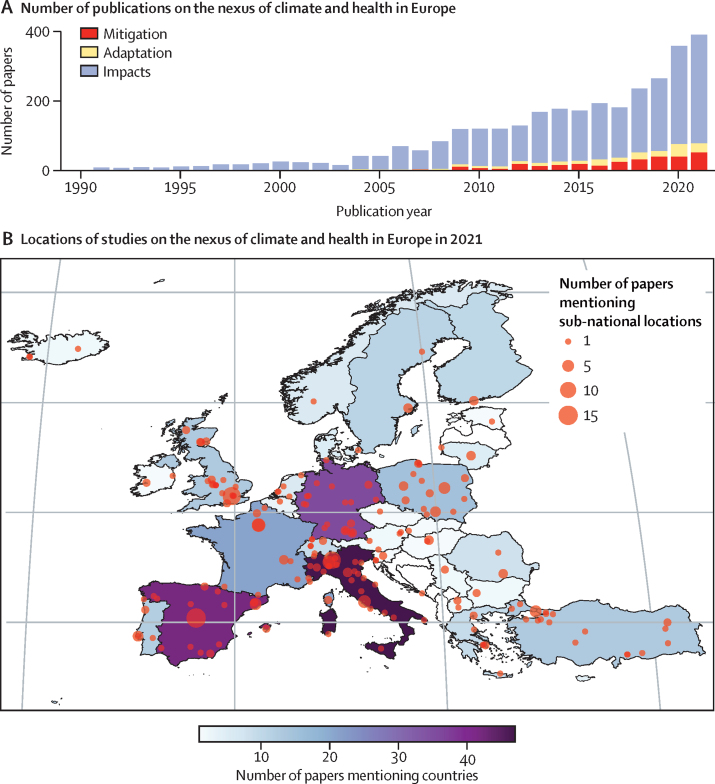
Number of academic publications per year on health and climate change, and locations of the study focus in Europe (A) Number of academic publications on health and climate change (mitigation, adaptation, impact) in Europe during the period 1990–2021. (B) Locations of study focus on the nexus of climate and health in Europe in 2021. Country shading indicates the number of academic publications on a specific country. Blue points refer to publications mentioning subnational locations (eg, cities), with point size indicating the number of publications.
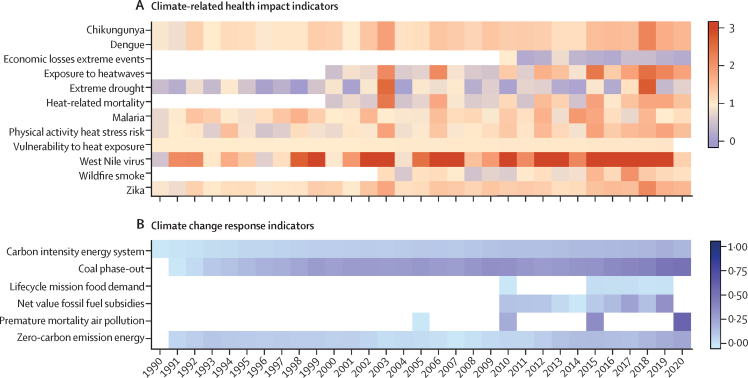
Overview of standardised impacts and responses tracked in the 2022 European report of the Lancet Countdown (A) Climate related health impact indicators, with higher values corresponding to worsening of the indicator tracked. (B) Climate change response indicators, with higher values corresponding to improvement in the indicator tracked (appendix p 198). Each indicator has been standardised to generate a yearly score. Standardisation was based on the yearly value divided by the baseline value for climate-related health impact indicators (A) and the yearly value divided by the worst case value (or target value) minus the worst case value for the climate change response indicators (B).
References
-
- World Population Review Best healthcare in the world. 2022. https://worldpopulationreview.com/country-rankings/best-healthcare-in-th...
-
- World Bank Life expectancy at birth, total (years)—European Union. https://data.worldbank.org/indicator/SP.DYN.LE00.IN?locations=EU Accessed April 10, 2022.
-
- Romanello M, van Daalen K, Anto JM, et al. Tracking progress on health and climate change in Europe. Lancet Public Health. 2021;6:e858–e865. - PubMed
Publication types
MeSH terms
Grants and funding
LinkOut - more resources
Full Text Sources
Medical
