

The 2022 report of the Lancet Countdown on health and climate change: health at the mercy of fossil fuels
- PMID: 36306815
- PMCID: PMC7616806
- DOI: 10.1016/S0140-6736(22)01540-9
The 2022 report of the Lancet Countdown on health and climate change: health at the mercy of fossil fuels
Erratum in
-
Department of Error.Lancet. 2022 Nov 12;400(10364):1680. doi: 10.1016/S0140-6736(22)02169-9. Epub 2022 Nov 3. Lancet. 2022. PMID: 36335959 Free PMC article. No abstract available.
-
Department of Error.Lancet. 2022 Nov 19;400(10365):1766. doi: 10.1016/S0140-6736(22)02314-5. Lancet. 2022. PMID: 36403619 Free PMC article. No abstract available.
Abstract
The 2022 report of the Lancet Countdown is published as the world confronts profound and concurrent systemic shocks. Countries and health systems continue to contend with the health, social, and economic impacts of the COVID-19 pandemic, while Russia’s invasion of Ukraine and a persistent fossil fuel overdependence has pushed the world into global energy and cost-of-living crises. As these crises unfold, climate change escalates unabated. Its worsening impacts are increasingly affecting the foundations of human health and wellbeing, exacerbating the vulnerability of the world’s populations to concurrent health threats.
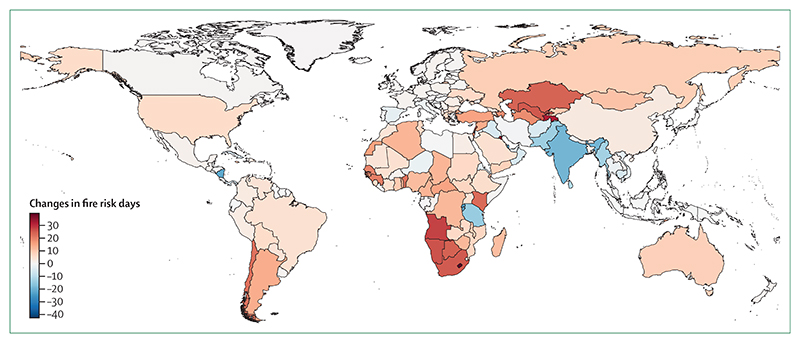
During 2021 and 2022, extreme weather events caused devastation across every continent, adding further pressure to health services already grappling with the impacts of the COVID-19 pandemic. Floods in Australia, Brazil, China, western Europe, Malaysia, Pakistan, South Africa, and South Sudan caused thousands of deaths, displaced hundreds of thousands of people, and caused billions of dollars in economic losses. Wildfires caused devastation in Canada, the USA, Greece, Algeria, Italy, Spain, and Türkiye, and record temperatures were recorded in many countries, including Australia, Canada, India, Italy, Oman, Türkiye, Pakistan, and the UK. With advancements in the science of detection and attribution studies, the influence of climate change over many events has now been quantified.
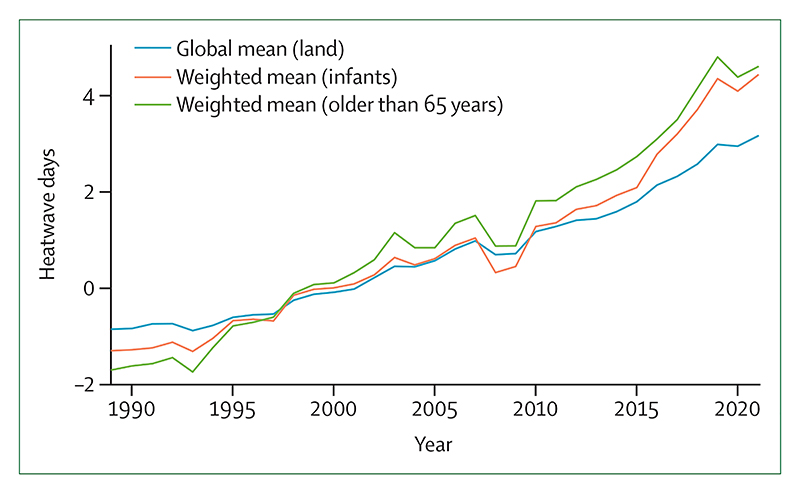
Because of the rapidly increasing temperatures, vulnerable populations (adults older than 65 years, and children younger than one year of age) were exposed to 3·7 billion more heatwave days in 2021 than annually in 1986–2005 (indicator 1.1.2), and heat-related deaths increased by 68% between 2000–04 and 2017–21 (indicator 1.1.5), a death toll that was significantly exacerbated by the confluence of the COVID-19 pandemic.
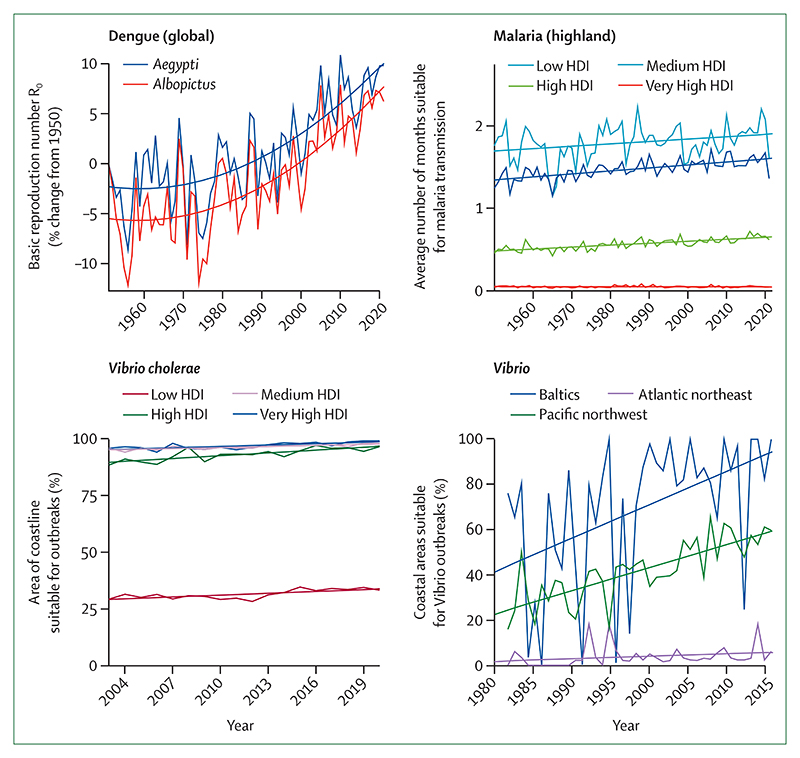
Simultaneously, the changing climate is affecting the spread of infectious diseases, putting populations at higher risk of emerging diseases and co-epidemics. Coastal waters are becoming more suitable for the transmission of Vibrio pathogens; the number of months suitable for malaria transmission increased by 31·3% in the highland areas of the Americas and 13·8% in the highland areas of Africa from 1951–60 to 2012–21, and the likelihood of dengue transmission rose by 12% in the same period (indicator 1.3.1). The coexistence of dengue outbreaks with the COVID-19 pandemic led to aggravated pressure on health systems, misdiagnosis, and difficulties in management of both diseases in many regions of South America, Asia, and Africa.
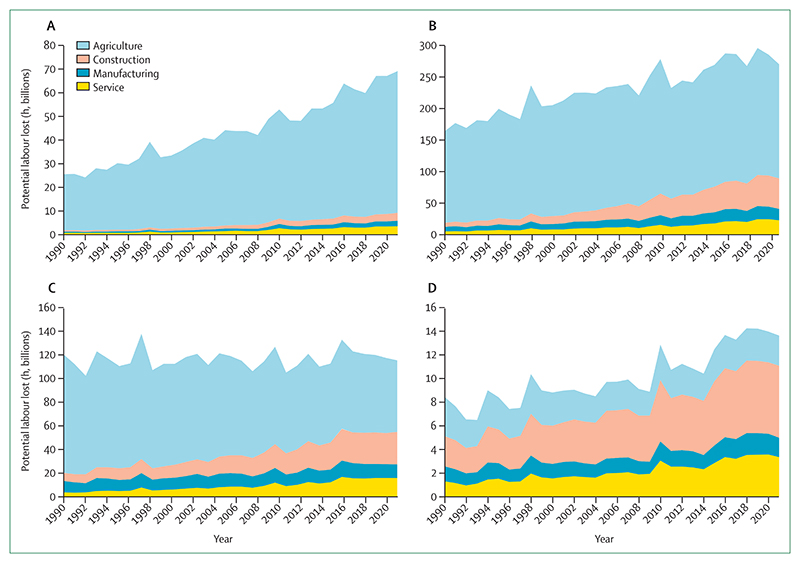
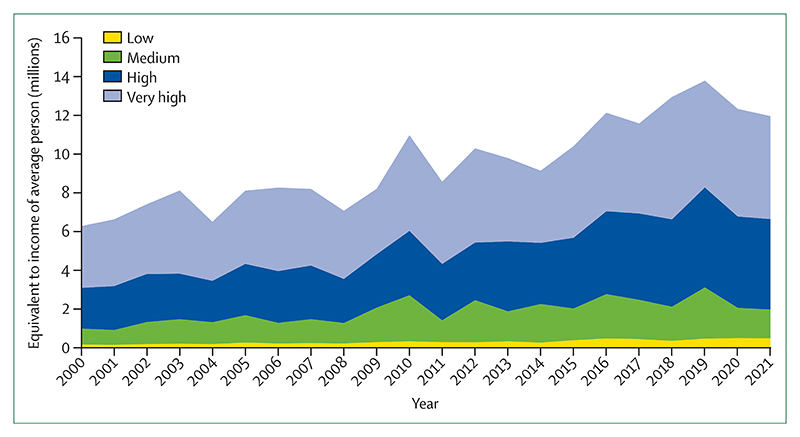
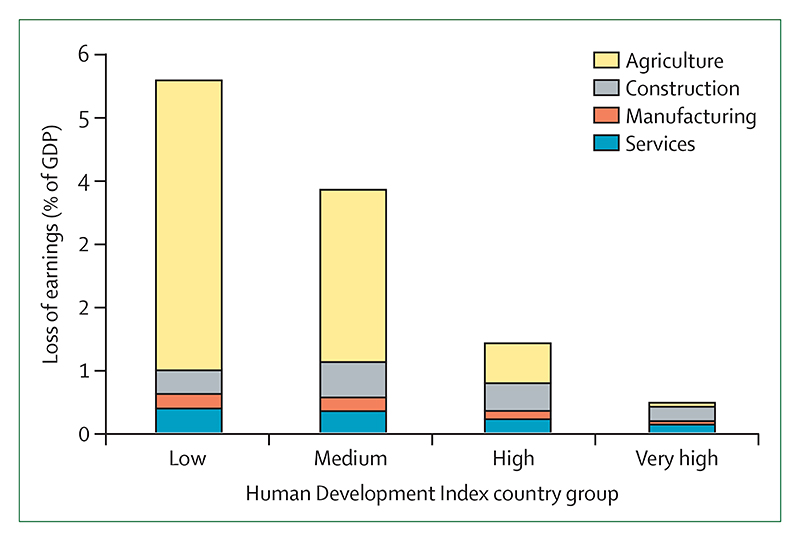
The economic losses associated with climate change impacts are also increasing pressure on families and economies already challenged with the synergistic effects of the COVID-19 pandemic and the international cost-of-living and energy crises, further undermining the socioeconomic determinants that good health depends on. Heat exposure led to 470 billion potential labour hours lost globally in 2021 (indicator 1.1.4), with potential income losses equivalent to 0·72% of the global economic output, increasing to 5·6% of the GDP in low Human Development Index (HDI) countries, where workers are most vulnerable to the effects of financial fluctuations (indicator 4.1.3). Meanwhile, extreme weather events caused damage worth US$253 billion in 2021, particularly burdening people in low HDI countries in which almost none of the losses were insured (indicator 4.1.1).
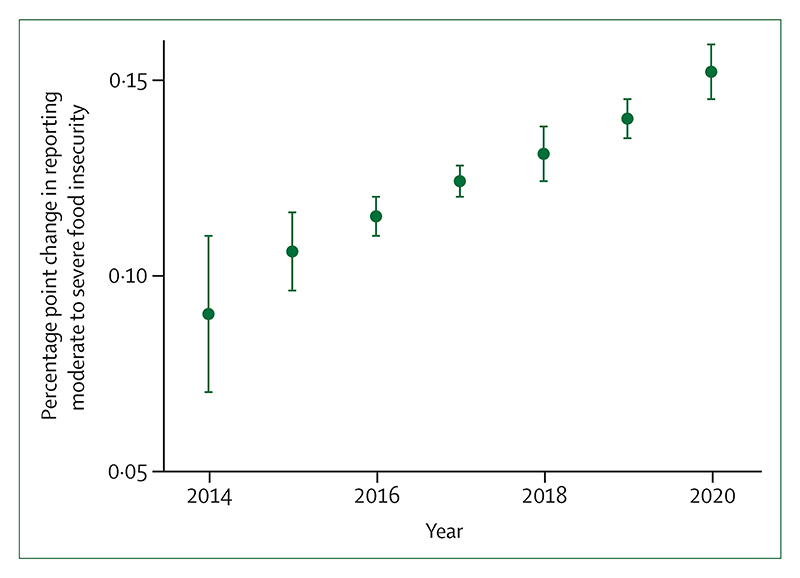
Through multiple and interconnected pathways, every dimension of food security is being affected by climate change, aggravating the impacts of other coexisting crises. The higher temperatures threaten crop yields directly, with the growth seasons of maize on average 9 days shorter in 2020, and the growth seasons of winter wheat and spring wheat 6 days shorter than for 1981–2010 globally (indicator 1.4). The threat to crop yields adds to the rising impact of extreme weather on supply chains, socioeconomic pressures, and the risk of infectious disease transmission, undermining food availability, access, stability, and utilisation. New analysis suggests that extreme heat was associated with 98 million more people reporting moderate to severe food insecurity in 2020 than annually in 1981–2010, in 103 countries analysed (indicator 1.4). The increasingly extreme weather worsens the stability of global food systems, acting in synergy with other concurrent crises to reverse progress towards hunger eradication. Indeed, the prevalence of undernourishment increased during the COVID-19 pandemic, and up to 161 million more people faced hunger during the COVID-19 pandemic in 2020 than in 2019. This situation is now worsened by Russia’s invasion of Ukraine and the energy and cost-of-living crises, with impacts on international agricultural production and supply chains threatening to result in 13 million additional people facing undernutrition in 2022.
A debilitated first line of defence: With the worsening health impacts of climate change compounding other coexisting crises, populations worldwide increasingly rely on health systems as their first line of defence. However, just as the need for healthcare rises, health systems worldwide are debilitated by the effects of the COVID-19 pandemic and the energy and cost-of-living crises. Urgent action is therefore needed to strengthen health-system resilience and to prevent a rapidly escalating loss of lives and to prevent suffering in a changing climate. However, only 48 (51%) of 95 countries reported having assessed their climate change adaptation needs (indicator 2.1.1) and, even after the profound impacts of COVID-19, only 60 (63%) countries reported a high to very high implementation status for health emergency management in 2021 (indicator 2.2.4).
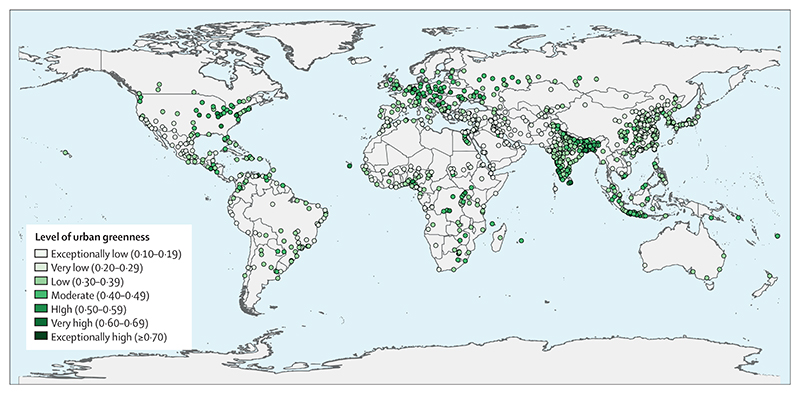
The scarcity of proactive adaptation is shown in the response to extreme heat. Despite the local cooling and overall health benefits of urban greenspaces, only 277 (27%) of 1038 global urban centres were at least moderately green in 2021 (indicator 2.2.3), and the number of households with air conditioning increased by 66% from 2000 to 2020, a maladaptive response that worsens the energy crisis and further increases urban heat, air pollution, and greenhouse gas emissions.
As converging crises further threaten the world’s life-supporting systems, rapid, decisive, and coherent intersectoral action is essential to protect human health from the hazards of the rapidly changing climate.
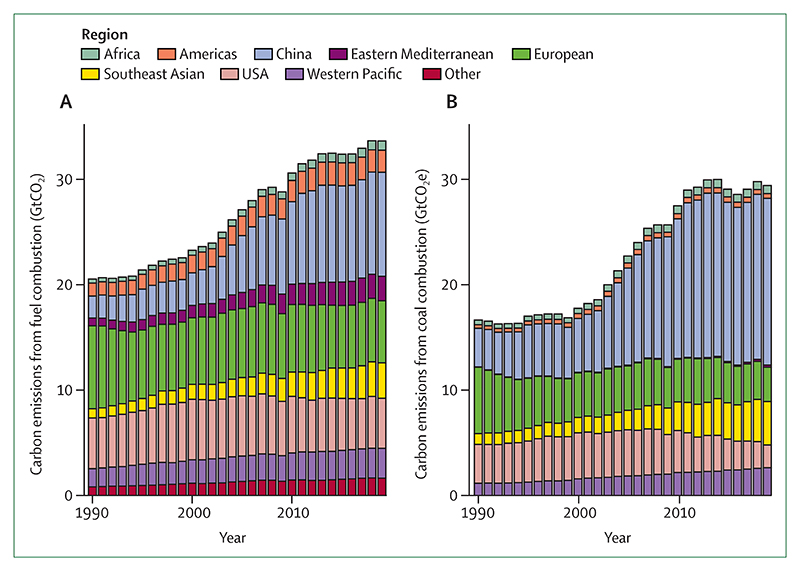
Health at the mercy of fossil fuels: The year 2022 marks the 30th anniversary of the signing of the UN Framework Convention on Climate Change, in which countries agreed to prevent dangerous anthropogenic climate change and its deleterious effects on human health and welfare. However, little meaningful action has since followed. The carbon intensity of the global energy system has decreased by less than 1% since the UNFCCC was established, and global electricity generation is still dominated by fossil fuels, with renewable energy contributing to only 8·2% of the global total (indicator 3.1). Simultaneously, the total energy demand has risen by 59%, increasing energy-related emissions to a historical high in 2021. Current policies put the world on track to a catastrophic 2·7°C increase by the end of the century. Even with the commitments that countries set in the Nationally Determined Contributions (NDCs) updated up until November 2021, global emissions could be 13·7% above 2010 levels by 2030—far from the 43% decrease from current levels required to meet Paris Agreement goals and keep temperatures within the limits of adaptation.
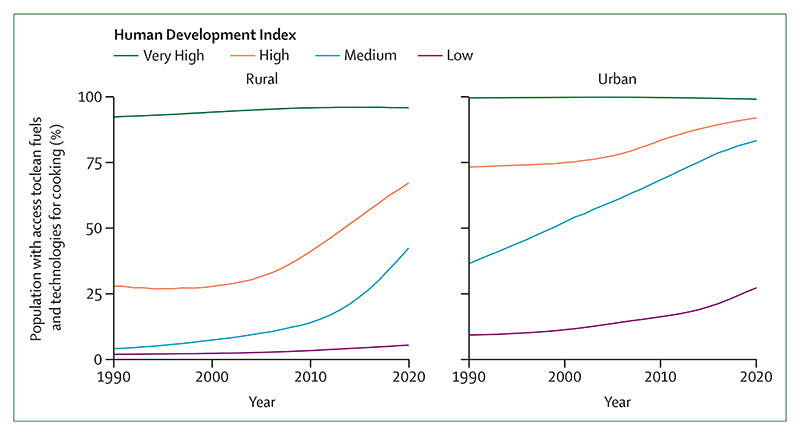
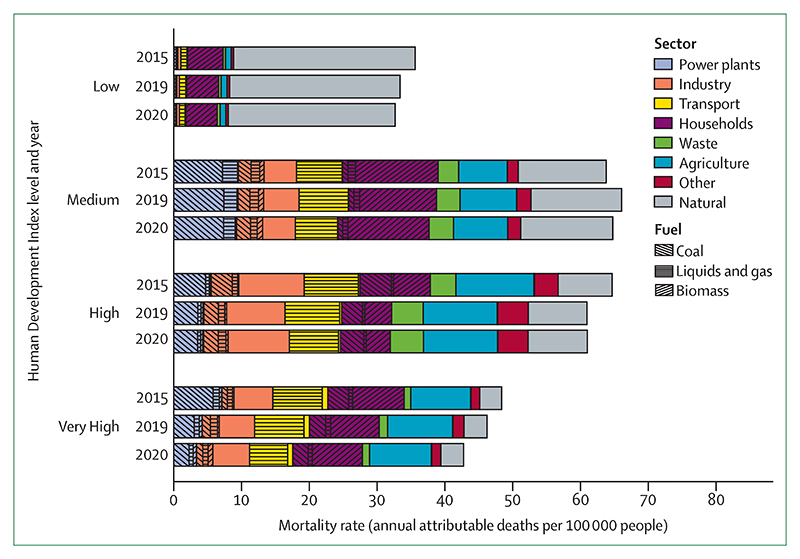
Fossil fuel dependence is not only undermining global health through increased climate change impacts, but also affects human health and wellbeing directly, through volatile and unpredictable fossil fuel markets, frail supply chains, and geopolitical conflicts. As a result, millions of people do not have access to the energy needed to keep their homes at healthy temperatures, preserve food and medication, and meet the seventh Sustainable Development Goal (to ensure access to affordable, reliable, sustainable, and modern energy for all). Without sufficient support, access to clean energy has been particularly slow in low HDI countries, and only 1·4% of their electricity came from modern renewables (mostly wind and solar power) in 2020 (indicator 3.1). An estimated 59% of healthcare facilities in low and middle-income countries still do not have access to the reliable electricity needed to provide basic care. Meanwhile, biomass accounts for as much as 31% of the energy consumed in the domestic sector globally, mostly from traditional sources—a proportion that increases to 96% in low HDI countries (indicator 3.2). The associated burden of disease is substantial, with the air in people’s homes exceeding WHO guidelines for safe concentrations of small particulate air pollution (PM2·5) in 2020 by 30-fold on average in the 62 countries assessed (indicator 3.2). After 6 years of improvement, the number of people without access to electricity increased in 2020 as a result of the socioeconomic pressures of the COVID-19 pandemic. The current energy and cost-of-living crises now threaten to reverse progress toward affordable, reliable, and sustainable energy, further undermining the socioeconomic determinants of health.
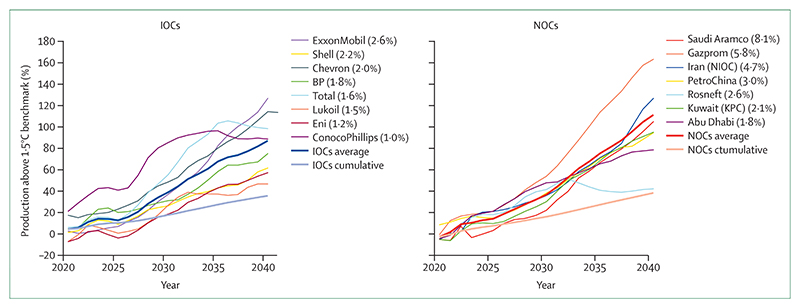
Simultaneously, oil and gas companies are registering record profits, while their production strategies continue to undermine people’s lives and wellbeing. An analysis of the production strategies of 15 of the world’s largest oil and gas companies, as of February 2022, revealed they exceed their share of emissions consistent with 1·5°C of global heating (indicator 4.2.6) by 37% in 2030 and 103% in 2040, continuing to undermine efforts to deliver a low carbon, healthy, liveable future. Aggravating this situation even further, governments continue to incentivise fossil fuel production and consumption: 69 (80%) of 86 countries reviewed had net-negative carbon prices (ie, provided a net subsidy to fossil fuels) for a net total of US$400 billion in 2019, allocating amounts often comparable with or even exceeding their total health budgets (indicator 4.2.4). Simultaneously, wealthier countries failed to meet their commitment of mobilising the considerably lower sum of $100 billion annually by 2020 as agreed at the 2009 Copenhagen Accord to support climate action in “developing countries”, and climate efforts are being undercut by a profound scarcity of funding (indicator 2.1.1). The impacts of climate change on global economies, together with the recession triggered by COVID-19 and worsened by geopolitical instability, could paradoxically further reduce the willingness of countries to allocate the funds needed to enable a just climate transition.
A health-centred response for a thriving future: The world is at a critical juncture. With countries facing concurrent crises, the implementation of long-term emissions-reduction policies risks being deflected or defeated by challenges wrongly perceived as more immediate. Addressing each of the concurrent crises in isolation risks alleviating one, while worsening another. Such a situation is emerging from the response to COVID-19, which has so far has not delivered the green recovery that the health community proposed, and, on the contrary, is aggravating climate change-related health risks. Less than one third of $3·11 trillion allocated to COVID-19 economic recovery is likely to reduce greenhouse gas emissions or air pollution, with the net effect likely to increase emissions. The COVID-19 pandemic affected climate action at the city level, and 239 (30%) of 798 cities reported that COVID-19 reduced financing available for climate action (indicator 2.1.3).
As countries search for alternatives to Russian oil and gas, many continue to favour the burning of fossil fuels, with some even turning back to coal. Shifts in global energy supplies threaten to increase fossil fuel production. Even if implemented as a temporary transition, these responses could reverse progress on air quality improvement, irreversibly push the world off track from meeting the commitments set out in the Paris Agreement, and guarantee a future of accelerated climate change that threatens human survival.
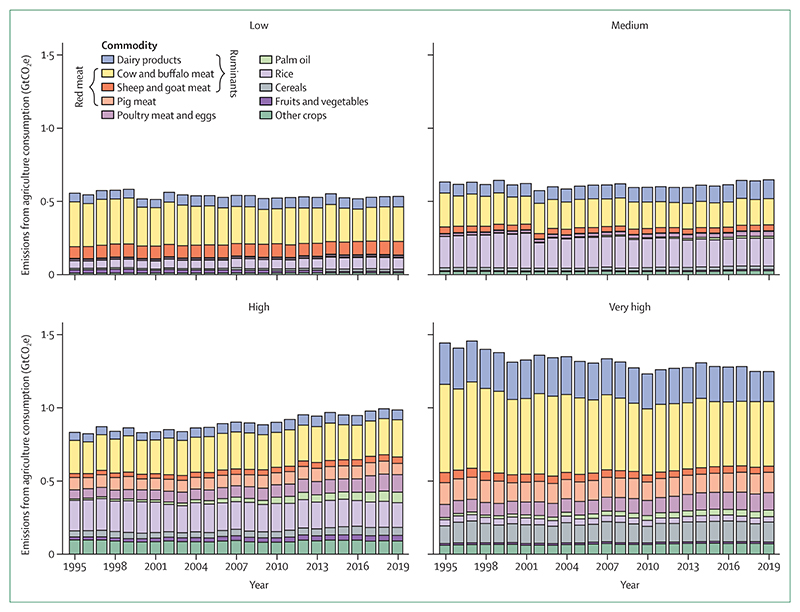
On the contrary, in this pivotal moment, a health-centred response to the current crises would still provide the opportunity for a low-carbon, resilient future, which not only avoids the health harms of accelerated climate change, but also delivers improved health and wellbeing through the associated co-benefits of climate action. Such response would see countries promptly shifting away from fossil fuels, reducing their dependence on fragile international oil and gas markets, and accelerating a just transition to clean energy sources. A health-centred response would reduce the likelihood of the most catastrophic climate change impacts, while improving energy security, creating an opportunity for economic recovery, and offering immediate health benefits. Improvements in air quality would help to prevent the 1·2 million deaths resulting from exposure to fossil fuel-derived ambient PM2·5 in 2020 alone (indicator 3.3), and a health-centred energy transition would enhance low-carbon travel and increase urban green spaces, promoting physical activity, and improving physical and mental health. In the food sector, an accelerated transition to balanced and more plant-based diets would not only help reduce the 55% of agricultural sector emissions coming from red meat and milk production (indicator 3.5.1), but also prevent up to 11·5 million diet-related deaths annually (indicator 3.5.2), and substantially reduce the risk of zoonotic diseases. These health-focused shifts would reduce the burden of communicable and non-communicable diseases, reducing the strain on overwhelmed health-care providers. Importantly, accelerating climate change adaptation would lead to more robust health systems, minimising the negative impacts of future infectious disease outbreaks and geopolitical conflicts, and restoring the first line of defence of global populations.
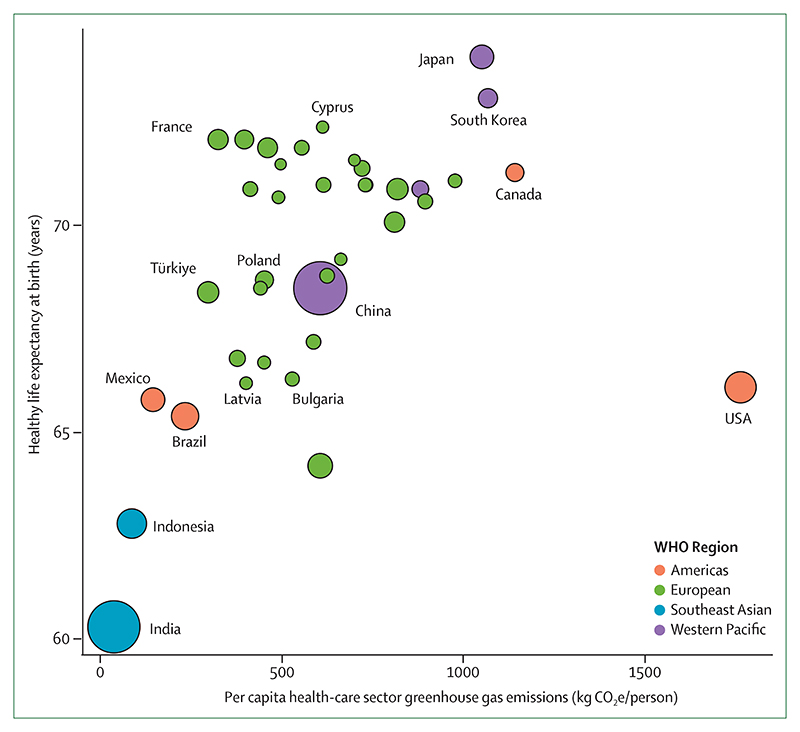
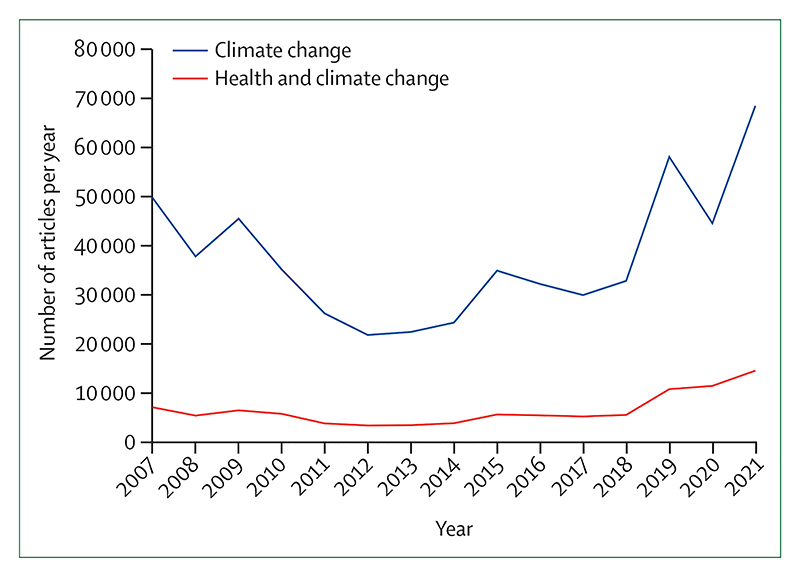
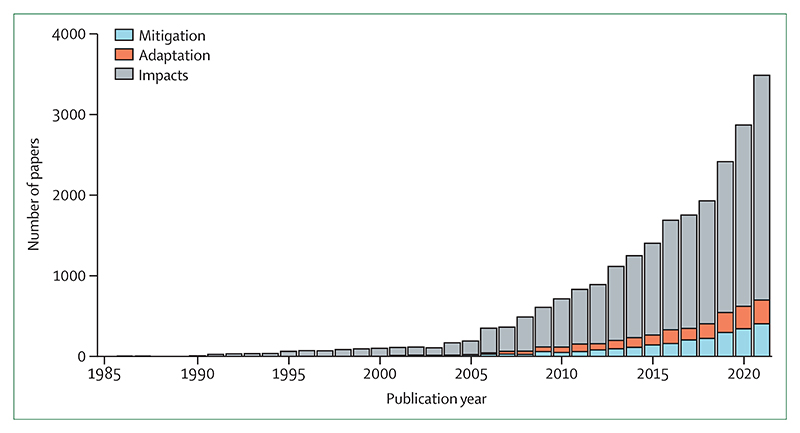
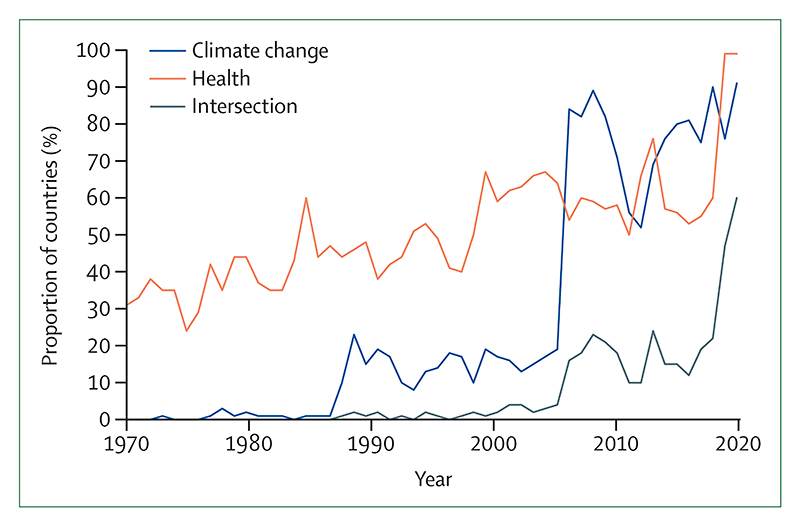
Emerging glimmers of hope: Despite decades of insufficient action, emerging, albeit few, signs of change provide some hope that a health-centred response might be starting to emerge. Individual engagement with the health dimensions of climate change, essential to drive and enable an accelerated response, increased from 2020 to 2021 (indicator 5.2), and coverage of health and climate change in the media reached a new record high in 2021, with a 27% increase from 2020 (indicator 5.1). This engagement is also reflected by country leaders, with a record 60% of 194 countries focusing their attention on the links between climate change and health in the 2021 UN General Debate, and with 86% of national updated or new NDCs making references to health (indicator 5.4). At the city level, local authorities are progressively identifying risks of climate change on the health of their populations (indicator 2.1.3), a first step to delivering a tailored response that strengthens local health systems. Although the health sector is responsible for 5·2% of all global emissions (indicator 3.6), it has shown impressive climate leadership, and 60 countries had committed to transitioning to climate-resilient and/or low-carbon or net-zero carbon health systems as part of the COP26 Health Programme, as of July, 2022.
Signs of change are also emerging in the energy sector. Although total clean energy generation remains grossly insufficient, record high levels were reached in 2020 (indicator 3.1). Zero-carbon sources accounted for 80% of investment in electricity generation in 2021 (indicator 4.2.1), and renewable energies have reached cost parity with fossil fuel energies. As some of the highest emitting countries attempt to cut their dependence on oil and gas in response to the war in Ukraine and soaring energy prices, many are focusing on increasing renewable energy generation, raising hopes for a health-centred response. However, increased awareness and commitments should be urgently translated into action for hope to turn into reality.
A call to action: After 30 years of UNFCCC negotiations, the Lancet Countdown indicators show that countries and companies continue to make choices that threaten the health and survival of people in every part of the world. As countries devise ways to recover from the coexisting crises, the evidence is unequivocal. At this critical juncture, an immediate, health-centred response can still secure a future in which world populations can not only survive, but thrive.
Conflict of interest statement
Declaration of interests CD was supported by the UK Natural Environment Research Council (NE/R010811/1) and the UK Natural Environment Research Council Independent Research Fellowship (NE/N01524X/1) and contributes to the Sustainable and Healthy Food Systems project supported by the Wellcome Trust (205200/Z/16/Z). MD was supported by the Wellcome Trust's Complex Urban Systems for Sustainability and Health (CUSSH) project (209387/Z/17/Z). YL was supported by the US National Aeronautics and Space Administration Applied Sciences Program (80NSSC21K0507). RL was supported by a Royal Society Dorothy Hodgkin Fellowship. MSo was supported by Horizon 2020 project EXHAUSTION (820655) and Academy of Finland HEATCOST (334798). SHG and JKWL were supported by Singapore's National Research Foundation, Singapore's Prime Minister's Office, under its Campus for Research Excellence and Technological Enterprise programme. IH was supported by the UK Research and Innovation (UKRI) Engineering and Physical Sciences Research Council Centre for Research in Energy Demand Solutions (EP/R035288/1) and UKRI APEx (NE/T001887/1). JM was supported by the German Ministry for Education and Research (01LA1826A and 03SFK5J0). ML was supported by the Sloan Foundation. All other authors declare no competing interests.
Figures
Comment in
-
The relationship between climate change, health, and the humanitarian response.Lancet. 2022 Nov 5;400(10363):1561-1563. doi: 10.1016/S0140-6736(22)01991-2. Epub 2022 Oct 25. Lancet. 2022. PMID: 36306814 Free PMC article. No abstract available.
-
Global heating: an urgent call for action to protect health.Lancet. 2022 Nov 5;400(10363):1557. doi: 10.1016/S0140-6736(22)02028-1. Epub 2022 Oct 25. Lancet. 2022. PMID: 36306816 Free PMC article. No abstract available.
-
No climate change justice in lieu of global authorship equity.Lancet. 2023 Apr 1;401(10382):1074. doi: 10.1016/S0140-6736(23)00276-3. Lancet. 2023. PMID: 37003688 Free PMC article. No abstract available.
References
-
- World Meteorological Organization. 2021 one of the seven warmest years on record, WMO consolidated data shows. 2021. [accessed April 18, 2022]. https://public.wmo.int/en/media/press-release/2021-one-of-seven-warmest-... .
-
- Ministry of Public Safety and Solicitor General. BC Coroners Service (BCCS) heat-related deaths—knowledge update. 2021. Nov 1, [accessed April 20, 2022]. https://www2.gov.bc.ca/assets/gov/birth-adoption-death-marriage-and-divo... .
-
- State Council Disaster Investigation Team. The probe result on “7·20” torrential rain-caused extraordinarily serious natural disaster in Zhengzhou. Henan (in Chinese): 2022. [accessed April 7, 2022]. https://www.mem.gov.cn/gk/sgcc/tbzdsgdcbg/202201/P020220121639049697767.pdf .
-
- Harper A. UNHCR warns of dire impact from floods in South Sudan as new wet season looms. 2022. Mar 29, [accessed April 7, 2022]. https://www.unhcr.org/uk/news/briefing/2022/3/6242b6254/unhcr-warns-dire... .
-
- International Energy Agency. Global energy review: CO2 emissions in 2021. IEA Publications; Paris: 2022.
Publication types
MeSH terms
Substances
Grants and funding
LinkOut - more resources
Full Text Sources
Medical
Miscellaneous
