. 2022 Dec 1:264:119711.
doi: 10.1016/j.neuroimage.2022.119711. Epub 2022 Oct 25.

Motion-corrected 4D-Flow MRI for neurovascular applications

Affiliations

Motion-corrected 4D-Flow MRI for neurovascular applications

Leonardo A Rivera-Rivera et al. Neuroimage. .

Abstract

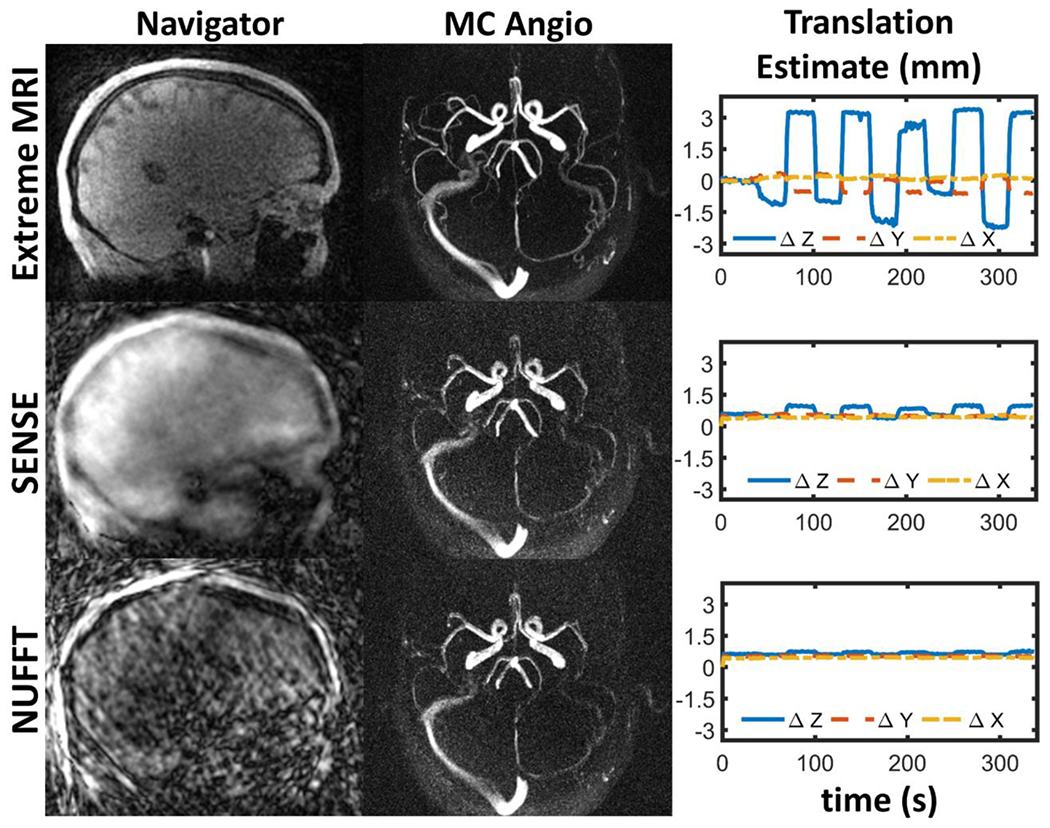
Neurovascular 4D-Flow MRI has emerged as a powerful tool for comprehensive cerebrovascular hemodynamic characterization. Clinical studies in at risk populations such as aging adults indicate hemodynamic markers can be confounded by motion-induced bias. This study develops and characterizes a high fidelity 3D self-navigation approach for retrospective rigid motion correction of neurovascular 4D-Flow data. A 3D radial trajectory with pseudorandom ordering was combined with a multi-resolution low rank regularization approach to enable high spatiotemporal resolution self-navigators from extremely undersampled data. Phantom and volunteer experiments were performed at 3.0T to evaluate the ability to correct for different amounts of induced motions. In addition, the approach was applied to clinical-research exams from ongoing aging studies to characterize performance in the clinical setting. Simulations, phantom and volunteer experiments with motion correction produced images with increased vessel conspicuity, reduced image blurring, and decreased variability in quantitative measures. Clinical exams revealed significant changes in hemodynamic parameters including blood flow rates, flow pulsatility index, and lumen areas after motion correction in probed cerebral arteries (Flow: P<0.001 Lt ICA, P=0.002 Rt ICA, P=0.004 Lt MCA, P=0.004 Rt MCA; Area: P<0.001 Lt ICA, P<0.001 Rt ICA, P=0.004 Lt MCA, P=0.004 Rt MCA; flow pulsatility index: P=0.042 Rt ICA, P=0.002 Lt MCA). Motion induced bias can lead to significant overestimation of hemodynamic markers in cerebral arteries. The proposed method reduces measurement bias from rigid motion in neurovascular 4D-Flow MRI in challenging populations such as aging adults.

Keywords: 4D Flow MRI; Angiography; Bias; Head motion; Motion correction; Quality control.


Conflict of interest statement

Declaration of Competing Interest S.C. Johnson serves on an advisory board for Roche Diagnostics for which he receives an honorarium and is principal investigator of an equipment grant from Roche. He receives research funding from Cerveau Technologies

Figures

Figure 1.
Figure 1.
Framework for rigid motion corrected neurovascular 4D-Flow MRI. Randomized 3D radial data is utilized for a time-resolved (ungated) reconstruction with multi-scale low rank (MSLR) regularization support (Extreme MRI) to generate high fidelity 3D navigators from extremely undersampled data (~43 projections per frame). Navigators are registered to obtain motion estimates. Finally, motion estimates are used to correct k-space data and reconstruct motion corrected complex images for each of the different velocity encodings that are combined into motion corrected velocity images.
Figure 2.
Figure 2.
Schematic of the phantom setup.
Figure 3.
Figure 3.
Voxel-wise velocity plots with overlaid least-square regression lines and Pearson correlation coefficients of the simulation experiments comparing the motion corrected velocities to ground truth for continuous (left column) and stepwise (right column) motions with different levels of maximum rotations (rows). Overall, for rotational motions on the order of 5°, differences of ~2% were found between both continuous and stepwise motion corrected data when compared to ground truth velocities. Larger rotations led to increased velocity differences between corrected and ground truth datasets. After motion correction, large rotations on the order of 30° led to 5-6% differences in velocities when compared to ground truth.
Figure 4.
Figure 4.
Simulated input and recovered rotational motions from self-navigation using the proposed method for both continuous and stepwise motions. For the continuous case, recovered motions were underestimated indicating limitations of the multi-scale low rank Extreme MRI navigator reconstruction. Excellent agreement was observed between input and recovered stepwise motions. These results indicate continuous motions can be more challenging to resolve, while stepwise motions can be recovered with higher fidelity.
Figure 5.
Figure 5.
Translations and rotations measured using 3D-navigators in phantom experiments for each of the six 4D-Flow scans (static, motion once, every 60s, 30s, 15s and continuously). The magnitude of motion varied with maximal values of 3 mm and 3° in the scans where the phantom was moved once and every 60s. The largest translational motion was measured along the direction of the induced motion (lateral movement, x-axis) and minimal displacement in z as the phantom was never lifted from the table. For all moving scans motion started after ~40s of imaging by design.
Figure 6.
Figure 6.
Motion corrected and uncorrected complex difference (CD) angiograms and velocity images (z-component) derived from phantom experiments with varying levels of induced motion (static, motion once, every 60s, 30s, 15s and continuous). Regions of interest (ROIs) were extracted from a location proximal to where induced motion originated, therefore representing cross-sections that experienced greatest motions for each of the scans. Substantial distortion (blurring) of the velocity field was observed for all uncorrected scans except the static scan. After motion correction image blurring was notably reduced for all moving scans. Motion correction of the static scan did not induce any noticeable bias on the velocity fields.
Figure 7.
Figure 7.
Quantitative summary of flow rates and cross-sectional areas is shown for phantom experiments along the length of the straight tube. Distance shown is relative to the distal end of the phantom, where 0 is closest to one end of the phantom and 100mm is closer to the pivot point. Overall, motion correction of the static scan did not add a noticeable bias to flow and area measures. Static vs moving scan flow-rate differences were reduced for most motion frequencies after motion correction. Flow-rate standard deviations in moving scans were reduced after motion correction. All cross-sectional area differences and standard deviations between the static and moving scans were reduced after motion correction of the moving scans.
Figure 8:
Figure 8:
Four healthy volunteers underwent two 4D-Flow scans with and without subject induced controlled motion. During the moving scan subjects alternated between supine and knee bending positions every 30 seconds throughout the scan duration. Subsequently 4D-Flow data were corrected and compared to the static scan. Overall, reduced blurring and increased vessel conspicuity was observed after motion correction on all the angiograms.
Figure 9:
Figure 9:
Summary of motions in controlled volunteer experiments. Measured translations and rotations determined from the 3D navigator registration are shown for each of the four volunteers. Volunteer 3 displayed largest motion primarily on the z-direction, while volunteer 4 head motion was smallest. Rotations were variable across volunteers.
Figure 10:
Figure 10:
Voxel-wise correlations of moving and static scans before and after motion correction for each of the four volunteers. The x-axis displays the velocities of the static scan without motion correction. Overall, moving scan data without motion correction resulted in disagreements on the order of 6-18% with static scans. Motion correction of moving scans increased correlation coefficients and agreement with static scan velocities in all cases. The level of agreement after motion correction was variable with better agreement in motion corrected data from volunteers that moved less (#1 and #4) compared to volunteers that moved more (#2 and #3). Correlations of motion corrected and uncorrected static scan data showed coefficients close to 1.00 (Volunteer 1 R2=0.999, Volunteer 2 R2=0.998, Volunteer 3 R2=0.999, and Volunteer 4 R2=0.999) for all volunteers and differences of 1-2%.
Figure 11:
Figure 11:
Quantitative neurovascular 4D-Flow markers from healthy volunteers undergoing the induced motion experiments before and after motion correction of a moving (m,NoMC; m,MC) and static (s,NoMC; s,MC) scan. Quantitative measurements were extracted from vessel segments including bilateral cervical internal carotid arteries (ICAs) and middle cerebral arteries (MCAs), where quantitative markers including blood flow rates, flow pulsatility index (PI), and cross-sectional areas were derived from the average of 5 equidistant consecutively cross-sectional planes extracted automatically during segmentation. On moving scans (m,NoMC; m,MC), motion correction substantially reduced intra-subject variability while increased precision between moving and static scans for all quantitative markers. On the static scans (s,NoMC; s,MC), quantitative markers values were similar before and after MC correction.
Figure 12:
Figure 12:
Navigators (left panel), generated from moving scan 4D-Flow data from volunteer 3, used to track motion (right panel) and enable motion corrected angiograms (middle panel) using three different navigator reconstructions schemes: Extreme MRI (multi-scale low rank (MSLR)), iterative SENSE, and direct NUFFT. Navigators were generated from ~43 projections per frame. Extreme MRI based navigators displayed greater image quality which led to high fidelity and stability motion tracking estimates and better angiogram motion correction. Undersampling artifact riddled SENSE and NUFFT navigators failed to resolved volunteer motion, leading to more blurred and noisy images.
Figure 13.
Figure 13.
Examples of observed motions variability in clinical cases during scanning. Translational and rotational head motion measures were derived from extremely undersampled (~40 projections per frame) 3D self-navigator registrations aided by Extreme MRI reconstruction. Subject demographics: Case 7: MCI subject, 71 yrs; Case 8: cognitively normal, 78 yrs; Case 4: cognitively normal, 82 yrs.
Figure 14.
Figure 14.
Example of magnitude (left panel) and angiographic (right panel) images derived from neurovascular 4D-Flow MRI data from clinical cases. After rigid head motion correction of k-space data, significant improvements in subjective magnitude and angiogram image quality were observed. Motion correction led to reduced blurring and increased vessel conspicuity (orange arrows). Subject demographics: Case 7: MCI subject, 71 yrs; Case 8: cognitively normal, 78 yrs; Case 4: cognitively normal, 82 yrs.
Figure 15.
Figure 15.
Velocity streamlines along the cerebral arteries for clinical case 7 with and without motion correction (left and right panels). Subject motion led to substantial vessel blurring and noisy velocity fields. Subsequently these errors led to inaccuracies in vessel segmentation and quantification as observed on the right panel streamlines and MIP images (small overlay). After correcting k-space data for bulk motion, improved vessel segmentation and streamline quantification was achieved (left panel). In this example, both datasets (corrected and uncorrected) were segmented using a fixed threshold value.
Figure 16.
Figure 16.
Summary of 4D-Flow MRI derived hemodynamic markers in various cerebral vessels before and after motion correction (MC) in 11 human subjects from ongoing aging research studies. Measurements were performed in the left and right internal carotid arteries (ICAs) and middle cerebral arteries (MCAs). All hemodynamic markers including blood flow rates, cross-sectional area, and flow pulsatility index (PI) were significantly reduced (P<0.05) in all vessel segments (except PI in the left ICA and right MCA) after motion correction. Most hemodynamic markers also displayed a reduction in measurement variability after motion correction.

Similar articles

Cited by

References

    1. Anderson AG, Velikina J, Block W, Wieben O, Samsonov A, 2013. Adaptive retrospective correction of motion artifacts in cranial MRI with multicoil three-dimensional radial acquisitions: Adaptive 3D Motion Correction. Magn. Reson. Med 69, 1094–1103. 10.1002/mrm.24348 - DOI - PMC - PubMed
    1. Aristova M, Pang J, Ma Y, Ma L, Berhane H, Rayz V, Markl M, Schnell S, 2022. Accelerated dual-venc 4D flow MRI with variable high-venc spatial resolution for neurovascular applications. Magnetic Resonance in Medicine 88, 1643–1658. 10.1002/mrm.29306 - DOI - PMC - PubMed
    1. Aristova M, Vali A, Ansari SA, Shaibani A, Alden TD, Hurley MC, Jahromi BS, Potts MB, Markl M, Schnell S, 2019. Standardized Evaluation of Cerebral Arteriovenous Malformations Using Flow Distribution Network Graphs and Dual-venc 4D Flow MRI. J Magn Reson Imaging 50, 1718–1730. 10.1002/jmri.26784 - DOI - PMC - PubMed
    1. Avinun R, Israel S, Knodt AR, Hariri AR, 2020. Little evidence for associations between the Big Five personality traits and variability in brain gray or white matter. NeuroImage 220, 117092. 10.1016/j.neuroimage.2020.117092 - DOI - PMC - PubMed
    1. Björnfot C, Garpebring A, Qvarlander S, Malm J, Eklund A, Wåhlin A, 2021. Assessing cerebral arterial pulse wave velocity using 4D flow MRI. J Cereb Blood Flow Metab 0271678X211008744. 10.1177/0271678X211008744 - DOI - PMC - PubMed

Publication types