

Comment
doi: 10.1136/gutjnl-2022-328216.
Epub 2022 Oct 28.
Overcoming regional limitations: transfer learning for cross-regional microbial-based diagnosis of diseases
Affiliations
- PMID: 36307182
- PMCID: PMC10511966
- DOI: 10.1136/gutjnl-2022-328216
Item in Clipboard
Comment
Overcoming regional limitations: transfer learning for cross-regional microbial-based diagnosis of diseases
Gut.
2023 Oct.
No abstract available
Keywords: INTESTINAL BACTERIA; INTESTINAL MICROBIOLOGY.
Conflict of interest statement
Competing interests: None declared.
Figures
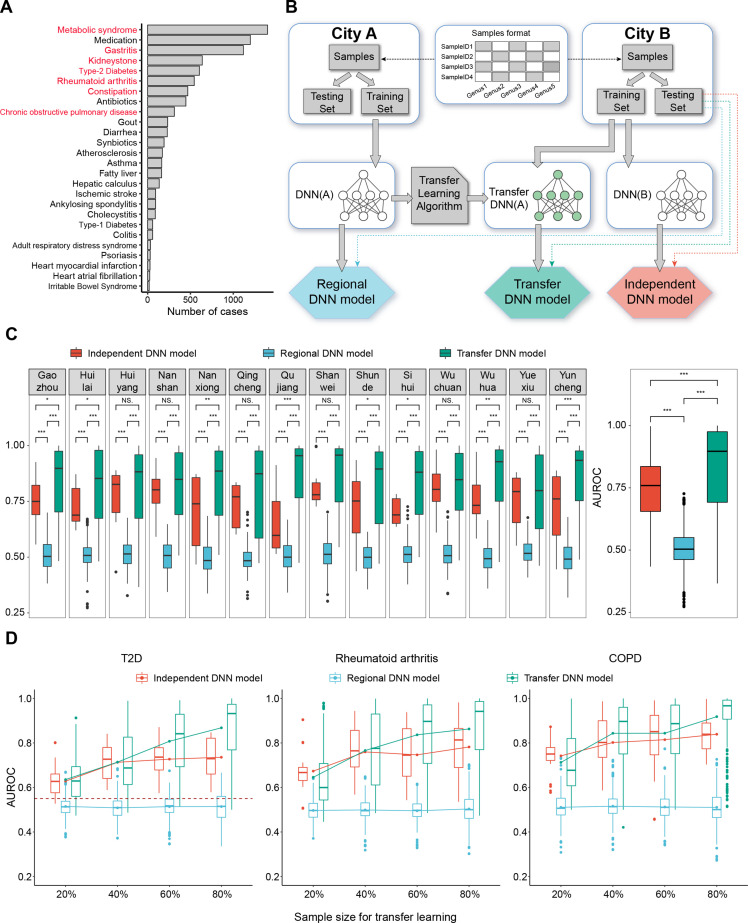
Data distribution, assessment workflow and framework evaluation. (A) data distribution. The number of samples of different diseases. The seven diseases marked in red were assessed, including metabolic syndrome, gastritis, kidney stones, T2D, rheumatoid arthritis, constipation and COPD. (B) The workflow of assessment. The genera abundance profiles of samples from each city were randomly divided into the training subset (80%) and the testing subset (20%). Three assessment workflows for each model were marked by three different colours. The testing subset of city B was used to test all the three models. (C) Framework evaluation: comparison of the AUROC of three models. Boxplots in the left panel show the AUROC of the three models for diagnosing seven diseases using samples in each of city, and the right panel shows these values collectively. *, p<0.05; **, p<0.01; ***, p<0.005; Mann-Whitney-Wilcoxon test. (D) The relationship between sample size and the performance of three models. Boxplots show AUROC of three models for diagnosing three diseases (COPD, rheumatoid arthritis and T2D). The lines show the change in average AUROC of three models with sample size increasing. The dashed line shows the average AUROC of cross-regional diagnosis of T2D using random forest model. For all the boxplots, boxes represent the IQR between the first and third quartiles and the line inside represents the median. Whiskers denote the lowest and highest values within the 1.5×IQR from the first and third quartiles, respectively. AUROC, area under the receiver operating characteristic; COPD, chronic obstructive pulmonary disease; T2D, type 2 diabetes.
Comment on
-
Ranking microbiome variance in inflammatory bowel disease: a large longitudinal intercontinental study.Gut. 2021 Mar;70(3):499-510. doi: 10.1136/gutjnl-2020-321106. Epub 2020 Jun 14. Gut. 2021. PMID: 32536605 Free PMC article.
References
-
- Sun Q, Liu Y, Chua T. Meta-transfer learning for few-shot learning. 2019 IEEE Conf Comput Vis Pattern Recognit, 2019:403–12.
Publication types
MeSH terms
LinkOut - more resources
Full Text Sources