. 2022 Dec:144:123-134.
doi: 10.1016/j.clinph.2022.09.015. Epub 2022 Oct 7.

Connectivity increases during spikes and spike-free periods in self-limited epilepsy with centrotemporal spikes

Affiliations

Connectivity increases during spikes and spike-free periods in self-limited epilepsy with centrotemporal spikes

Beatrice S Goad et al. Clin Neurophysiol. 2022 Dec.

Abstract

Objective: To understand the impact of interictal spikes on brain connectivity in patients with Self-Limited Epilepsy with Centrotemporal Spikes (SeLECTS).

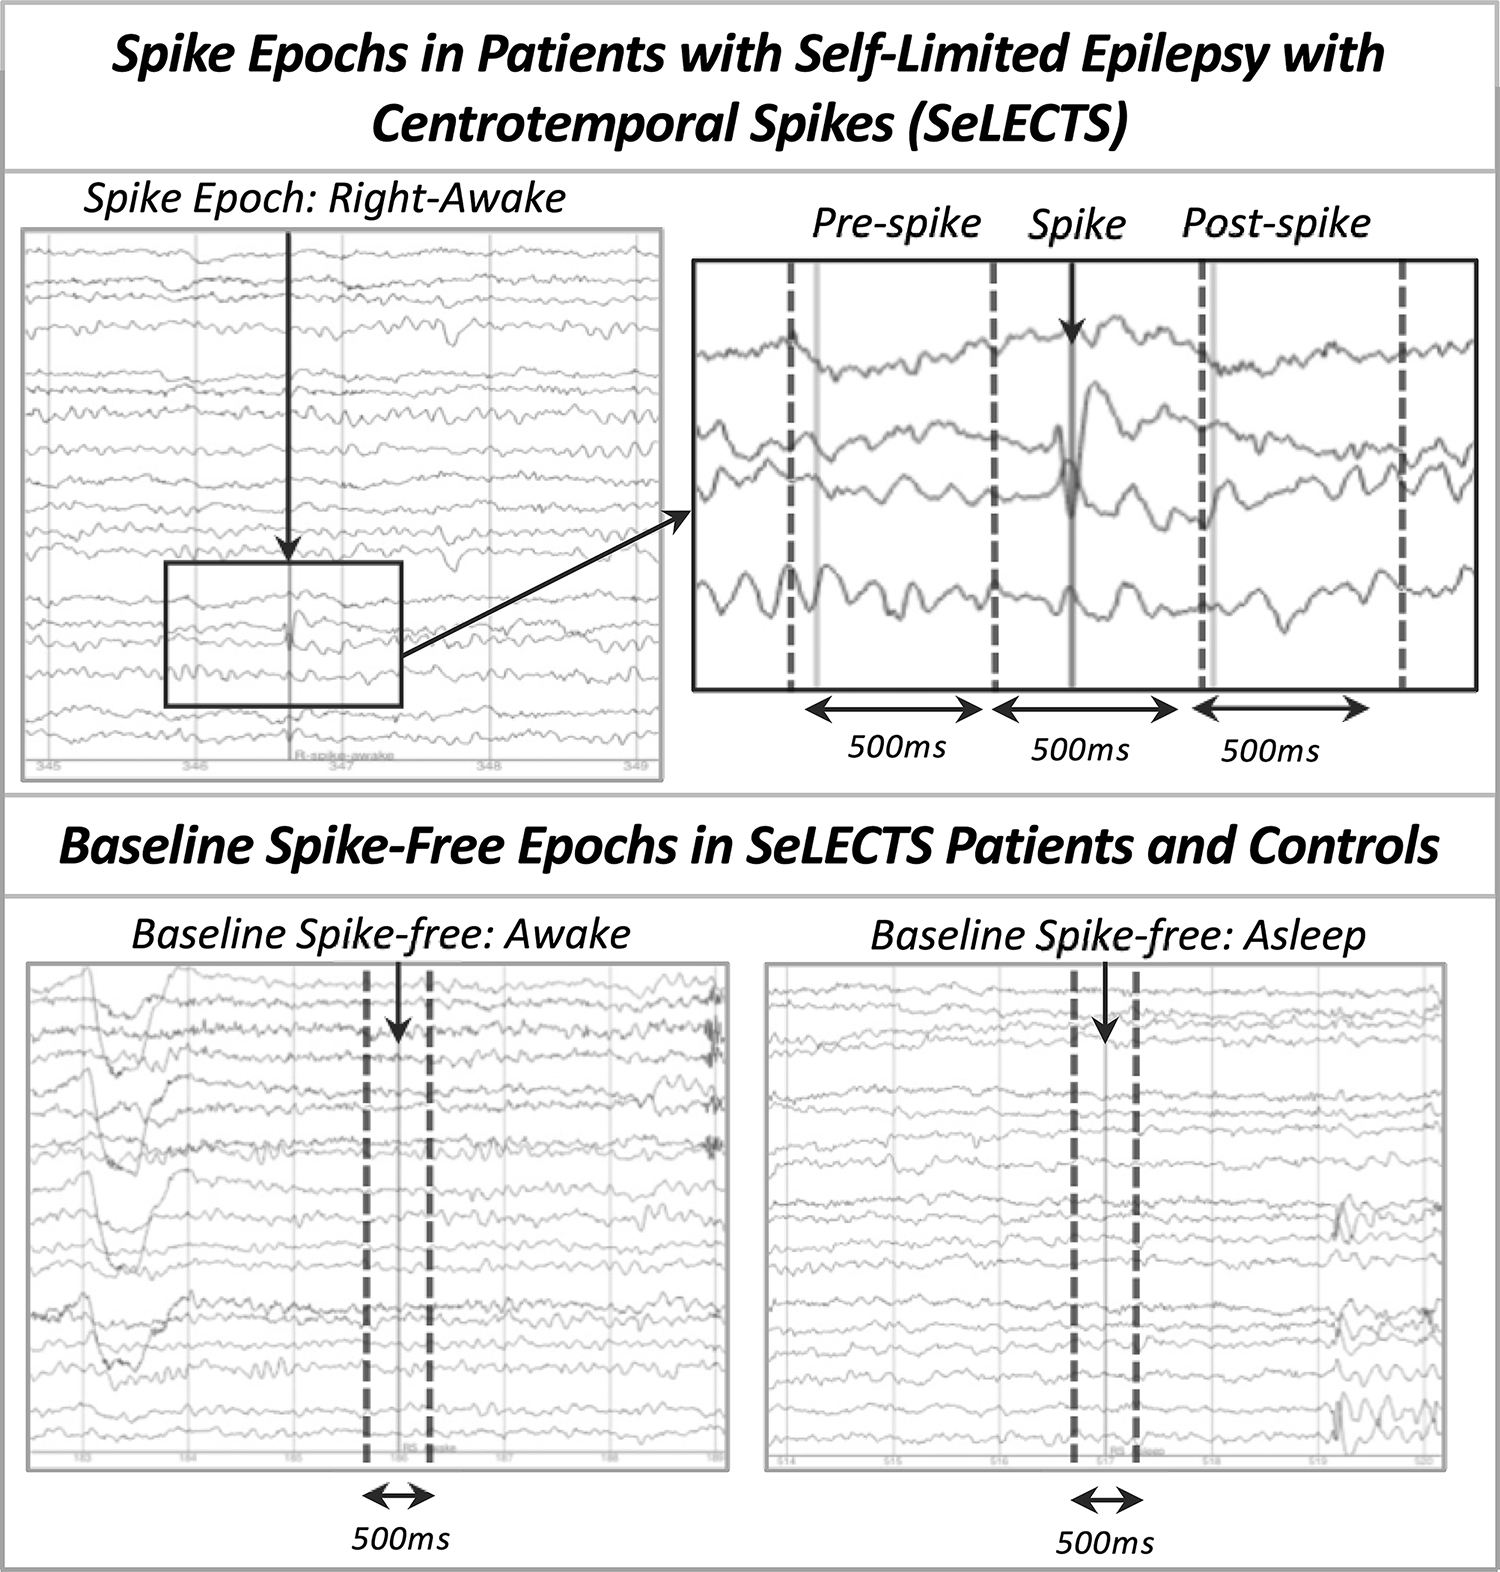
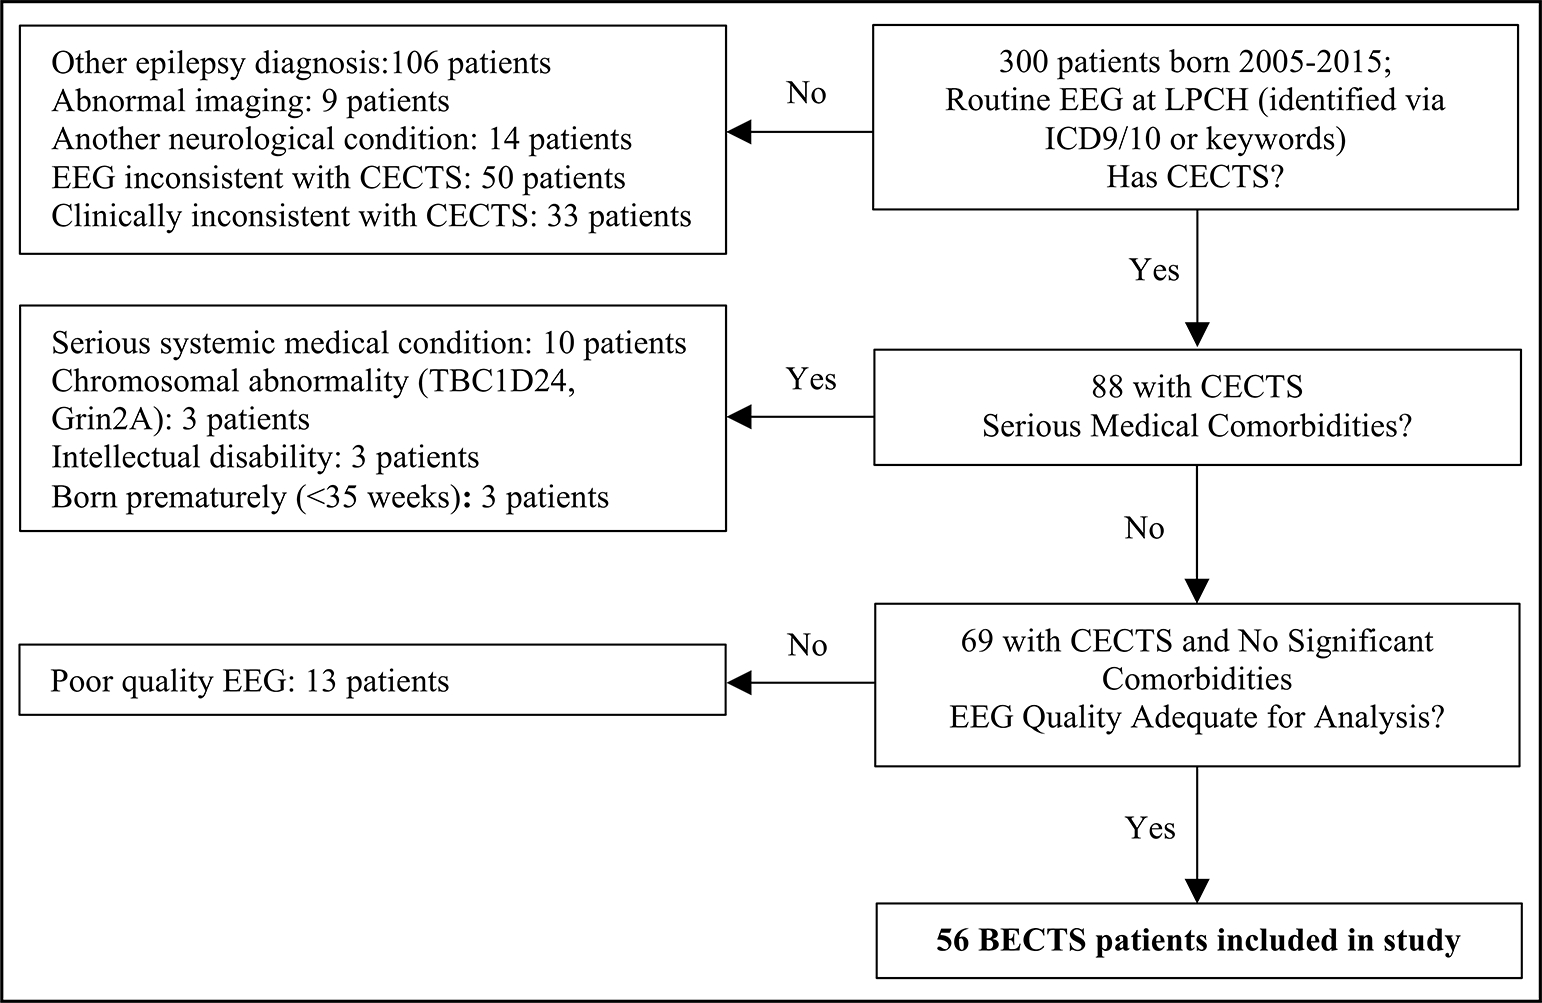
Methods: Electroencephalograms from 56 consecutive SeLECTS patients were segmented into periods with and without spikes. Connectivity between electrodes was calculated using the weighted phase lag index. To determine if there are chronic alterations in connectivity in SeLECTS, we compared spike-free connectivity to connectivity in 65 matched controls. To understand the acute impact of spikes, we compared connectivity immediately before, during, and after spikes versus baseline, spike-free connectivity. We explored whether behavioral state, spike laterality, or antiseizure medications affected connectivity.

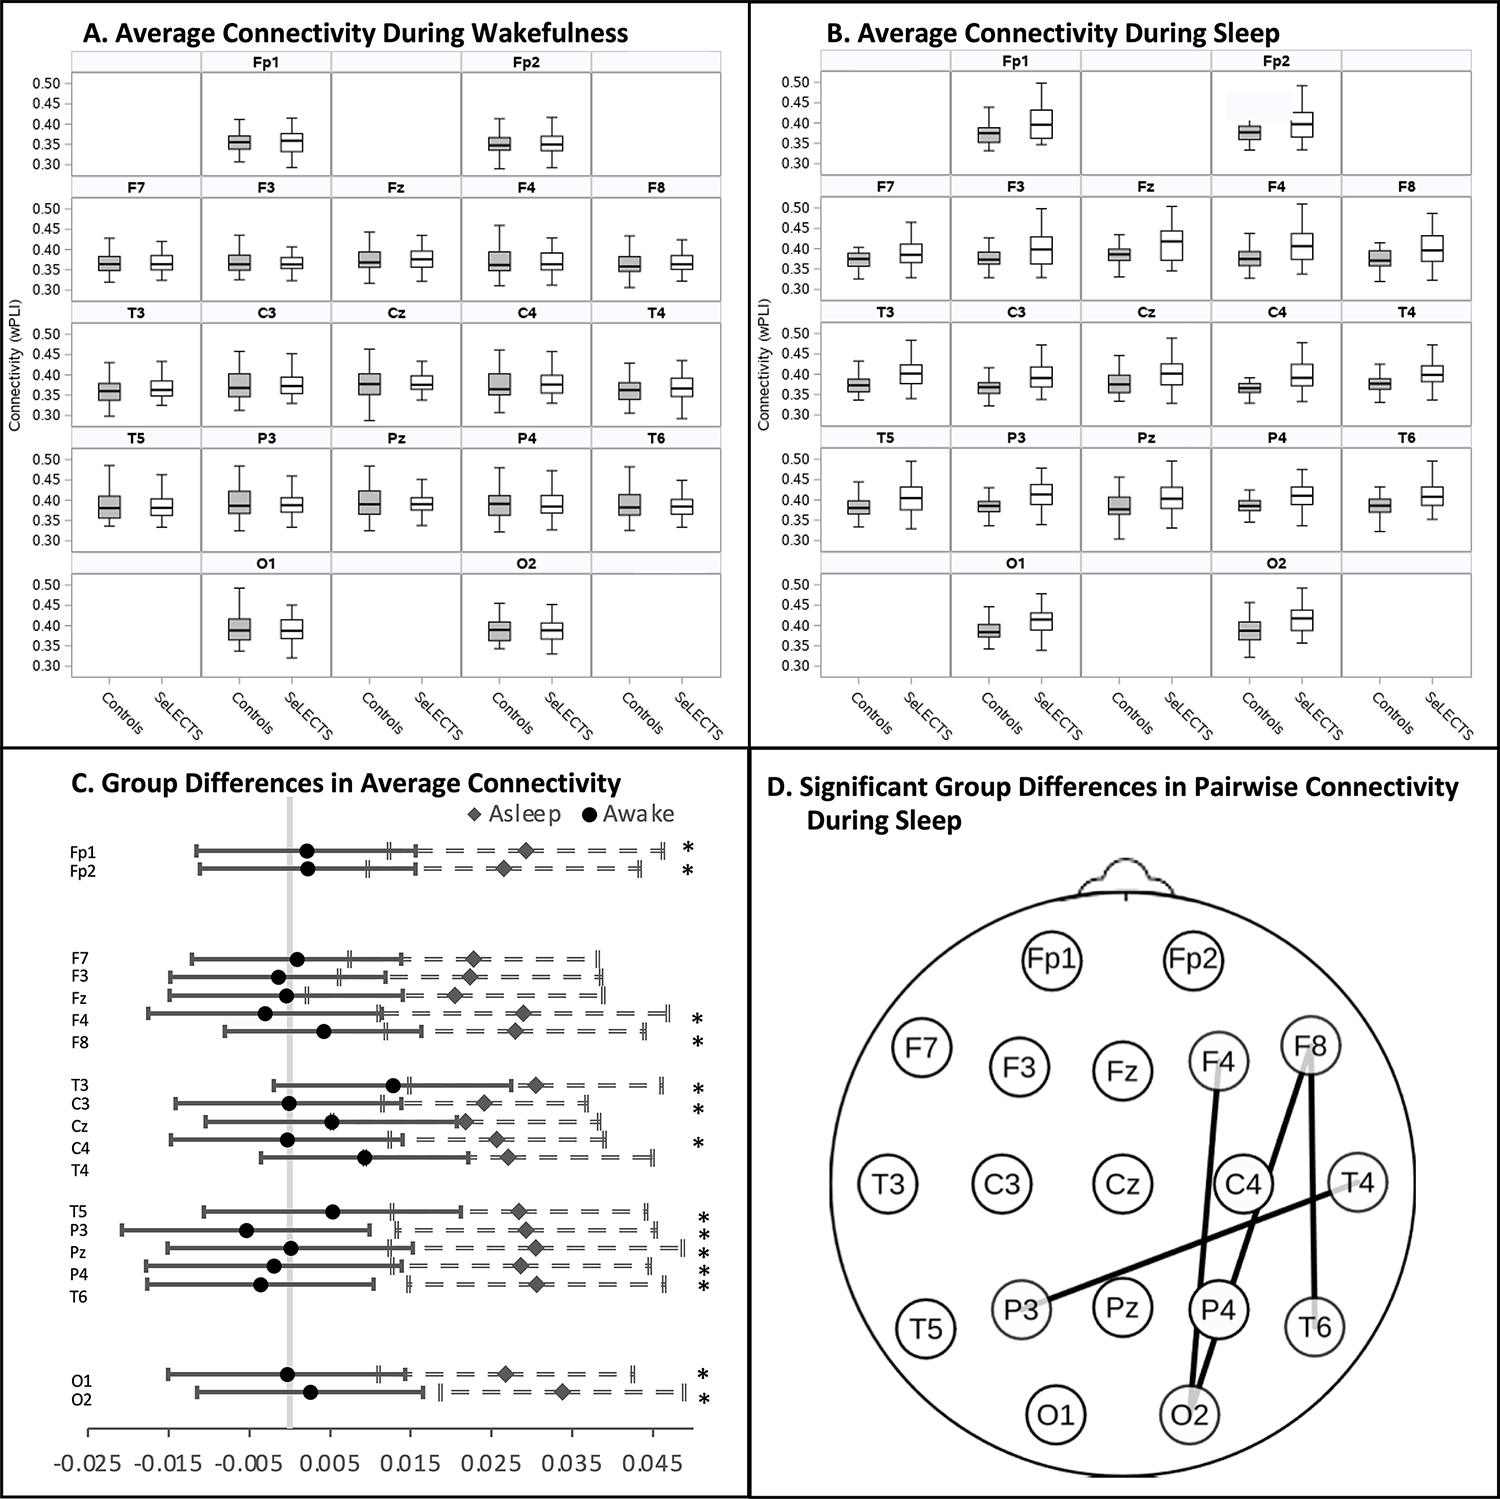
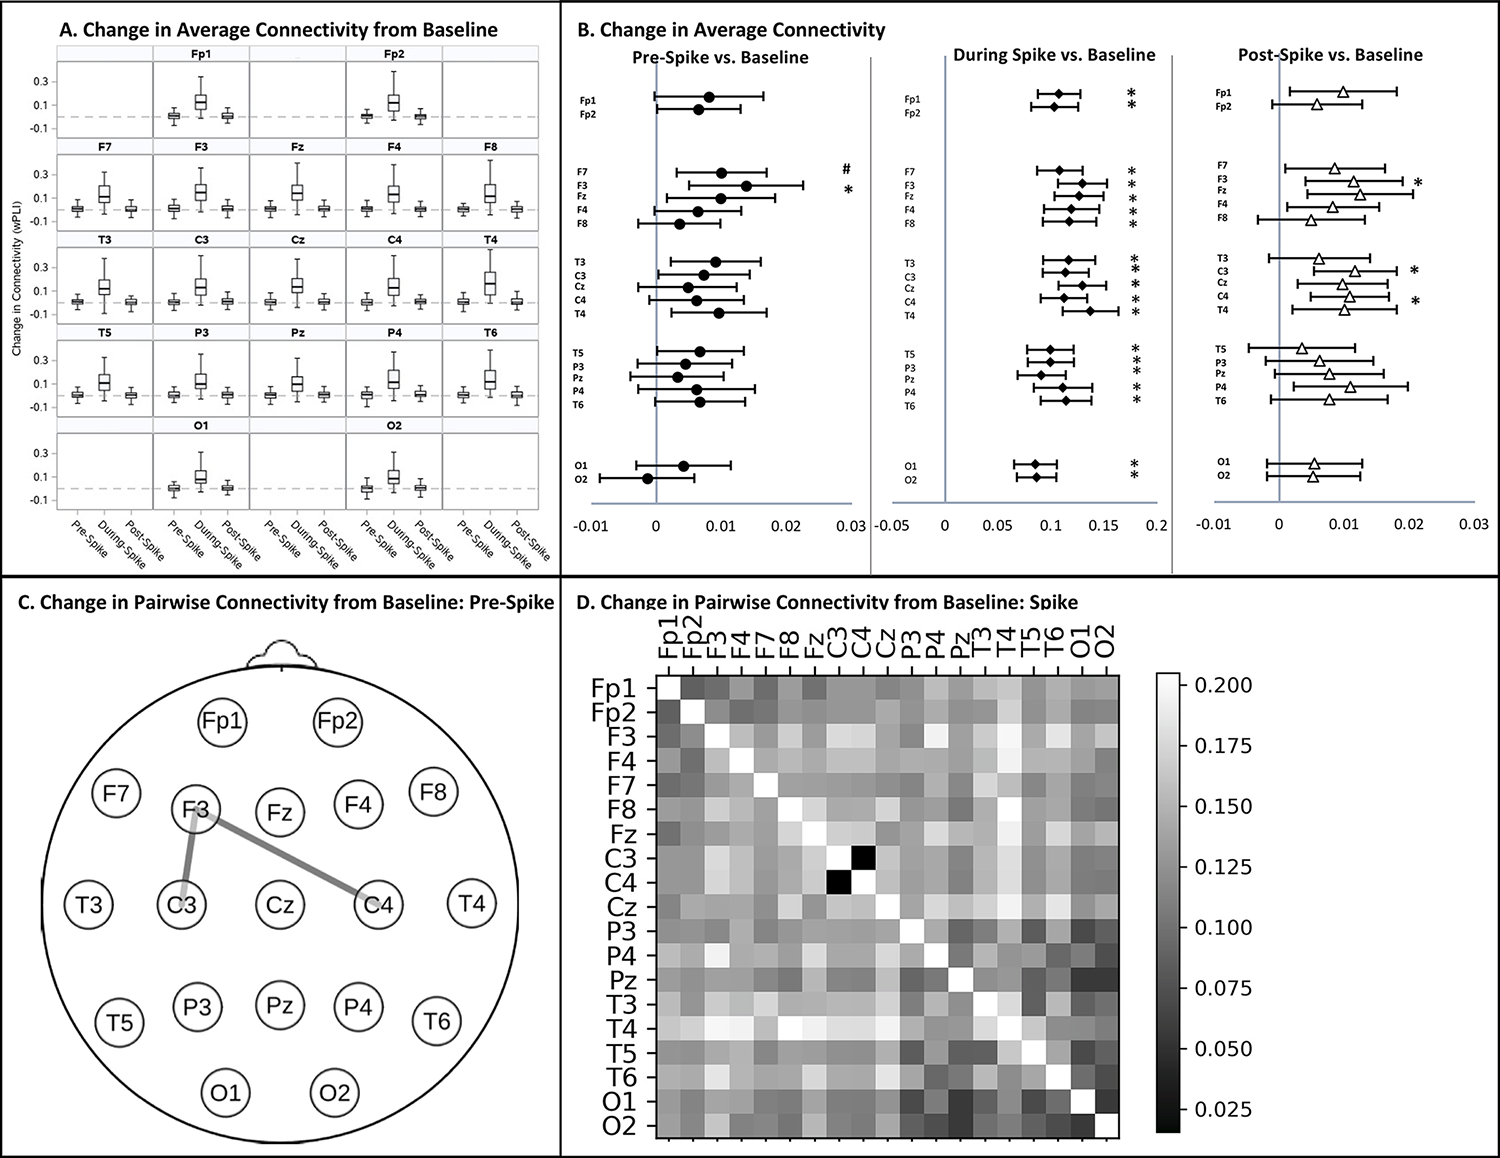
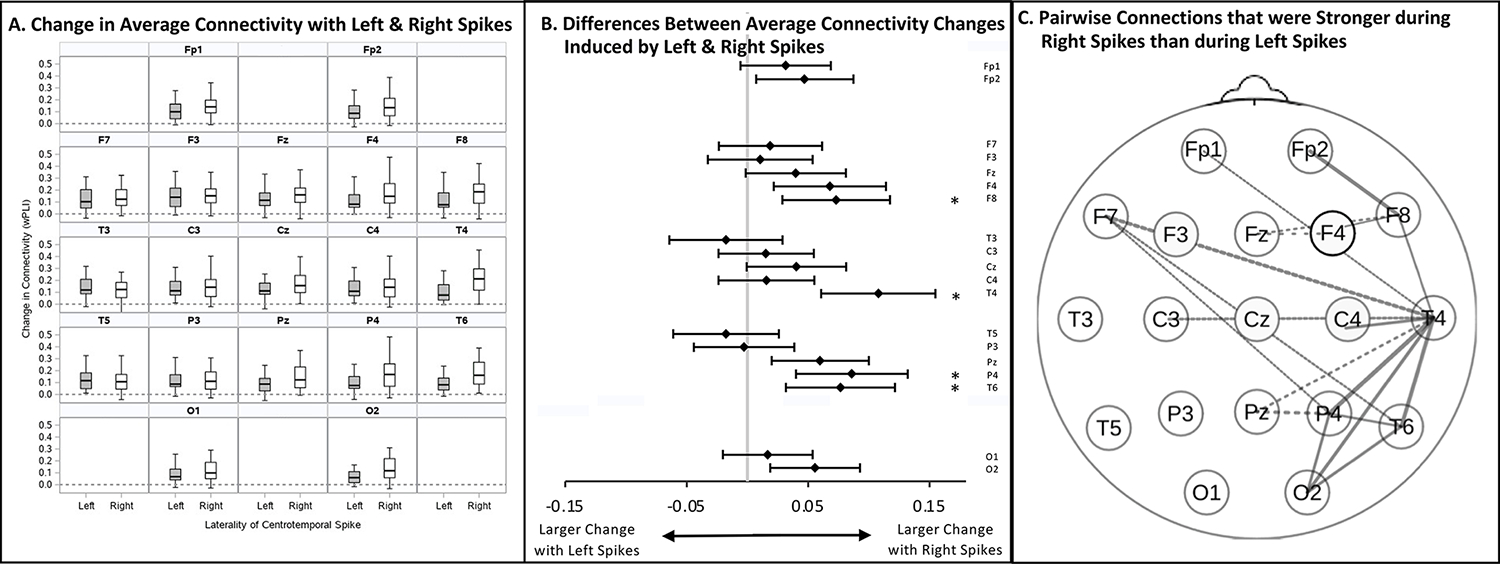
Results: Children with SeLECTS had markedly higher connectivity than controls during sleep but not wakefulness, with greatest difference in the right hemisphere. During spikes, connectivity increased globally; before and after spikes, left frontal and bicentral connectivity increased. Right hemisphere connectivity increased more during right-sided than left-sided spikes; left hemisphere connectivity was equally affected by right and left spikes.

Conclusions: SeLECTS patient have persistent increased connectivity during sleep; connectivity is further elevated during the spike and perispike periods.

Significance: Testing whether increased connectivity impacts cognition or seizure susceptibility in SeLECTS and more severe epilepsies could help determine if spikes should be treated.

Keywords: Benign Epilepsy with Centrotemporal Spikes (BECTS); Childhood Epilepsy with Centrotemporal Spikes (CECTS); Connectivity; Interictal epileptiform discharges (IEDs); Rolandic epilepsy; Sleep.


Conflict of interest statement

Declaration of interest None.

Figures

Figure 1:
Figure 1:. Creating Electroencephalogram Epochs for Analysis
The top panel shows annotation of the spike and definition of the three spike-related (pre-spike, during spike, post-spike) epochs based on this annotation. The lower panel shows identification of awake (left) and asleep (right) baseline, spike-free epochs separated by a minimum of 2 seconds from artifacts and from sleep architecture.
Figure 2:
Figure 2:. Selection Criteria for Self-Limited Epilepsy with Centrotemporal Spikes (SeLECTS) Patients
Children with SeLECTS were identified as above. Charts from 1019 patients evaluated for syncope, headache, or altered consciousness were reviewed to identify age- and sex-matched controls with electroencephalograms but without a diagnosis of epilepsy or significant neurological disorders.
Figure 3:
Figure 3:. Spike-Free Baseline Connectivity in Children with Self-Limited Epilepsy with Centrotemporal Spikes (SeLECTS) vs. Children without Epilepsy
Average baseline connectivity in spike free epochs of children with and without SeLECTS in the (A) waking and (B) sleeping state, averaged by electrode. Box plots represent median, interquartile range and 95% distribution of data. C. Forest plot show group differences in average connectivity in the waking (circle) and sleep (diamond) states by electrode. Significant differences in the sleep state indicated by * (p<0.0026); no differences were noted in the awake state. D. Topographic plot showing electrode pairs with significantly increased pairwise connectivity in SeLECTS patients vs. controls (p<0.0003) in the sleeping state; there were no significant group differences in pairwise connectivity in wakefulness. Connectivity was quantified using the weighted Phase Lag Index (wPLI).
Figure 4:
Figure 4:. Change in Connectivity from the Spike-Free Baseline during the Pre-Spike, Spike, and Post- Spike Epochs in Children with Self-Limited Epilepsy with Centrotemporal Spikes (SeLECTS)
A. Median change in average connectivity between the pre-spike, spike, and post-spike epochs from the remote, spike-free baseline by electrode. Dotted line indicates no change from baseline. Box plots illustrate the median, interquartile range and 95% distribution of data. B. Forest plots show electrodes with significant increases in average connectivity from baseline during the pre- (circles), spike- (diamonds), and post-spike (triangles) epochs. The vertical gray line indicates no change from baseline. Significant increases in connectivity indicated by * (p<0.0026); connectivity increases trending toward significance indicated by # (p<0.005). No electrodes showed a significant decrease in connectivity from baseline. C. Topographic plot showing electrode pairs with a significant increase in pairwise connectivity from baseline (p<0.0003) in the pre-spike epoch. D. Heat map illustrating increases in connectivity from baseline between all electrode pairs, with brighter boxes indicating greater connectivity increases. The diagonal has been left white. No electrode pairs experienced a decrease in connectivity compared to baseline. The increase in connectivity was significant during the spike epoch for all pairs (p<0.0003) except C3-C4. Changes in pairwise connectivity in the post-spike epoch are not depicted as they were not significant. Connectivity was quantified using the weighted Phase Lag Index (wPLI).
Figure 5:
Figure 5:. Impact of Spike Laterality on Connectivity During the Spike Epoch
A. Median change in average connectivity from baseline of each electrode during left vs. right centrotemporal spikes. The dotted line represents no change from baseline. Box plots illustrate the median, interquartile range and 95% distribution of data. B. Forest plot show whether left or right centrotemporal spike have a greater impact on connectivity. The gray vertical line indicates that connectivity is equally affected by left and right spikes. Electrodes showing a significantly greater increase in average connectivity from baseline with right rather than left spikes are indicated by * (p<0.0026). No electrodes showed a significantly greater increase from baseline with left-sided spikes. C. Topographic plot showing electrode pairs with a significantly greater increase in pairwise connectivity (p<0.0003) after right than left centrotemporal spikes. Solid lines represent connections within the right hemisphere; dotted lines represent connections between the right hemisphere and vertex; beveled lines represent connections between the right and left hemispheres. No electrode or electrode pairs showed a significantly greater increase in connectivity during left than right centrotemporal spikes. Connectivity was quantified using the weighted Phase Lag Index (wPLI).

Comment in

Similar articles

Cited by

References

    1. Adebimpe A, Aarabi A, Bourel-Ponchel E, Mahmoudzadeh M, Wallois F. EEG Resting State Functional Connectivity Analysis in Children with Benign Epilepsy with Centrotemporal Spikes. Front Neurosci 2016;10:143. 10.3389/fnins.2016.00143. - DOI - PMC - PubMed
    1. Adebimpe A, Aarabi A, Bourel-Ponchel E, Mahmoudzadeh M, Wallois F. Functional Brain Dysfunction in Patients with Benign Childhood Epilepsy as Revealed by Graph Theory. PLoS One 2015;10:e0139228. 10.1371/journal.pone.0139228. - DOI - PMC - PubMed
    1. Apache Arrow Team, Apache Arrow. PyArrow python bindings to the Apache Arrow project, a development platform for in-memory analytics. 2022. (PyArrow version 5.0.0) [Online accessed Oct 2020, updated Dec 2021, Aug 2022] Apache Software Foundation. https://arrow.apache.org/docs/python/index.html
    1. Berg AT, Berkovic SF, Brodie MJ, Buchhalter J, Cross JH, van Emde Boas W, et al. Revised terminology and concepts for organization of seizures and epilepsies: Report of the ILAE Commission on Classification and Terminology, 2005–2009. Epilepsia 2010;51:676–85. 10.1111/j.1528-1167.2010.02522.x. - DOI - PubMed
    1. Besseling RMH, Jansen JFA, Overvliet GM, Van Der Kruijs SJM, Ebus SCM, De Louw A, et al. Reduced structural connectivity between sensorimotor and language areas in rolandic epilepsy. PLoS One 2013a;8:1–7. 10.1371/journal.pone.0083568. - DOI - PMC - PubMed

Publication types