. 2022 Oct 28;12(1):455.
doi: 10.1038/s41398-022-02224-1.

Neurexin1α knockout rats display oscillatory abnormalities and sensory processing deficits back-translating key endophenotypes of psychiatric disorders

Affiliations

Neurexin1α knockout rats display oscillatory abnormalities and sensory processing deficits back-translating key endophenotypes of psychiatric disorders

Philipp Janz et al. Transl Psychiatry. .

Abstract

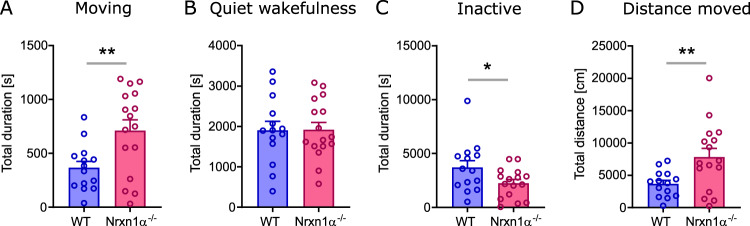
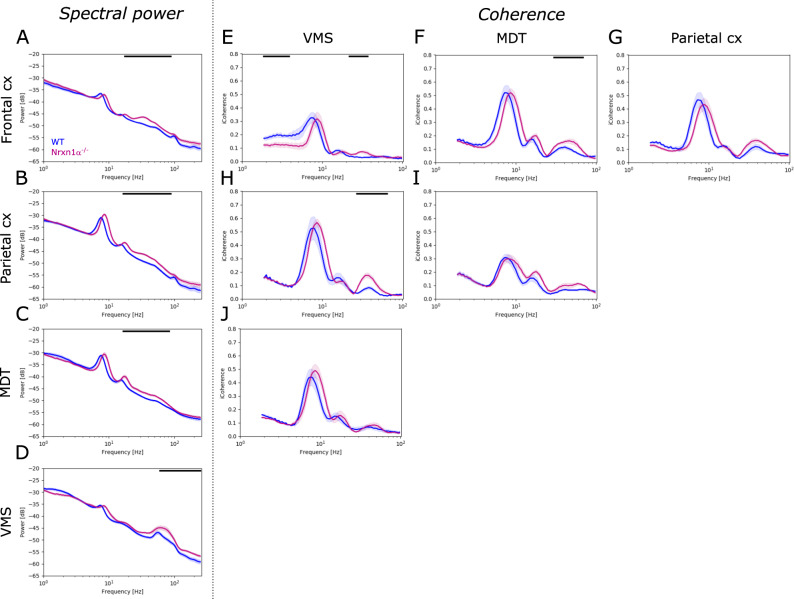
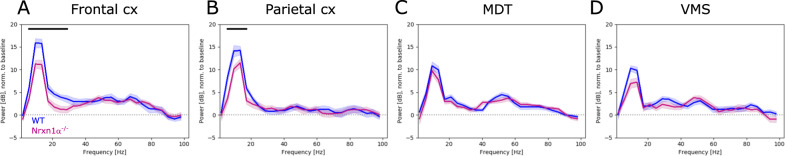
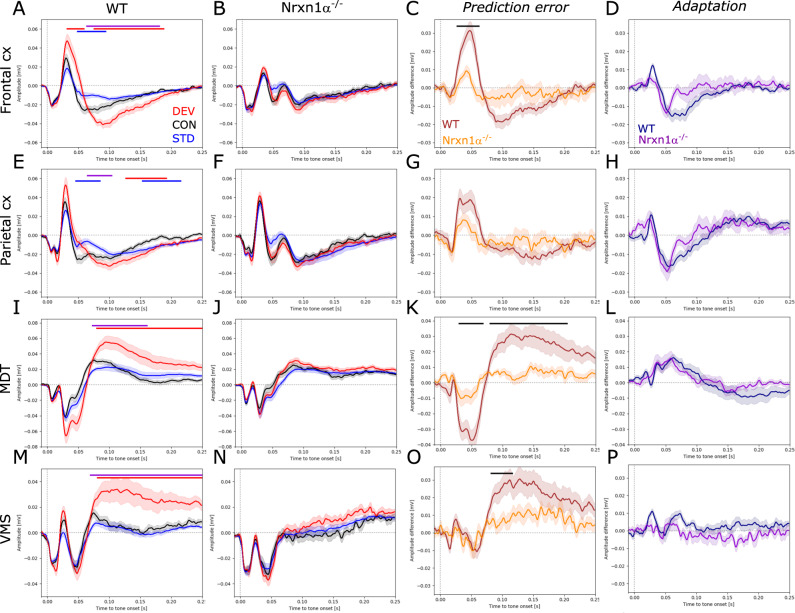
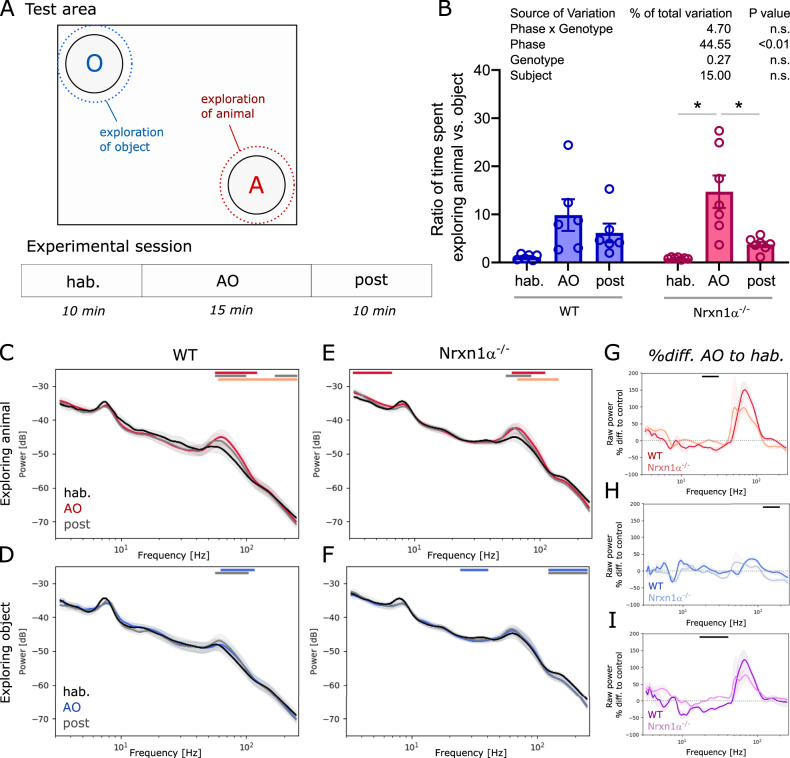
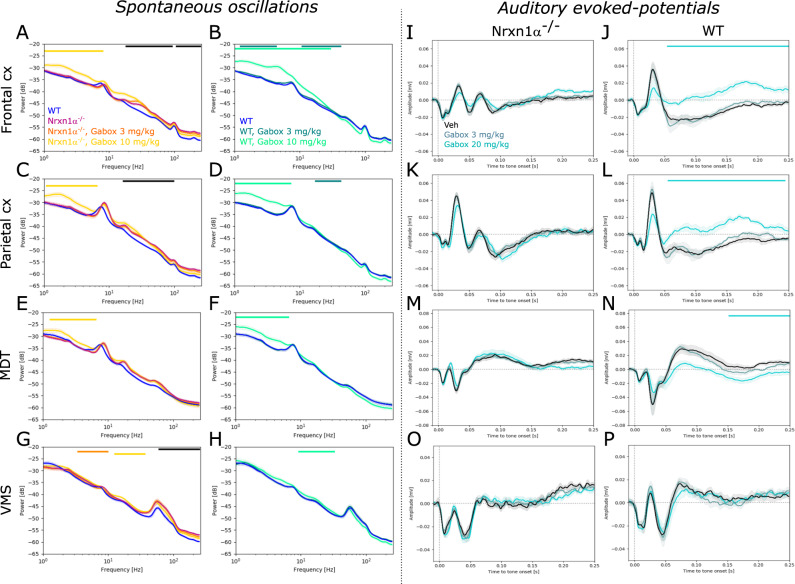
Neurexins are presynaptic transmembrane proteins crucial for synapse development and organization. Deletion and missense mutations in all three Neurexin genes have been identified in psychiatric disorders, with mutations in the NRXN1 gene most strongly linked to schizophrenia (SZ) and autism spectrum disorder (ASD). While the consequences of NRXN1 deletion have been extensively studied on the synaptic and behavioral levels, circuit endophenotypes that translate to the human condition have not been characterized yet. Therefore, we investigated the electrophysiology of cortico-striatal-thalamic circuits in Nrxn1α-/- rats and wildtype littermates focusing on a set of translational readouts, including spontaneous oscillatory activity, auditory-evoked oscillations and potentials, as well as mismatch negativity-like (MMN) responses and responses to social stimuli. On the behavioral level Nrxn1α-/- rats showed locomotor hyperactivity. In vivo freely moving electrophysiology revealed pronounced increases of spontaneous oscillatory power within the gamma band in all studied brain areas and elevation of gamma coherence in cortico-striatal and thalamocortical circuits of Nrxn1α-/- rats. In contrast, auditory-evoked oscillations driven by chirp-modulated tones showed reduced power in cortical areas confined to slower oscillations. Finally, Nrxn1α-/- rats exhibited altered auditory evoked-potentials and profound deficits in MMN-like responses, explained by reduced prediction error. Despite deficits for auditory stimuli, responses to social stimuli appeared intact. A central hypothesis for psychiatric and neurodevelopmental disorders is that a disbalance of excitation-to-inhibition is underlying oscillatory and sensory deficits. In a first attempt to explore the impact of inhibitory circuit modulation, we assessed the effects of enhancing tonic inhibition via δ-containing GABAA receptors (using Gaboxadol) on endophenotypes possibly associated with network hyperexcitability. Pharmacological experiments applying Gaboxadol showed genotype-specific differences, but failed to normalize oscillatory or sensory processing abnormalities. In conclusion, our study revealed endophenotypes in Nrxn1α-/- rats that could be used as translational biomarkers for drug development in psychiatric disorders.


Conflict of interest statement

PJ, MB, SM, PS, and RLR were under paid employment by the company F. Hoffmann-La Roche (Roche). The funder provided support in the form of salaries for authors, but did not have any additional role in the study design, data collection and analysis, decision to publish, or preparation of the manuscript. This does not alter the authors’ adherence to all the journal policies on sharing data and materials.

Figures

Fig. 1
Fig. 1. Time spent in basic behavioral states.
A total duration of time spent moving, B being in a quiet wakefulness state, C being inactive (including sleep), and D total distance moved. WT (N = 14) displayed in blue, Nrxn1α−/− (N = 16) shown in magenta. Each datapoint represents one animal. Data displayed as mean + SEM. Two-tailed Student’s t-test. *p < 0.1, **p < 0.01.
Fig. 2
Fig. 2. Power and coherence of spontaneous brain oscillations.
AD Spectral power of spontaneous oscillations for each brain region (frontal cortex, parietal cortex, mediodorsal thalamus, MDT and ventromedial striatum, VMS) investigated. and EJ imaginary coherence between brain regions, e.g., E coherence between frontal cortex and VMS, F between frontal cortex and MDT or H between parietal cortex and VMS. WT (N = 14) displayed in blue, Nrxn1α−/− (N = 14) shown in magenta. Data displayed as mean + SEM and tested with unpaired CBPT. Black bars above the graphs represent clusters with statistically significant differences.
Fig. 3
Fig. 3. Power of auditory-evoked brain oscillations.
A Spectral power of chirp-evoked oscillations for frontal cortex, B parietal cortex, C mediodorsal thalamus, MDT and D ventromedial striatum, VMS. WT (N = 14) displayed in blue, Nrxn1−/− (N = 14) shown in magenta. Data displayed as mean + SEM and tested with unpaired CBPT. Black bars above the graphs represent clusters with statistically significant differences.
Fig. 4
Fig. 4. Auditory event-related potentials and mismatch responses.
A, E, I, M Auditory-evoked potentials in the frontal cortex, parietal cortex, mediodorsal thalamus (MDT) and ventromedial striatum (VMS) of wildtype (N = 12) and B, F, J, N Nrxn1−/− rats (N = 15). Responses to the deviant tone depicted in red, to the control tone in black and to the standard tone in blue. C, G, K, O Difference waveforms between responses to the deviant and the control tone to reveal the prediction error, and D, H, L, P difference waveforms between responses to the control and to the standard tone to assess adaptation. Data displayed as mean + SEM and tested with paired or unpaired CBPT. Colored bars (red: deviant vs. control; blue: standard vs. control; violet: deviant vs. standard; black: WT vs. Nrxn1α−/−) above the graphs represent clusters with statistically significant differences.
Fig. 5
Fig. 5. Behavior and oscillatory activity during social response assay.
A Upper part: Schematic of test area, consisting of an open field with an object and an animal zone (rest = neutral zone) with the dotted lines indicating the area in which an encounter is scored as exploration; and lower part: Design of the experimental session (3 phases: habituation, hab; animal/object exploration, AO; post phase). B Box plot showing the ratio of time animals spent exploring the animal compared to exploring the object. Two-way ANOVA with Sidak’s multiple comparisons post-hoc test (*p < 0.05). Summary statistics for ANOVA results are displayed above the graphs. C, D Spectral density plots during exploration of the littermate or the object, respectively, for wildtype rats (N = 6) and E, F for Nrxn1α−/− (N = 7). G, H Plots displaying the percentage difference of spectral power during animal or object exploration (normalized to the power during the habituation phase), respectively. I Difference plots between spectral changes during animal exploration shown in G and object exploration shown in H. Data displayed as mean + SEM and tested with paired or unpaired CBPT. Colored bars (red or blue: AO vs. hab; gray: post vs.hab; light red or light blue: AO vs. post; black: WT vs. Nrxn1α−/−) above the graphs represent clusters with statistically significant differences.
Fig. 6
Fig. 6. Effects of GABAAδ receptor-mediated tonic inhibition on oscillatory activity and auditory-evoked responses.
AH Power spectral density plots showing the effect of Gaboxadol (3 mg/kg and 10 mg/kg) on oscillatory activity in Nrxn1α−/− (N = 10) and wildtype (N = 7) rats, respectively. A, B Spectrograms for frontal cortex, C, D parietal cortex, E, F MDT and G, H VMS. IP Effect of Gaboxadol on auditory-evoked potentials in Nrxn1α−/− (N = 10) and wildtype (N = 7) rats. I, J Average field potentials for frontal cortex, K, L parietal cortex, M, N MDT and O, P VMS. Data displayed as mean + SEM and tested with unpaired CBPT (for between genotype comparisons) and paired CBPT (within genotype across condition comparisons). Colored bars above the graphs represent clusters with statistically significant differences (black: Nrxn1α−/− vs. WT; other colors according to the legends).

References

    1. Dean C, Scholl FG, Choih J, DeMaria S, Berger J, Isacoff E, et al. Neurexin mediates the assembly of presynaptic terminals. Nat Neurosci. 2003;6:708–16. - PMC - PubMed
    1. Missler M, Zhang W, Rohlmann A, Kattenstroth G, Hammer RE, Gottmann K, et al. Alpha-neurexins couple Ca2+ channels to synaptic vesicle exocytosis. Nature. 2003;423:939–48. - PubMed
    1. Kattenstroth G, Tantalaki E, Südhof TC, Gottmann K, Missler M. Postsynaptic N-methyl-d-aspartate receptor function requires α-neurexins. Proc Natl Acad Sci USA. 2004;101:2607–12. - PMC - PubMed
    1. Etherton MR, Blaiss CA, Powell CM, Südhof TC. Mouse neurexin-1α deletion causes correlated electrophysiological and behavioral changes consistent with cognitive impairments. Proc Natl Acad Sci USA. 2009;106:17998–8003. - PMC - PubMed
    1. Reissner C, Runkel F. Missler M. Neurexins. Genome Biol. 2013;14:213. - PMC - PubMed

Publication types