. 2022 Oct 28;13(1):6435.
doi: 10.1038/s41467-022-34078-y.

The N6-methyladenosine methyltransferase METTL16 enables erythropoiesis through safeguarding genome integrity

Affiliations

The N6-methyladenosine methyltransferase METTL16 enables erythropoiesis through safeguarding genome integrity

Masanori Yoshinaga et al. Nat Commun. .

Abstract

During erythroid differentiation, the maintenance of genome integrity is key for the success of multiple rounds of cell division. However, molecular mechanisms coordinating the expression of DNA repair machinery in erythroid progenitors are poorly understood. Here, we discover that an RNA N6-methyladenosine (m6A) methyltransferase, METTL16, plays an essential role in proper erythropoiesis by safeguarding genome integrity via the control of DNA-repair-related genes. METTL16-deficient erythroblasts exhibit defective differentiation capacity, DNA damage and activation of the apoptotic program. Mechanistically, METTL16 controls m6A deposition at the structured motifs in DNA-repair-related transcripts including Brca2 and Fancm mRNAs, thereby upregulating their expression. Furthermore, a pairwise CRISPRi screen revealed that the MTR4-nuclear RNA exosome complex is involved in the regulation of METTL16 substrate mRNAs in erythroblasts. Collectively, our study uncovers that METTL16 and the MTR4-nuclear RNA exosome act as essential regulatory machinery to maintain genome integrity and erythropoiesis.


Conflict of interest statement

The authors declare no competing interests.

Figures

Fig. 1
Fig. 1. A genome-wide pooled CRISPR screen identifies novel RNA-binding proteins which regulate TfR1 expression.
a, b Workflow (a) and cell sorting strategy (b) of the genome-wide CRISPR screen for TfR1 regulators. c Gene ontology analysis of the TfR1 CRISPR screen hits. Statistical analysis was performed using Immuno-Navigator. d Volcano plot of TfR1 phenotype (casTLE Effect, the most likely effect size as determined by casTLE) and the confidence in that effect size (casTLE Score) from the CRISPR screen. The screen was performed in duplicate. eg Validation of the screen hits. Two gRNAs per gene were chosen for retests. K562-Cas9 cells were transduced with lentiviral vectors encoding individual gRNAs together with mCherry. Then cells were stained with anti-TfR1 antibody and analyzed using flow cytometry (e). Change in TfR1 expression levels between untransduced (mCherry−, gray) and transduced (mCherry+, red) were calculated and summarized (f, g). Each symbol represents the results of individual gRNAs. Data were pooled from two independent experiments. h, i Effects of wild-type or catalytic-dead mutant METTL16 (PP185/186AA, F187G) on surface TfR1 expression in the presence of DFO. Similar expression levels of wild-type or mutant METTL16 protein were confirmed (h). Surface TfR1 expression levels of cells expressing indicated gRNAs and proteins were examined by flow cytometry (i). Similar results were obtained in two independent experiments. Source data are provided as a Source Data file.
Fig. 2
Fig. 2. RNA methyltransferase METTL16 regulates erythroid differentiation in vivo.
a Mettl16 mRNA expression levels in each hematopoietic compartment (n = 3 technical replicates). HSC hematopoietic stem cells, MPP multipotent progenitors, CMP common myeloid progenitors, GMP granulocyte-monocyte progenitors, MEP megakaryocyte-erythrocyte progenitors. b Gene expression patterns of Mettl16 mRNA during erythroid differentiation generated from the single-cell RNA-seq analysis. c Survival rates of mice with each genotype. d Fetuses on E12.5 of control and Mettl16fl/flEpor-Cre+ mice. eg Flow cytometric analysis of the E10.5 peripheral blood from Mettl16fl/flEpor-Cre+ mice (e). The histogram of CD71 intensity (f) and the relative CD71 mean fluorescence intensity (MFI) in the gated population (g, n = 4–5 mice). Data were pooled from two independent experiments. h Flow cytometric analysis of the E11.5 FL from Mettl16fl/flEpor-Cre+ mice (n = 4–5 mice). i May-Grünwald-Giemsa stain of cytospin slides of E11.5 FL cells from Mettl16fl/flEpor-Cre+ mice. j The histogram of FSC intensity in each population in h. k Flow cytometric analysis of the E12.5 FL from Mettl16fl/flEpor-Cre+ mice. Data are expressed as mean ± SD (a, g, h). The p-values were calculated using two-tailed Student’s t-test (g, h). Images are representative of samples obtained from at least three mice (d and ik). Source data are provided as a Source Data file.
Fig. 3
Fig. 3. METTL16 is required for maintenance of erythroid identity and genome integrity.
a Heatmap showing the relative mRNA expression levels of erythroid-related and myeloid-related genes in the erythroblasts from E11.5 control and Mettl16fl/flEpor-Cre+ mice. b mRNA expression levels of erythroid-related and myeloid-related genes in the erythroblasts from control (n = 5 mice) and E11.5 Mettl16fl/flEpor-Cre+ mice (n = 4 mice). mRNA expression levels of genes were normalized to the expression level of β-actin (Actb). c GSEA plot showing the enrichment of the hallmarks of UV response and p53 pathway in erythroblasts from E11.5 Mettl16fl/flEpor-Cre+ mice. Statistical analysis was performed using GSEA software. d, e CD71+Ter119+ erythroblasts of the FL from E11.5 control and Mettl16fl/flEpor-Cre+ mice stained by Hoechst 33342 (red) and anti-γH2AX antibody (green) and analyzed by the confocal microscopy. Representative images of erythroblasts harboring γH2AX-positive micronuclei (arrowhead, d). The enumeration of micronuclei (MN) and γH2AX-positive MN containing cells. The positive cell numbers were divided by all of the analyzed cell numbers (e, n = 3–4 mice pooled from three independent experiments). f Hematoxylin and eosin (H&E, top) and immunohistochemical staining of cleaved caspase-3 (bottom) of the FL from E11.5 control and Mettl16fl/flEpor-Cre+ mice. Data are expressed as mean ± SD (b, e). The p-values were calculated using two-tailed Student’s t-test (b, e). Images are representative of samples obtained from three independent experiments (d, f). Source data are provided as a Source Data file.
Fig. 4
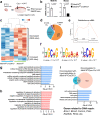
Fig. 4. METTL16 regulates the deposition of m6A modification on DNA-damage response-associated mRNAs.
a Outline of the in vitro erythroid culture experiments (Methods). b mRNA expression levels in cultured erythroblasts from E13.5 control and Mettl16fl/flCreERT2+ mice (n = 3 biological replicates). Data are expressed as mean ± SD. The p-values were calculated using two-tailed Student’s t-test. cf MeRIP-seq analyses using poly(A)+ RNAs in cultured erythroblasts from control and Mettl16fl/flCreERT2+ mice. Significantly differentially methylated sites were identified using RADAR (n = 3 independent experiments). c Heatmap showing the relative methylation levels at these sites. d The fractions within the 5′ UTR, CDS, 3′ UTR, and ncRNA. e The metagene distribution of the differentially methylated sites in mRNA. f Sequence motif logos identified from these sites. g, h GO analysis of downregulated (g) and upregulated (h) genes with hypomethylation in erythroblasts from Mettl16fl/flCreERT2+ mice. i Venn diagram comparing genes downregulated with hypomethylation in erythroblasts from Mettl16fl/flCreERT2+ mice and genes downregulated in CD71+Ter119+ erythroblasts from Mettl16fl/flEpor-Cre+ mice. The GO analysis revealed that DNA-repair-related genes were enriched in the intersect. Statistical analysis was performed using Immuno-Navigator (gi). Source data are provided as a Source Data file.
Fig. 5
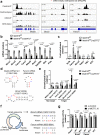
Fig. 5. Identification of METTL16-regulated motifs in DNA-repair-related transcripts.
a IGV snapshots of MeRIP-seq reads along indicated mRNAs. Red asterisk indicates differentially methylated sites identified by RADAR. b, c mRNA expression levels (b) and MeRIP-qPCR validation of m6A methylation levels (c) in the E13.5 in vitro cultured erythroblasts from control and Mettl16fl/flCreERT2+ (CKO) mice (n = 3 biological replicates). d Predicted secondary structures surrounding m6A peaks in Mat2a, Brca2, and Fancm mRNA. The ACAGAR boxes were shown in red and the m6A modification sites were shown in blue. e SELECT validation of the indicated m6A sites using total RNAs of the E13.5 cultured erythroblasts from control and Mettl16fl/flCreERT2+ mice (n = 3 biological replicates). f, g Dual-luciferase reporter assay to identify METTL16-regulated transcripts. f pmirGLO reporter vector encoding firefly and renilla luciferase were used. Indicated wild-type (WT) and mutant (Mut) sequences were inserted at the 3′ end of the firefly luciferase. g Luciferase reporter activity of indicated reporters under METTL16 knockdown in HEK293T cells (n = 3 biological replicates). Renilla luciferase activity was used as an internal control. Firefly luciferase activity was further normalized to the value of the reporter harboring 3′ UTR of Gapdh mRNA, which has been reported to have no m6A modification sites. Data are expressed as mean ± SD (b, c, e, g). The p-values were calculated using two-tailed Student’s t-test (b, c, e, g). ns not significant. Source data are provided as a Source Data file.
Fig. 6
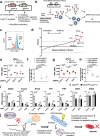
Fig. 6. METTL16-mediated mRNA regulation requires MTR4-nuclear RNA exosome complex.
a, b Workflow of the pairwise CRISPR screen for genetic interaction analysis. Top 500 TfR1 regulators were selected from the initial genome-wide CRISPR screen results. Then a dual gRNA expression library (M16GI) was constructed (a). K562-CRISPRi cells were transduced with the M16GI gRNA library and then cells were sorted according to the surface TfR1 expression (b, c). d Results of the pairwise CRISPR screen. Genes were sorted by T-score, which indicates the degrees of genetic interaction with METTL16. eh Validation of the screen hits. Two gRNAs per gene were chosen for validation experiments. K562-CRISPRi cells were transduced with lentiviral vectors encoding individual dual gRNAs. Then cells were treated with DFO overnight, stained with anti-TfR1 antibody and analyzed using flow cytometry (e, g). Change in TfR1 expression levels [(MFI of METTL16-sufficient cells − MFI of METTL16-deficient cells) / MFI of METTL16-sufficient cells] in each condition were summarized (f, h, n = 3 biological replicates from independent experiments for MTR4, n = 4 for DIS3). Horizontal lines indicate the mean. i mRNA expression levels of indicated genes in the cultured erythroblasts from control and Mettl16fl/flCreERT2+ mice which were nucleofected with indicated crRNAs and Cas9 complexes (n = 3 biological replicates from independent experiments). j Model overview of METTL16-mediated mRNA regulation in developing erythroid cells, where METTL16 expression is upregulated. METTL16 regulates m6A deposition on transcripts of DNA-repair-related genes. The m6A deposition regulates the expression of these genes in a manner dependent on the MTR4-nuclear exosome, thereby safeguarding genome integrity and erythropoiesis. Data are expressed as mean ± SD (i). The p-values were calculated using two-tailed Student’s t-test (ei). ns not significant. Source data are provided as a Source Data file.

References

    1. Hattangadi SM, Wong P, Zhang L, Flygare J, Lodish HF. From stem cell to red cell: regulation of erythropoiesis at multiple levels by multiple proteins, RNAs, and chromatin modifications. Blood. 2011;118:6258–6268. - PMC - PubMed
    1. Palis J. Primitive and definitive erythropoiesis in mammals. Front. Physiol. 2014;5:3. - PMC - PubMed
    1. Nandakumar SK, Ulirsch JC, Sankaran VG. Advances in understanding erythropoiesis: evolving perspectives. Br. J. Haematol. 2016;173:206–218. - PMC - PubMed
    1. Moriguchi T, Yamamoto M. A regulatory network governing Gata1 and Gata2 gene transcription orchestrates erythroid lineage differentiation. Int. J. Hematol. 2014;100:417–424. - PubMed
    1. Maeda T. Regulation of hematopoietic development by ZBTB transcription factors. Int. J. Hematol. 2016;104:310–323. - PMC - PubMed

Publication types