. 2022 Oct 28;13(1):6436.
doi: 10.1038/s41467-022-34157-0.

The immune synapses reveal aberrant functions of CD8 T cells during chronic HIV infection

Affiliations

The immune synapses reveal aberrant functions of CD8 T cells during chronic HIV infection

Nadia Anikeeva et al. Nat Commun. .

Abstract

Chronic HIV infection causes persistent low-grade inflammation that induces premature aging of the immune system including senescence of memory and effector CD8 T cells. To uncover the reasons of gradually diminished potency of CD8 T cells from people living with HIV, here we expose the T cells to planar lipid bilayers containing ligands for T-cell receptor and a T-cell integrins and analyze the cellular morphology, dynamics of synaptic interface formation and patterns of the cellular degranulation. We find a large fraction of phenotypically naive T cells from chronically infected people are capable to form mature synapse with focused degranulation, a signature of a differentiated T cells. Further, differentiation of aberrant naive T cells may lead to the development of anomalous effector T cells undermining their capacity to control HIV and other pathogens that could be contained otherwise.


Conflict of interest statement

M.R.B. is a consultant for Interius BioTherapeutics. No other conflicts are reported by the authors.

Figures
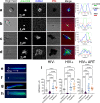
Fig. 1
Fig. 1. Human polyclonal CD8 T cells establish diverse synaptic interfaces with lipid bilayers that display labeled anti-CD3 antibody and ICAM-1 ligands.
The images were taken by confocal microscope every 2 min over 30 min. Representative images of T cell-bilayer interface taken at the end of the observation period are shown: mature synapse (a), TCR/CD3 focal synapse (b), kinapse (c) and multifocal synapse (d). IRM images show contacts of CD8 T cells with the bilayer surface as dark area on light background. Histograms depict the fluorescent intensity profiles along the diagonal white lines in overlay images. Distance is measured in pixels. Blue: ICAM-1, green: anti-CD3, red: IRM. Scale bars: 5 μm. Representative kymographs show temporal changes in spatial position of ICAM-1 (blue) and anti-CD3 antibodies (green): mature synapse (e), TCR/CD3 focal interface (f), kinapse (g) and multifocal synapse (h). White oval indicates the position of the cell/bilayer interface at the initial contact of T cell with a bilayer surface, and time axis indicates temporal changes in the spatial position of ICAM-1 and CD3 locations. i Variations in adhesion area of CD8 T cells establishing different synaptic interfaces. The adhesion areas were determined from IRM images. For each donor group, the results of representative experiment are shown. The dots on the graphs present individual cells that form mature synapses, TCR/CD3 focal interfaces, kinapses, and multifocal synapses; HIV−: n = 30, 25, 10, 11; HIV+: n = 22, 10, 10, 11; HIV+ ART: n = 52, 18, 14, 15 cells, respectively. Means with SDs are indicated. Adjusted p values were calculated by ordinary one-way ANOVA with Tukey multiply comparison test, and the values are displayed on the top of the graphs. Data (ai) represent one out of three independent experiments for HIV- donor group and one out of two independent experiments for each group of infected donors.
Fig. 2
Fig. 2. Fraction size of CD8 T cells accumulating ICAM-1 at synaptic interface depends on T cell differentiation stage and donors’ status.
CD8 T cells derived from PBMC of HIV− or chronic HIV+ or ART-treated HIV+ individuals were subdivided into CD27+, CD27-CD45RO+ and CD27-CD45RO− subsets by magnetic sorting. Isolated T cell subsets were exposed to bilayers containing labeled anti-CD3 and ICAM-1 molecules, and ICAM-1 accumulation were observed at the interface for 30 min. Bar graphs with error bars indicate mean values with SDs. Each dot point represents independent experiment (N = 3 for each donor group). The differences between fraction size within a subject group were determined using ordinary one-way ANOVA with Tukey multiply comparison test; exact adjusted p values indicated on the top of the graphs. Source data are provided as a source data file.
Fig. 3
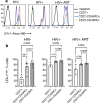
Fig. 3. CD27 + CD8 T cells from donors with chronic HIV infection contain significantly higher fraction of cells with upregulated LFA-1 expression, and ART treatment only partially reduce the size of the fraction to a normal level.
The CD8 T cells subsets were isolated by magnetic sorting, stained with anti-LFA antibodies and analyzed by Flow Cytometry. a Representative flow histograms showing LFA-1 expression by CD27+, CD27-CD45RO+ and CD27-CD45RO- CD8 T cells derived from HIV−, chronic HIV+, and ART-treated HIV+ donors. b Frequency of CD8 T cell subsets with high LFA-1 expression for HIV−, chronic HIV+, and ART-treated HIV+ individuals. For each subset, mean with SD shown as bar graph with error bar. Each dot point represent independent experiment; HIV−: N = 5, HIV+: N = 3, HIV + ART: N = 3. Exact p values calculated by ordinary one-way ANOVA with Tukey multiply comparison test and indicated on the top of the graphs. Source data are provided as a source data file.
Fig. 4
Fig. 4. Dissimilarity of the synaptic interfaces established by polyclonal human CD8 T cells from HIV-, chronic HIV+ and ART-treated HIV+ individuals is most pronounce at early stage of differentiation.
CD27+, CD27-CD45RO+ and CD27-CD45RO− subsets of CD8 T cells from HIV-, chronic HIV+ and ART-treated HIV+ individuals were isolated by magnetic sorting and loaded on bilayers containing anti-CD3 antibodies and ICAM-1. The formation of synaptic interfaces was observed for 30 min by confocal microscopy. a 3D plots represent frequency of CD27+, CD27-CD45RO+, and CD27-CD45RO− CD8 T subsets that form mature synapses, TCR/D3 focal interfaces, multifocal synapses and kinapses at a T cell-bilayer interface. Infection status of donors are indicated at the bottom of the plots. Mean values from three independent experiments for each donor group are shown. b Ability of T cells from HIV−, HIV+, and ART-treated HIV+ individuals to form interfaces of different structures are compared within CD27+CD8 T cell subset. Bar graphs with error bars indicate means values with SDs. Each dot point represents independent experiment (N = 3 for each donor group). The difference between subject groups was determined using ordinary one-way ANOVA with Tukey multiply comparison test; exact p values indicated on the graphs. Source data are provided as a source data file.
Fig. 5
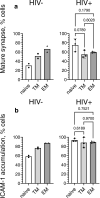
Fig. 5. Naive CD8 T cells from untreated HIV+ individuals exhibit greater capacity to accumulate ICAM-1 and form mature synapse compared to T cells from HIV- individuals.
Naive, transitional and effector memory CD8 T cells were exposed to bilayers containing anti-CD3 antibodies and ICAM-1, and formation of mature synapses was observed at 30 min. Frequency of naive, transitional and effector memory T cells establishing mature synapse (a) and accumulating ICAM-1 molecules at interface (b) are shown. Infection status of individuals are indicated. Two independent experiments were done for HIV− donor group, and data are expressed as average values. Three independent experiments were done for HIV+ subject group and presented as mean with SDs. Each dot point indicate independent experiment. Statistical difference was analyzed by ordinary one-way ANOVA with Tukey multiply comparison test; p values are indicated on the graph (HIV+ donor group). Source data are provided as a source data file.
Fig. 6
Fig. 6. Structure of CD8 T cell-bilayer interface is linked to patterns and kinetics of T cells degranulation.
CD8 T cells were exposed to the bilayers containing anti-CD3 antibodies and ICAM-1 in the presence of anti-CD107a Fab fragments. Structure of the interface and cellular degranulation was observed for half an hour after the initial cell contacts with the bilayers using TIRF (anti-CD3 and anti-CD107a antibodies) and wide field fluorescence (ICAM-1) microscopy. Representative images show relative positioning of degranulation foci (red), andi-CD3 antibodies (green) and ICAM-1 molecules (blue) at the interface of T cells that form a mature synapse, b TCR/CD3 focal interface, c kinapse and d multifocal synapse. Images were taken at 30 min after T cell loading on bilayers. Scale bars designate 5 μm. Representative kymographs show temporal changes in spatial positioning of ICAM-1 (blue) and granules (red) released at interface of CD8 T cells forming mature synapse (e), TCR/CD3 focal interface (f), kinapse (g), and multifocal synapse (h). Images were taken at the rate of one frame/min for 30 min. White ovals indicate initial position of cell-bilayer interfaces, white arrows show time axis. The images are representative from two independent experiments for HIV− donor group and three independent experiments for HIV+ subject group, n = 247, 91, 39, 71 cells forming mature synapses, TCR/CD3 focal interfaces, kinapses, and multifocal synapses, respectively.
Fig. 7
Fig. 7. Intensity and quality of degranulation depends on stage of T cell differentiation and type of synaptic interface.
Naive, TM and EM CD8 T cell subsets were isolated by flow cytometry and placed on bilayers containing anti-CD3 antibodies and ICAM-1 in the presence of anti-CD107a Fab fragments. Granule release location and anti-CD3 accumulation were observed by TIRF microscopy, ICAM-1 accumulation was imaged with wide-field microscopy. CD107a accumulation measured at 30 min of initial T cell contact with bilayer surface. a CD107a levels measured at mature synapses (blue empty circles) and TCR/CD3 focal synapses (black empty circles) formed by naive CD8 T cells. Infection status of donors indicated at the top of the plot. Each dot represents individual cell; mature: n = 16 (HIV−) and n = 15 (HIV+), focal: n = 13 (HIV−) and n = 5 (HIV+). Geometric means with geometrical standard deviation factors shown by black lines. Nonparametric unpaired two-tailed Mann–Whitney test was exploited to determine p values. b Representative surface intensity plots showing naive CD8 T cell degranulation at mature and TCR/CD3 focal synapses. The plots are displayed in pseudo-color scale. c Quantitation of CD107a accumulation at the interface of naive, TM and EM CD8 T cells from HIV- and untreated HIV+ individuals. Each circle represents individual T cell, HIV−: n = 30 (naive), 31 (TM), 34 (EM) and HIV+: n = 42 (naive), 52 (TM), 32 (EM) cells. Geometric means are indicated by black lines, error bars represent SD factors. P values are determined by nonparametric unpaired Kruskal–Wallis test with Dunn’s test for multiple comparison. ac Representative results of one out of three (untreated HIV+ donors) and one out of two (HIV− donors) independent experiments are shown. Source data are provided as a source data file.

Similar articles

Cited by

References

    1. Callan MF, et al. Large clonal expansions of CD8+ T cells in acute infectious mononucleosis. Nat. Med. 1996;2:906–911. - PubMed
    1. Zhang N, Bevan MJ. CD8(+) T cells: foot soldiers of the immune system. Immunity. 2011;35:161–168. - PMC - PubMed
    1. Walker, B. & McMichael, A. The T-cell response to HIV. Cold Spring Harb. Perspect. Med.2, a007054 (2012). - PMC - PubMed
    1. Collins DR, Gaiha GD, Walker BD. CD8(+) T cells in HIV control, cure and prevention. Nat. Rev. Immunol. 2020;20:471–482. - PMC - PubMed
    1. Schmitz JE, et al. Control of viremia in simian immunodeficiency virus infection by CD8+ lymphocytes. Science. 1999;283:857–860. - PubMed

Publication types