. 2022 Oct 28;8(1):44.
doi: 10.1038/s41526-022-00232-5.

The ex vivo human translaminar autonomous system to study spaceflight associated neuro-ocular syndrome pathogenesis

Affiliations

The ex vivo human translaminar autonomous system to study spaceflight associated neuro-ocular syndrome pathogenesis

Michael Peng et al. NPJ Microgravity. .

Abstract

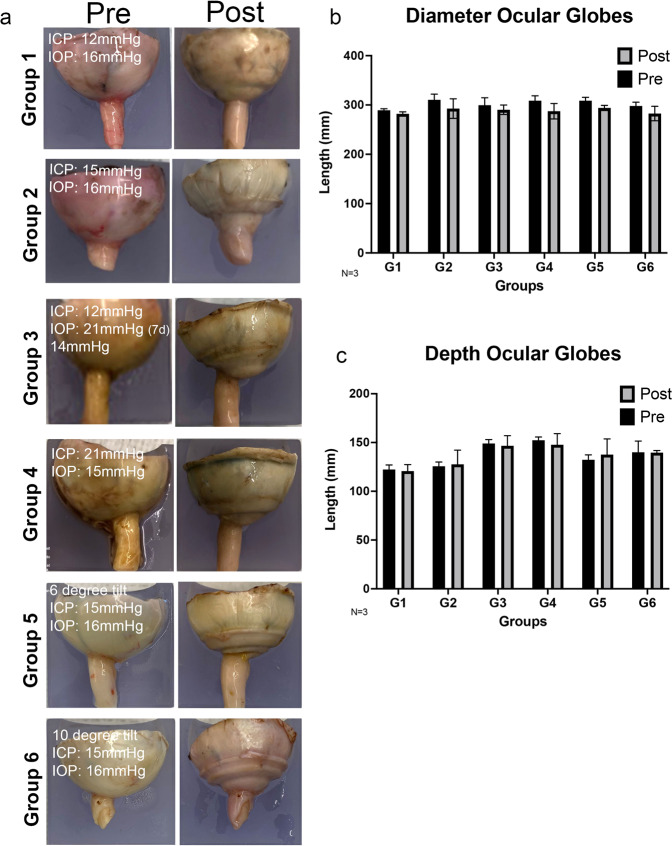
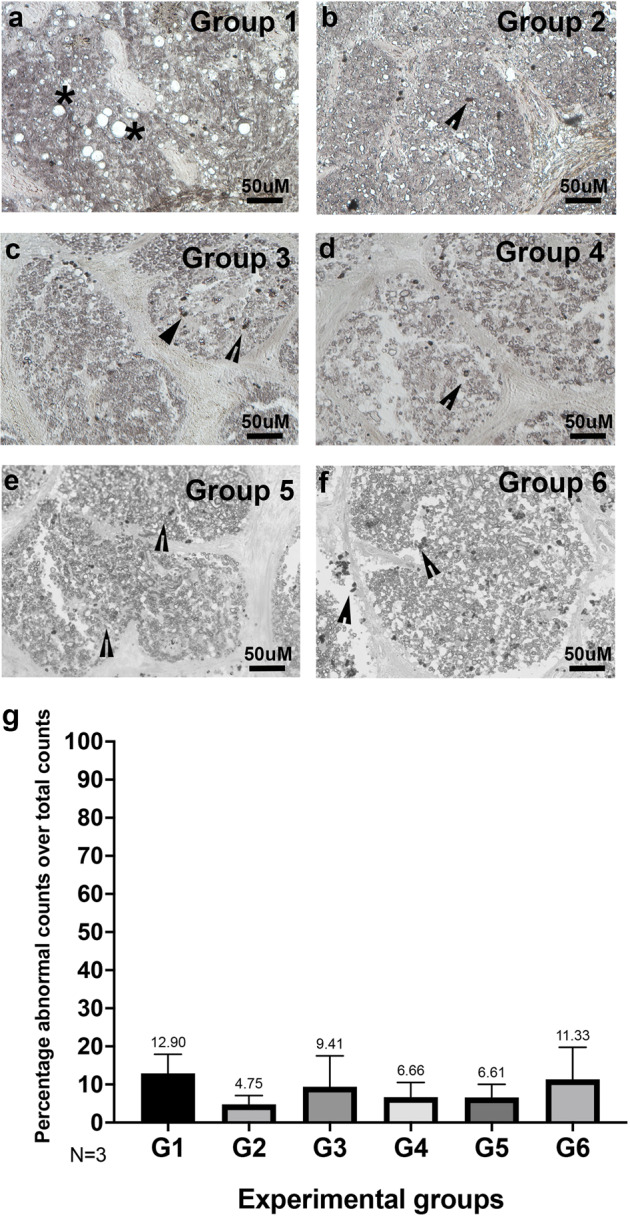
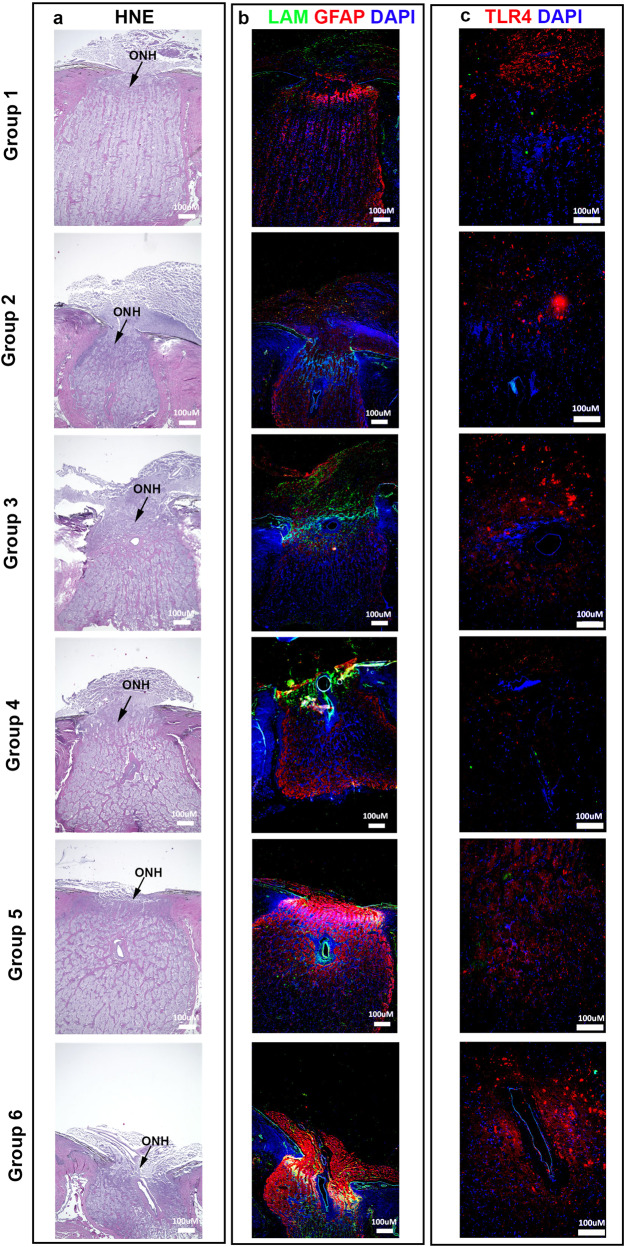
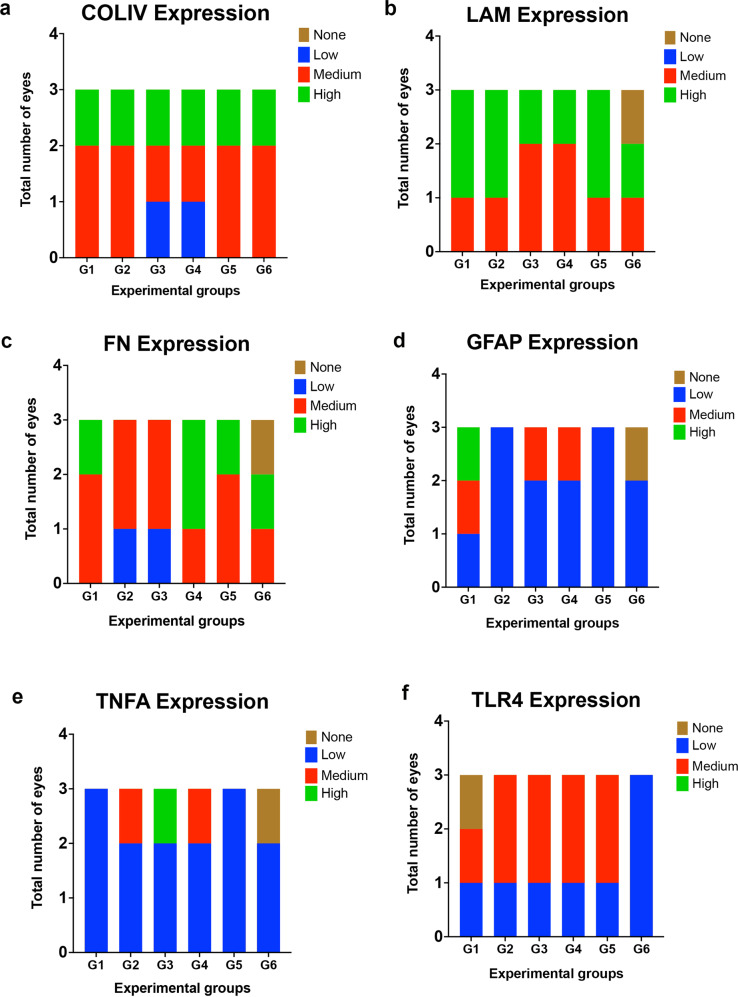
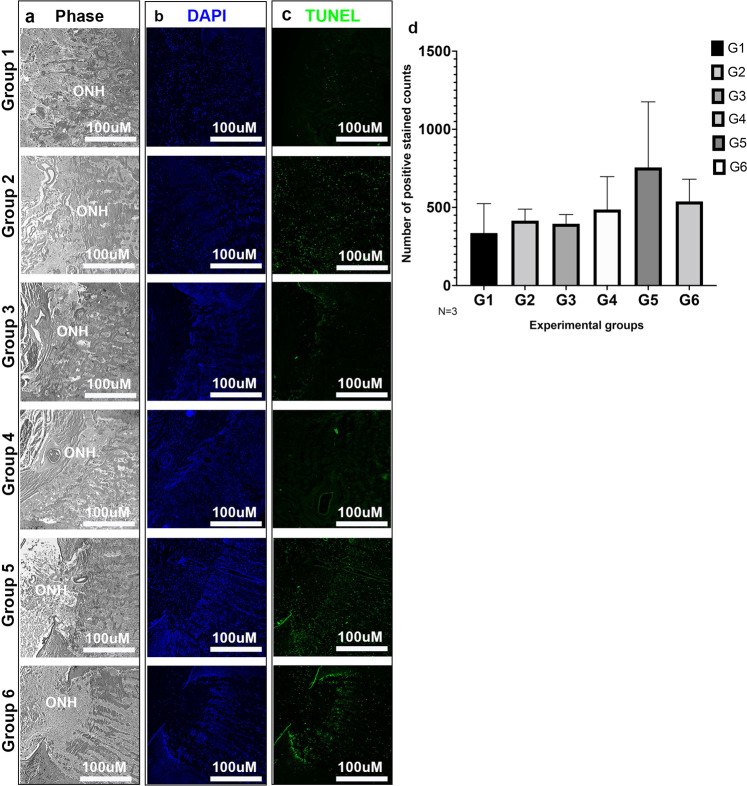
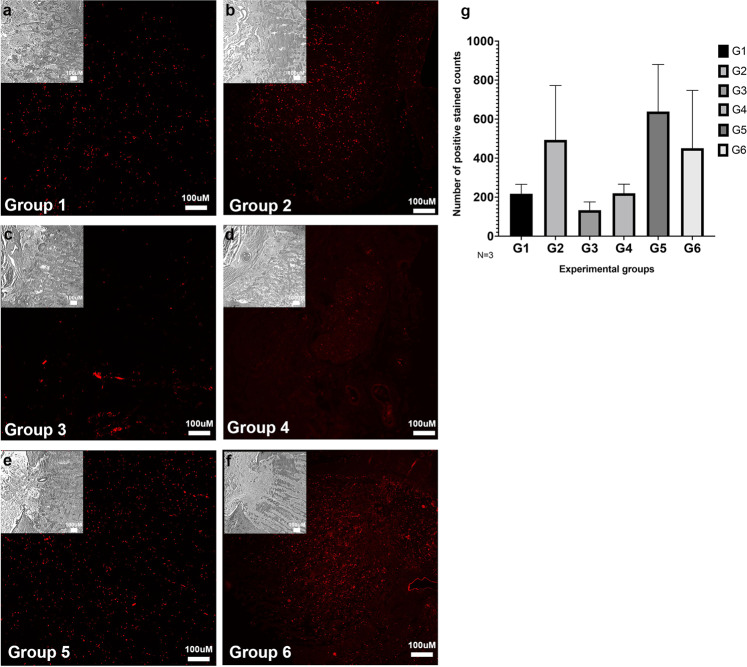
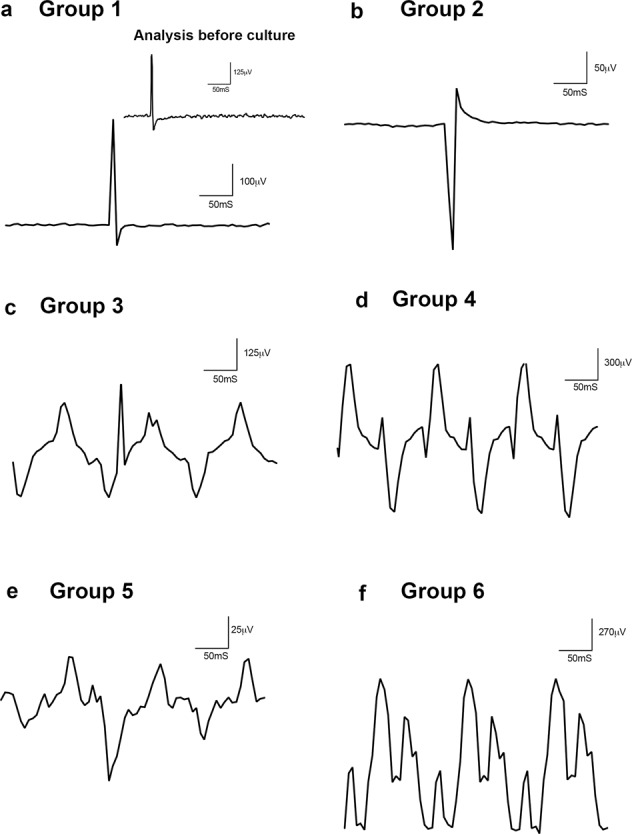
Spaceflight-Associated Neuro-ocular Syndrome (SANS) is a significant unexplained adverse reaction to long-duration spaceflight. We employ an ex vivo translaminar autonomous system (TAS) to recreate a human ocular ground-based spaceflight analogue model to study SANS pathogenesis. To recapitulate the human SANS conditions, human ocular posterior segments are cultured in the TAS model for 14 days. Translaminar pressure differentials are generated by simulating various flow rates within intracranial pressure (ICP) and intraocular (IOP) chambers to maintain hydrostatic pressures of ICP: IOP (12:16, 15:16, 12:21, 21:16 mmHg). In addition, optic nerves are mechanically kinked by 6- and 10-degree tilt inserts for the ICP: IOP;15:16 mmHg pressure paradigm. The TAS model successfully maintains various pressure differentials for all experimental groups over 14 days. Post culture, we determine inflammatory and extracellular component expression changes within posterior segments. To further characterize the SANS pathogenesis, axonal transport capacity, optic nerve degeneration and retinal functional are measured. Identifiable pathogenic alterations are observed in posterior segments by morphologic, apoptotic, and inflammatory changes including transport and functional deficits under various simulated SANS conditions. Here we report our TAS model provides a unique preclinical application system to mimic SANS pathology and a viable therapeutic testing device for countermeasures.


Conflict of interest statement

The authors declare no competing non-financial interests but the following competing financial interests for the patent application of the Translaminar Autonomous System is under the patent application-U.S. Patent Application No. 16/395,610.

Figures

Fig. 1
Fig. 1. Maintenance of translaminar pressure difference.
Graphical representation of sum of mean TLPD (difference in mmHg of IOP-ICP every 24 h) pressures being maintained for (a) Group 1, (b) Group 2, (c) Group 3, (d) Group 4, (e) Group 5 and (f) Group 6. ICP intracranial pressure, IOP intraocular pressure, TLPD translaminar pressure difference, N = 3. Data are presented as mean ± standard error of the mean and P < 0.05 was considered statistically significant.
Fig. 2
Fig. 2. Analysis of posterior human globes pre and post culture in the TAS model.
a Representative images of posterior globes pre and post 14 days perfusion culture. Graphical representation of pre-post values of (b) diameter and (c) depth of posterior globes (N = 3). Length in pixels calculated from Adobe Photoshop. ICP intracranial pressure, IOP intraocular pressure. Data are presented as mean ± standard error of the mean and P < 0.05 was considered statistically significant.
Fig. 3
Fig. 3. Expression of retinal markers with increase in apoptosis and inflammation in experimental groups post culture.
Heatmap of (a) retinal markers and (b) apoptotic and inflammatory markers in control and experimental groups (N = 3). Mean fold values are indicated for each marker. G1 group 1, G2 group 2, G3 group 3, G4 group 4, G5 group 5, G6 group 6.
Fig. 4
Fig. 4. Extracellular matrix secretion observed in ICP and IOP chamber conditioned medium of experimental groups.
Conditioned medium collected from the IOP and ICP chambers of every group throughout 14-day perfusion culture. Densitometric values normalized to control after Western blot analysis was evaluated for expression of (a) FN and (b) COLIV. ICP intracranial pressure, IOP intraocular pressure, G1 group 1, G2 group 2, G3 group 3, G4 group 4, G5 group 5, G6 group 6, N = 3. Data are presented as mean ± standard error of the mean and P < 0.05 was considered statistically significant.
Fig. 5
Fig. 5. Degeneration of optic nerve axons observed under experimental conditions.
Paraphenylenediamine (PPD) staining of the optic nerve was utilized to assess degeneration of axons within the nerves of (a) Group 1, (b) Group 2, (c) Group 3, (d) Group 4, (e) Group 5 and (f) Group 6 cultured for 14 days within the TAS model. Normal and healthy axons (asterix); damaged or dying axons (arrowhead). af 400x magnification. g Ratio of abnormal to total axon counts normalized to control, N = 3. Data are presented as mean ± standard error of the mean and P < 0.05 was considered statistically significant.
Fig. 6
Fig. 6. Morphological restructuring of the optic nerve head after perfusion culture.
Cross sections of human ONH depict (a) H&E staining of Group 1, Group 2, Group 3, Group 4, Group 5 and Group 6. Expression of (b) LAM, GFAP with DAPI in the ONH of all 6 groups. Expression of (c) TLR4 with DAPI in the ONH of all 6 groups. LAM = green; GFAP, TLR4 = red; DAPI = blue; a, b 40x magnification; c 100x magnification. H&E hematoxylin and eosin stain, ONH optic nerve head.
Fig. 7
Fig. 7. Expression of inflammatory markers at the optic nerve head after perfusion culture.
Expression within all groups (a) COLIV, (b) LAM, (c) FN, (d) GFAP, (e) TNFα and (f) TLR4 as graded by blinded observer. Color coding for expression patterns; brown = none, blue = low, red = medium, and green = high, N = 3.
Fig. 8
Fig. 8. Increased TUNEL positive cells identified within the optic nerve head of experimental groups.
Cross sections of human ONH depicting (a) phase contrast micrographs of Group 1, Group 2, Group 3, Group 4, Group 5 and Group 6. Expression of (b) DAPI in the ONH of all 6 groups. Expression of (c) TUNEL positive cells in the ONH of all 6 groups and (d) quantification of TUNEL positive cells. DAPI = blue; TUNEL stain = green; ac 100x magnification; TAS translaminar autonomous system, ONH optic nerve head, N = 3. Data are presented as mean ± standard error of the mean and P < 0.05 was considered statistically significant.
Fig. 9
Fig. 9. Minimal expression of Cholera Toxin B within the optic nerve head cross-sections.
Human ONH depicting phase contrast micrographs (insets) and expression of cholera toxin B (CTB) within (a) Group 1, (b) Group 2, (c) Group 3, (d) Group 4, (e) Group 5, (f) Group 6 cross sections and (g) quantification of all CTB positive cells within all 6 groups. af 100x magnification; CTB = red, N = 3. Data are presented as mean ± standard error of the mean and P < 0.05 was considered statistically significant.
Fig. 10
Fig. 10. Increased retinal dysfunction with high IOP and tortuous ON conditions.
Full field flash ERG recordings on retinas after 14 days perfusion culture. The amplitudes of scotopic threshold responses were measured from the baseline to the positive peak of each waveform and latency measured by time-to-peak major positive deflection for (a) Group 1, inset- analysis before culture of a fresh postmortem human retina, (b) Group 2, (c) Group 3, (d) Group 4, (e) Group 5 and (f) Group 6 from 0.3 mcd.s/m2 to 1000 mcd.s/m2.

References

    1. Kramer LA, Sargsyan AE, Hasan KM, Polk JD, Hamilton DR. Orbital and intracranial effects of microgravity: findings at 3-T MR imaging. Radiology. 2012;263:819–827. - PubMed
    1. Williams D, Kuipers A, Mukai C, Thirsk R. Acclimation during space flight: effects on human physiology. CMAJ. 2009;180:1317–1323. - PMC - PubMed
    1. Mader TH, et al. Optic disc edema, globe flattening, choroidal folds, and hyperopic shifts observed in astronauts after long-duration space flight. Ophthalmology. 2011;118:2058–2069. - PubMed
    1. Michael AP, Marshall-Bowman K. Spaceflight-induced intracranial hypertension. Aerosp. Med. Hum. Perform. 2015;86:557–562. - PubMed
    1. Lawley JS, et al. Effect of gravity and microgravity on intracranial pressure. J. Physiol. 2017;595:2115–2127. - PMC - PubMed