

Biosynthetic regulatory network of flavonoid metabolites in stems and leaves of Salvia miltiorrhiza
- PMID: 36307498
- PMCID: PMC9616839
- DOI: 10.1038/s41598-022-21517-5
Biosynthetic regulatory network of flavonoid metabolites in stems and leaves of Salvia miltiorrhiza
Abstract
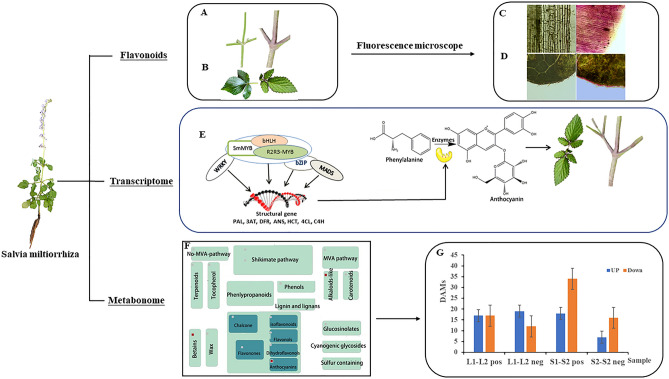
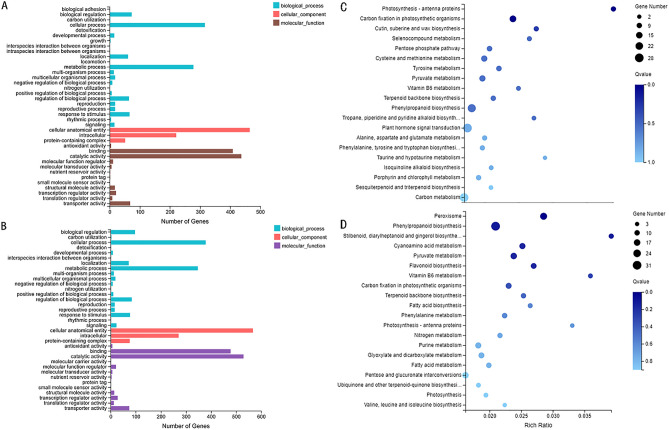
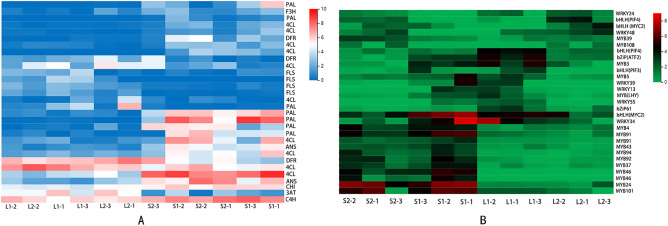
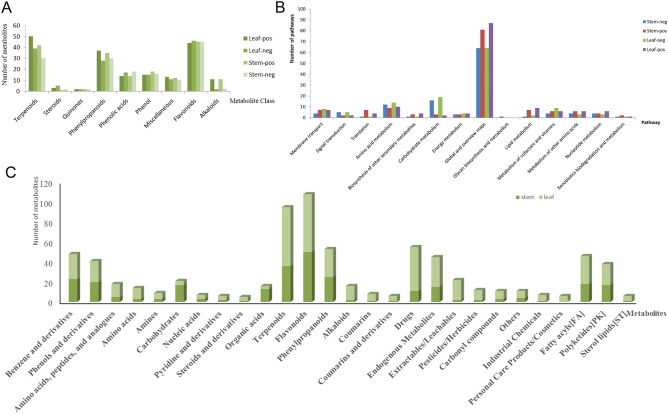
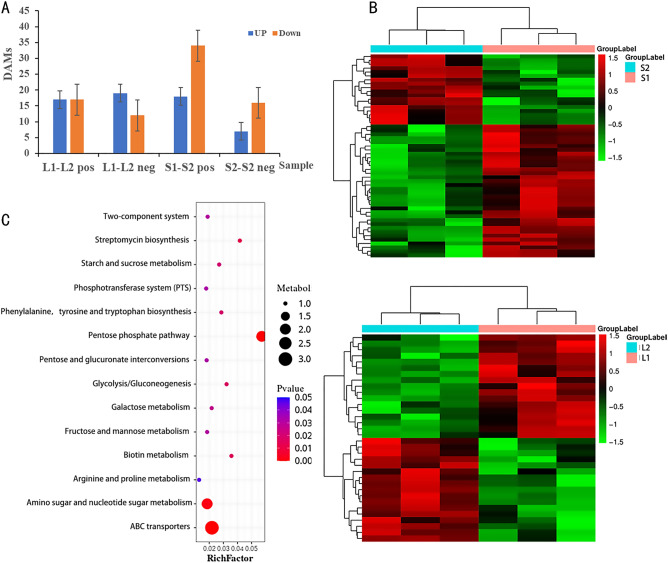
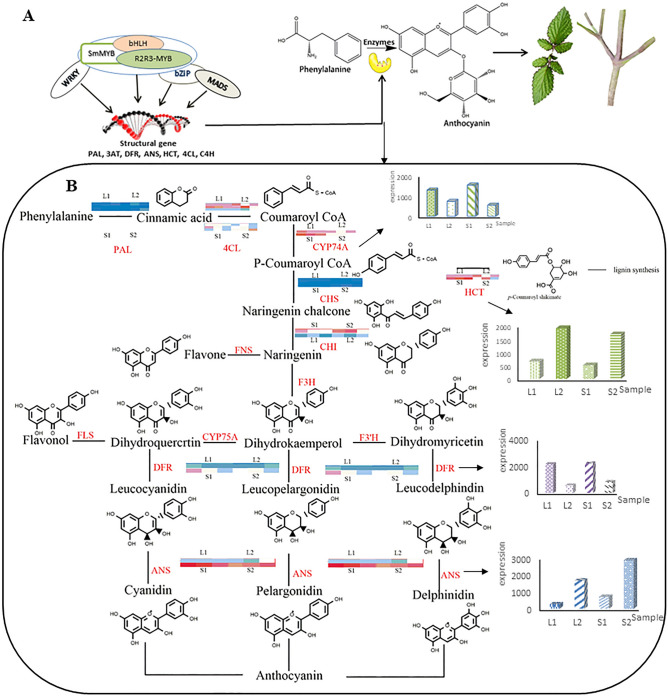
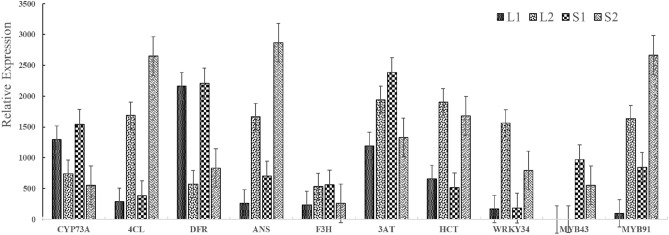
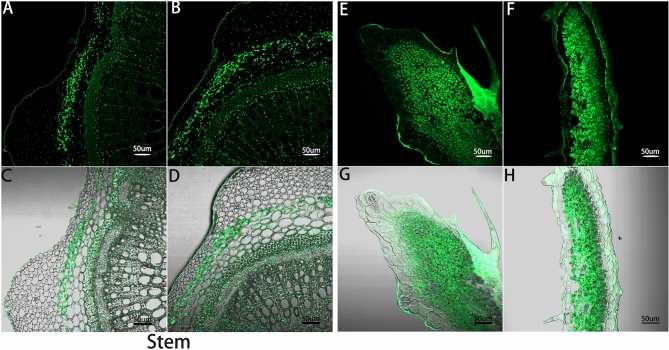
Flavonoid secondary metabolites can treat and prevent many diseases, but systematic studies on regulation of the biosynthesis of such metabolites in aboveground parts of Salvia miltiorrhiza are lacking. In this study, metabonomic and transcriptomic analyses of different S. miltiorrhiza phenotypes were conducted to explore pathways of synthesis, catalysis, accumulation, and transport of the main flavonoid secondary metabolites regulating pigment accumulation. Tissue localization and quantitative analysis of flavonoid secondary metabolites were conducted by laser scanning confocal microscopy (LSCM). A total 3090 differentially expressed genes were obtained from 114,431 full-length unigenes in purple and green phenotypes, and 108 functional genes were involved in flavonoid biosynthesis. Five key phenylpropane structural genes (PAL, 4CL, ANS, 3AT, HCT) were highly differentially expressed, and four transcription factor genes (MYB, WRKY, bHLH, bZiP) were identified. In addition, six GST genes, nine ABC transporters, 22 MATE genes, and three SNARE genes were detected with key roles in flavonoid transport. According to LSCM, flavonoids were mainly distributed in epidermis, cortex, and collenchyma. Thus, comprehensive and systematic analyses were used to determine biosynthesis, accumulation, and transport of flavonoids in stems and leaves of different S. miltiorrhiza phenotypes. The findings will provide a reference for flavonoid production and cultivar selection.
© 2022. The Author(s).
Conflict of interest statement
The authors declare no competing interests.
Figures
Similar articles
-
Integrated metabolomic and transcriptomic analysis of the anthocyanin regulatory networks in Salvia miltiorrhiza Bge. flowers.BMC Plant Biol. 2020 Jul 23;20(1):349. doi: 10.1186/s12870-020-02553-7. BMC Plant Biol. 2020. PMID: 32703155 Free PMC article.
-
Identification and Characterization of Flavonoid Biosynthetic Enzyme Genes in Salvia miltiorrhiza (Lamiaceae).Molecules. 2018 Jun 16;23(6):1467. doi: 10.3390/molecules23061467. Molecules. 2018. PMID: 29914175 Free PMC article.
-
Metabolomic and transcriptomic analyses highlight metabolic regulatory networks of Salvia miltiorrhiza in response to replant disease.BMC Plant Biol. 2024 Jun 18;24(1):575. doi: 10.1186/s12870-024-05291-2. BMC Plant Biol. 2024. PMID: 38890577 Free PMC article.
-
MAPKK2/4/5/7-MAPK3-JAZs modulate phenolic acid biosynthesis in Salvia miltiorrhiza.Phytochemistry. 2022 Jul;199:113177. doi: 10.1016/j.phytochem.2022.113177. Epub 2022 Mar 28. Phytochemistry. 2022. PMID: 35358599 Review.
-
Accumulation characteristics of plant flavonoids and effects of cultivation measures on their biosynthesis: A review.Plant Physiol Biochem. 2024 Oct;215:108960. doi: 10.1016/j.plaphy.2024.108960. Epub 2024 Jul 23. Plant Physiol Biochem. 2024. PMID: 39079230 Review.
Cited by
-
Transcriptome and Metabolome Profiling Provide Insights into Flavonoid Synthesis in Acanthus ilicifolius Linn.Genes (Basel). 2023 Mar 20;14(3):752. doi: 10.3390/genes14030752. Genes (Basel). 2023. PMID: 36981022 Free PMC article.
-
Integration of genome-wide association studies, metabolomics, and transcriptomics reveals phenolic acid- and flavonoid-associated genes and their regulatory elements under drought stress in rapeseed flowers.Front Plant Sci. 2024 Jan 11;14:1249142. doi: 10.3389/fpls.2023.1249142. eCollection 2023. Front Plant Sci. 2024. PMID: 38273941 Free PMC article.
-
Transcriptomic Analysis Reveals the Flavonoid Biosynthesis Pathway Involved in Rhizome Development in Polygonatum cyrtonema Hua.Plants (Basel). 2024 May 31;13(11):1524. doi: 10.3390/plants13111524. Plants (Basel). 2024. PMID: 38891332 Free PMC article.
-
The Influence of Sodium Humate on the Biosynthesis and Contents of Flavonoid Constituents in Lemons.Plants (Basel). 2024 Oct 15;13(20):2888. doi: 10.3390/plants13202888. Plants (Basel). 2024. PMID: 39458835 Free PMC article.
-
Transcriptome Analysis of Onobrychis viciifolia During Seed Germination Reveals GA3-Inducible Genes Associated with Phenylpropanoid and Hormone Pathways.Int J Mol Sci. 2025 Mar 6;26(5):2335. doi: 10.3390/ijms26052335. Int J Mol Sci. 2025. PMID: 40076954 Free PMC article.
References
Publication types
MeSH terms
Substances
LinkOut - more resources
Full Text Sources
Research Materials
