. 2022 Oct 28;12(1):18168.
doi: 10.1038/s41598-022-17832-6.

Smoking modulates different secretory subpopulations expressing SARS-CoV-2 entry genes in the nasal and bronchial airways

Affiliations

Smoking modulates different secretory subpopulations expressing SARS-CoV-2 entry genes in the nasal and bronchial airways

Ke Xu et al. Sci Rep. .

Abstract

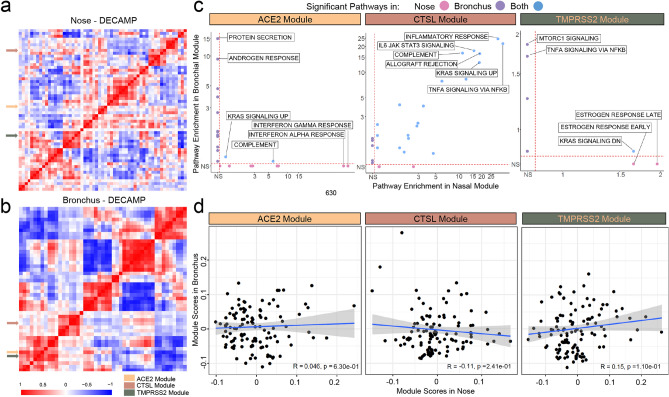
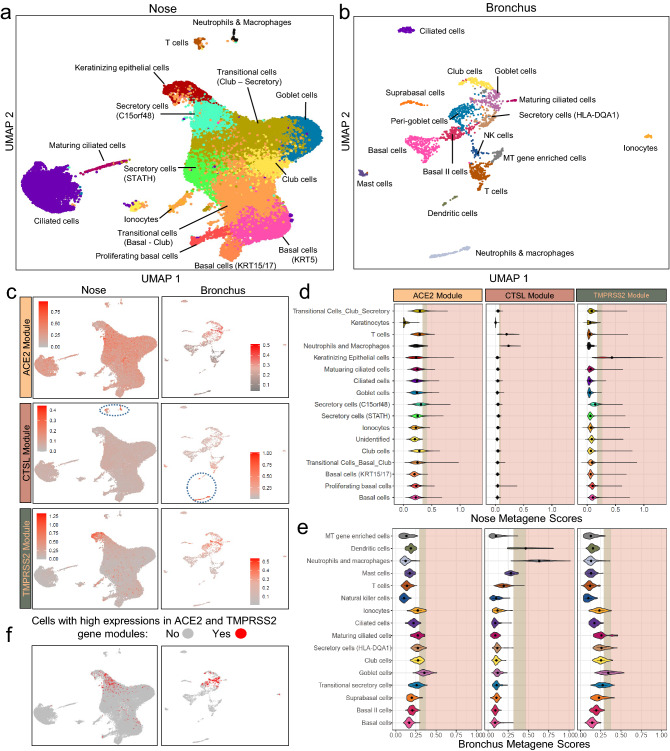
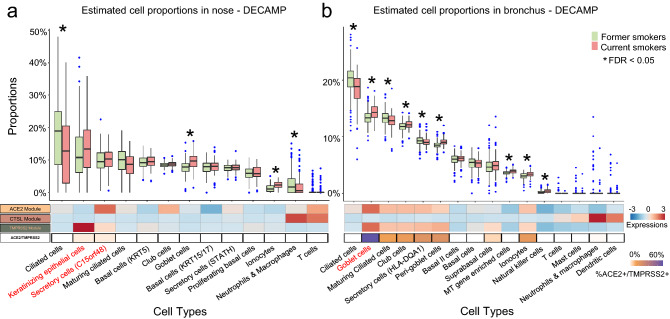
SARS-CoV-2 infection and disease severity are influenced by viral entry (VE) gene expression patterns in the airway epithelium. The similarities and differences of VE gene expression (ACE2, TMPRSS2, and CTSL) across nasal and bronchial compartments have not been fully characterized using matched samples from large cohorts. Gene expression data from 793 nasal and 1673 bronchial brushes obtained from individuals participating in lung cancer screening or diagnostic workup revealed that smoking status (current versus former) was the only clinical factor significantly and reproducibly associated with VE gene expression. The expression of ACE2 and TMPRSS2 was higher in smokers in the bronchus but not in the nose. scRNA-seq of nasal brushings indicated that ACE2 co-expressed genes were highly expressed in club and C15orf48+ secretory cells while TMPRSS2 co-expressed genes were highly expressed in keratinizing epithelial cells. In contrast, these ACE2 and TMPRSS2 modules were highly expressed in goblet cells in scRNA-seq from bronchial brushings. Cell-type deconvolution of the gene expression data confirmed that smoking increased the abundance of several secretory cell populations in the bronchus, but only goblet cells in the nose. The association of ACE2 and TMPRSS2 with smoking in the bronchus is due to their high expression in goblet cells which increase in abundance in current smoker airways. In contrast, in the nose, these genes are not predominantly expressed in cell populations modulated by smoking. In individuals with elevated lung cancer risk, smoking-induced VE gene expression changes in the nose likely have minimal impact on SARS-CoV-2 infection, but in the bronchus, smoking may lead to higher viral loads and more severe disease.


Conflict of interest statement

Avrum E. Spira is an employee of Johnson and Johnson Services, Inc, and has received personal fees from Veracyte Inc outside the submitted work. Marc E. Lenburg reports personal fees from Veracyte Inc outside the submitted work. Grant Duclos is now an employee of AstraZeneca. None declared (Ke Xu, Xingyi Shi, Christopher Husted, Rui Hong, Yichen Wang, Boting Ning, Travis Sullivan, Kimberly Rieger-Christ, Fenghai Duan, Helga Marques, Adam C. Gower, Xiaohui Xiao, Hanqiao Liu, Gang Liu, Michael Platt, Sarah Mazzilli, Ehab Billatos, Joshua D. Campbell, Jennifer E. Beane).

Figures

Figure 1
Figure 1
Differential association of VE gene expression between the nose and bronchus with respect to smoking. (a) Associations between the expression of ACE2 (tan), CTSL (brown), and TMPRSS2 (olive) and clinical covariates in the nasal and bronchial epithelium. Nasal (pink) and bronchial (purple) brushings were collected from subjects at high risk of developing lung cancer from four different studies (DECAMP bronchus: n = 341, AEGIS bronchus: n = 305, BCLHS bronchus: n = 238, PCA bronchus: n = 133, DECAMP nose: n = 253, AEGIS nose: n = 150). The size and color of the bubbles represent the significance and magnitude, respectively, of the t statistic calculated using linear modeling of VE gene expression as a function containing the four clinical variables, correcting for batch and mean Transcript Integrity Number (mTIN). Significance levels: * p < 0.05, ** p < 0.01, *** p < 0.001. (b) Boxplots showing the significance of associations between VE expression and smoking status in the DECAMP cohort, assessed by Student's t test on residual counts after correction for sex, age, percentage of predicted FEV1, batch, and mTIN (p < 0.05). (c) Expression of VE genes is not significantly correlated (p > 0.05, Pearson correlation) between paired DECAMP nasal (x-axis) and bronchial (y-axis) epithelial samples (n = 123). Residual counts adjusted for sex, age, percentage of predicted FEV1, batch, and mTIN were used for the comparison. The blue line is the line of best fit and the gray shading represents the 95% confidence level interval for predictions from the linear model.
Figure 2
Figure 2
Consensus nasal and bronchial VE gene modules are associated with different biological pathways. (a–b) WGCNA was used to identify consensus co-expression modules in nasal (a) and bronchial (b) samples from the DECAMP cohort (n = 58 and 48 modules, respectively). A heatmap of the correlation of module eigengenes computed from each module demonstrates that ACE2 and TMPRSS2 modules were more highly correlated with each other in the bronchus than in the nose. The CTSL module was not correlated with ACE2 or TMPRSS2 modules in either the nose or bronchus. (c) Scatterplots comparing the overrepresentation of MSigDB Hallmark pathway gene sets in each VE module in the nose and bronchus. The -log10(FDR q) values denoting the degree of overrepresentation of each gene set in each module in the nose and bronchus are shown on the x- and y-axes, respectively. The overrepresentation of gene sets in the ACE2 and TMPRSS2 modules is largely discordant between the nose and bronchus, whereas several immune-related pathways are overrepresented in the CTSL module in both sites. (d) VE module eigengenes were not significantly correlated (Pearson p > 0.05) between paired nasal (x-axis) and bronchial (y-axis) samples in DECAMP (n = 114). The blue line is the line of best fit and the gray shading represents the 95% confidence level interval for predictions from the linear model.
Figure 3
Figure 3
Comparison of expression patterns for VE gene modules across cell types from nasal and bronchial brushings. Single-cell RNA-seq was performed (a) on nasal brushings from 7 patients (n = 34,833 cells) and (b) bronchial brushings from 17 patients (n = 2,075 cells). Cell types were inferred from the expression of known marker genes. (c) UMAP projections showing the expression pattern of VE gene modules (ACE2, top; CTSL, middle; TMPRSS2 bottom) across different cell types in the nasal (left) and bronchial (right) epithelium. The cells are colored gray for low expression and red for high expression of metagene scores of each VE gene module. Immune cells with high expression of the CTSL modules were encircled in blue (d–e). Violin plot showing the metagene score for each VE gene module across the cell types in (d) nasal and (e) bronchial epithelium. For each violin plot, metagene expression is designated as elevated (light brown) or highly elevated (pink) if it is greater than one or two standard deviations above the mean metagene score, respectively. (f) UMAP projections showing cells greater than 1 standard deviation above the mean for both ACE2 and TMPRSS2 modules (i.e., double-positive). Double positive cells were enriched in nasal secretory (C15orf48 +) and keratinizing epithelial cells (left) and bronchial goblet cells (right).
Figure 4
Figure 4
Deconvolution of bulk RNA-seq data shows increased proportions of goblet cells in nasal brushings from current smokers and goblet cells, peri-goblet cells, and ionocytes in bronchial brushings from current smokers. (a, b) Top: boxplots of cell type proportions estimated by AutoGeneS in bulk RNA-seq data from nasal (n = 281) and bronchial brushings (n = 355) obtained from current and former smokers in the DECAMP cohort. Significant cell proportion differences between current and former smokers were determined by the Wilcoxon test (* indicates FDR q < 0.05). Bottom: the heatmap displays the average VE module score for each cell population from the single-cell RNA-seq data (first three rows), as well as the proportion of each cell type that is ACE2 + /TMPRSS2 + (i.e., the expression of both genes is one standard deviation above the average). Cell types that express both ACE2 and TMPRSS2 modules are in red. Prevalence of cell types enriched for ACE2 and TMPRSS2 expression shows positive correlation with smoking only in the bronchus, which may explain the lack of association of ACE2/TMPRSS2 expression between the bronchial and nasal bulk RNA-seq data.

Update of

References

    1. Hoffmann, M., Kleine-Weber, H., Schroeder, S., Krüger, N., Herrler, T., Erichsen, S., Schiergens, T. S., Herrler, G., Wu, N. H., Nitsche, A., Müller, M. A., Drosten, C., Pöhlmann, S. SARS-CoV-2 cell entry depends on ACE2 and TMPRSS2 and Is blocked by a clinically proven protease inhibitor. Cell. 181(2), 271–280.e8 10.1016/j.cell.2020.02.052 (2020). - PMC - PubMed
    1. Jia HP, Look DC, Shi L, Hickey M, Pewe L, Netland J, Farzan M, Wohlford-Lenane C, Perlman S, McCray PB., Jr ACE2 receptor expression and severe acute respiratory syndrome coronavirus infection depend on differentiation of human airway epithelia. J. Virol. 2005;79(23):14614–14621. doi: 10.1128/JVI.79.23.14614-14621.2005. - DOI - PMC - PubMed
    1. Wrapp D, Wang N, Corbett KS, Goldsmith JA, Hsieh CL, Abiona O, Graham BS, McLellan JS. Cryo-EM structure of the 2019-nCoV spike in the prefusion conformation. Science. 2020;367(6483):1260–1263. doi: 10.1126/science.abb2507. - DOI - PMC - PubMed
    1. Wan Y, Shang J, Graham R, Baric RS, Li F. Receptor recognition by the novel coronavirus from Wuhan: An analysis based on decade-long structural studies of SARS coronavirus. J. Virol. 2020;94(7):e00127–e220. doi: 10.1128/JVI.00127-20. - DOI - PMC - PubMed
    1. Smith, J. C., Sausville, E. L., Girish, V., Yuan, M. L., Vasudevan, A., John, K. M. & Sheltzer, J. M. Cigarette smoke exposure and inflammatory signaling increase the expression of the SARS-CoV-2 receptor ACE2 in the respiratory tract. Dev Cell. 53(5), 514–529.e.3 10.1016/j.devcel.2020.05.012 (2020). - PMC - PubMed

Publication types

Substances