. 2022 Oct 28;12(1):18204.
doi: 10.1038/s41598-022-23095-y.

On the morphology of electrostatic solitary waves in the Earth's aurora

Affiliations

On the morphology of electrostatic solitary waves in the Earth's aurora

Steffy Sara Varghese et al. Sci Rep. .

Abstract

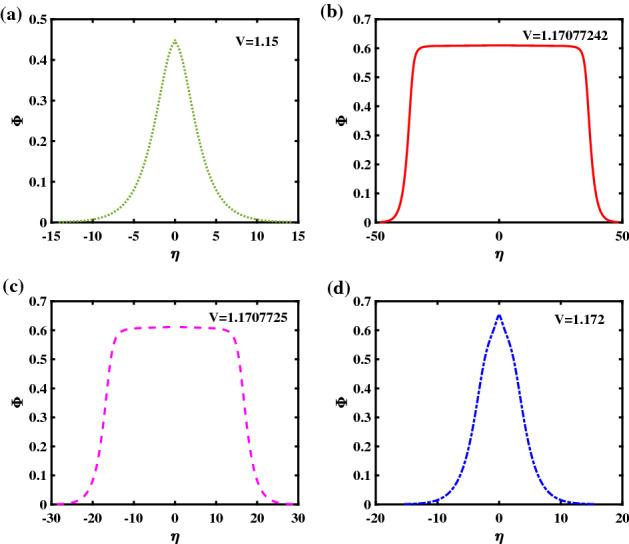
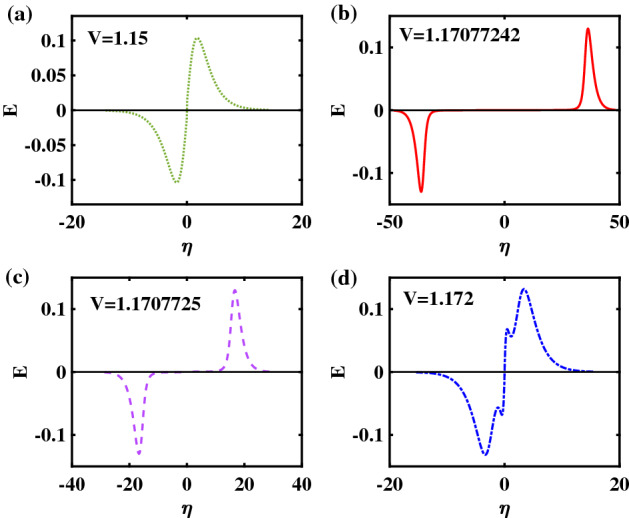
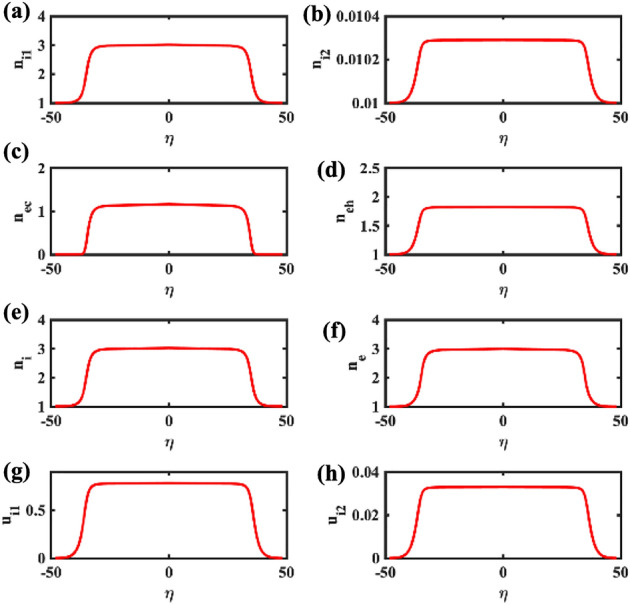
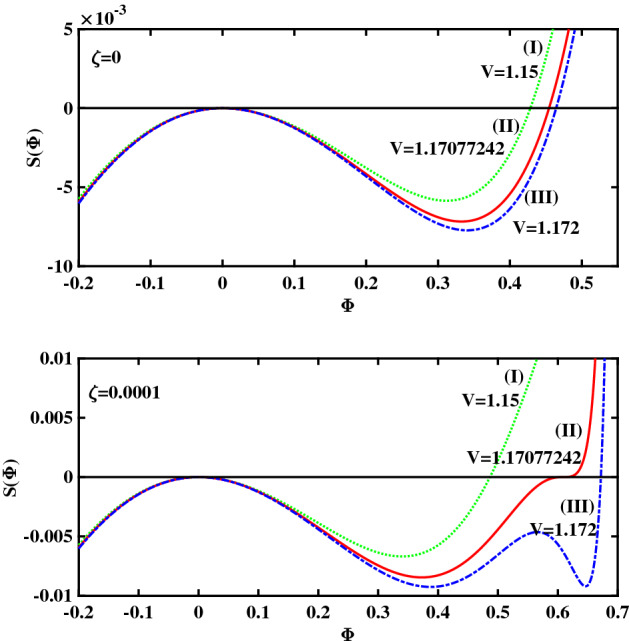
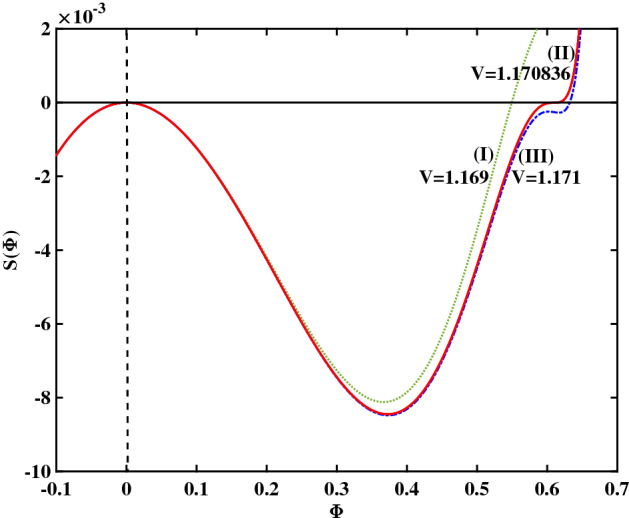
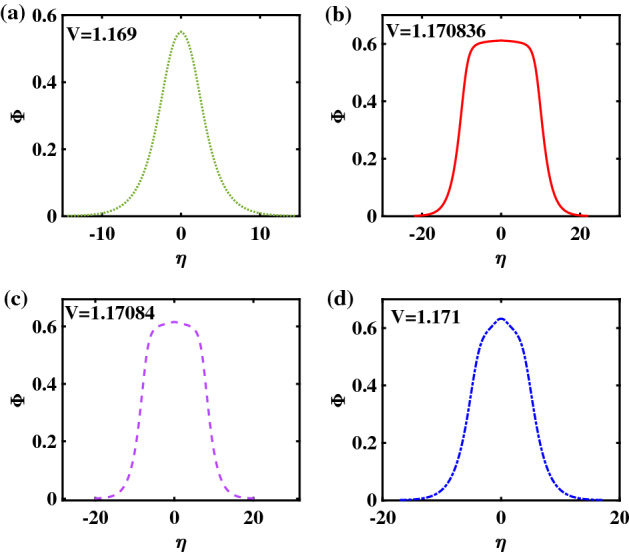
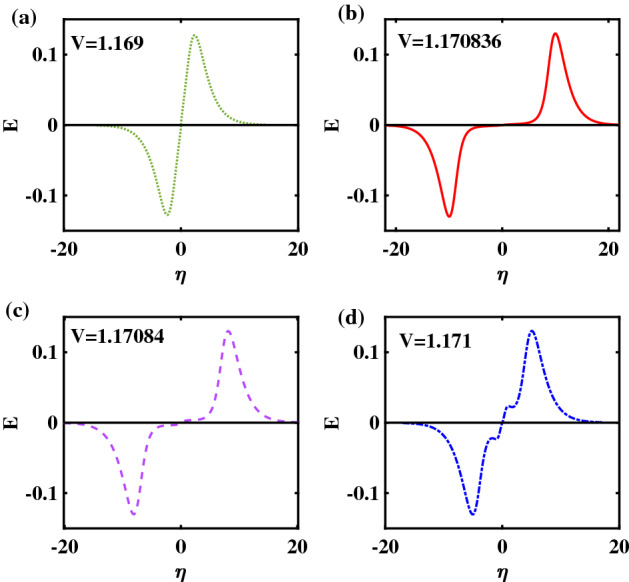
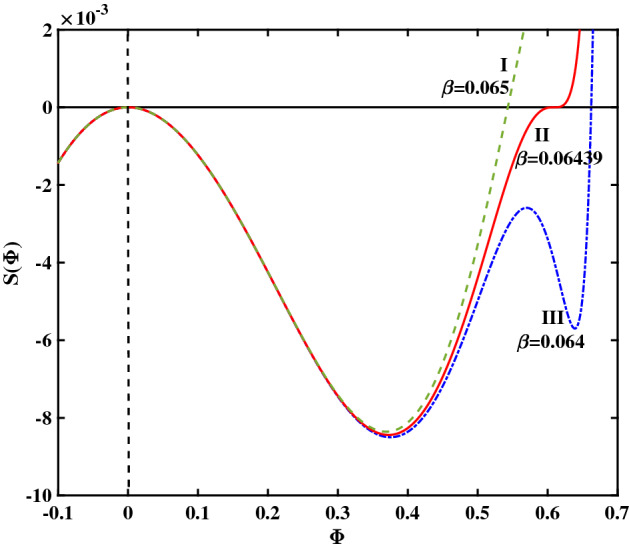
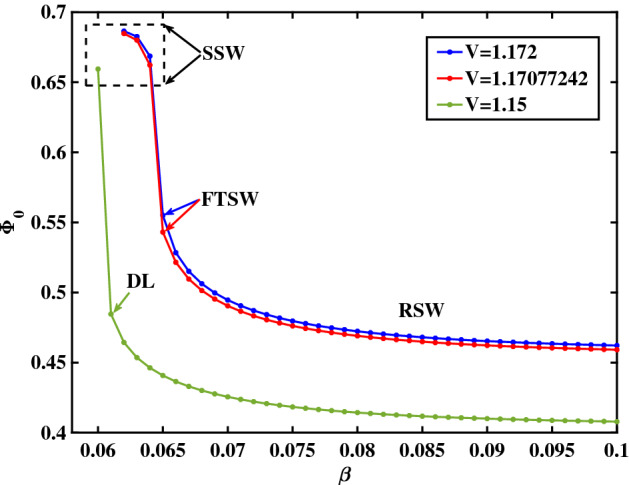
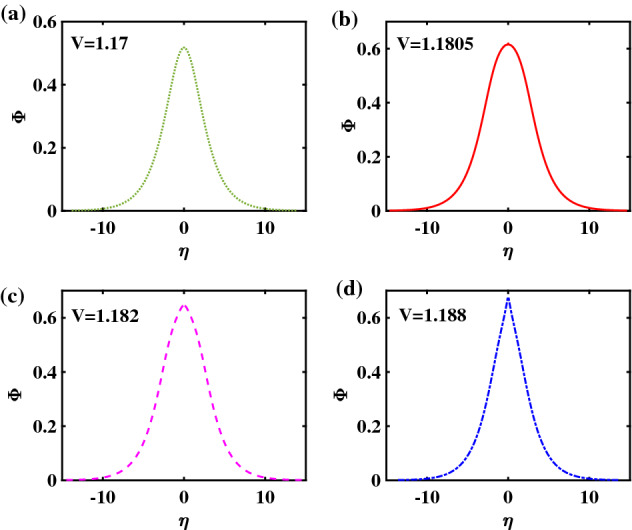
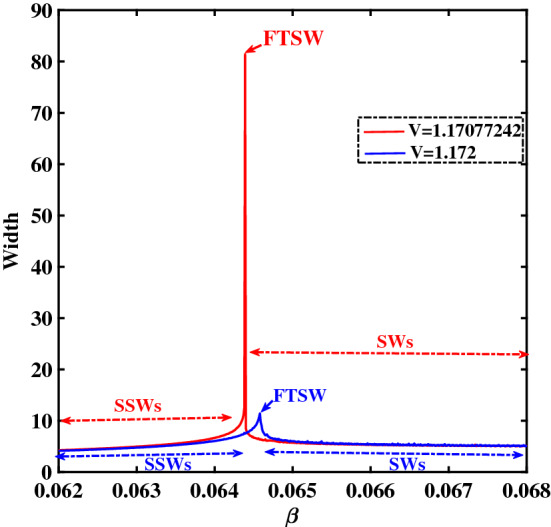
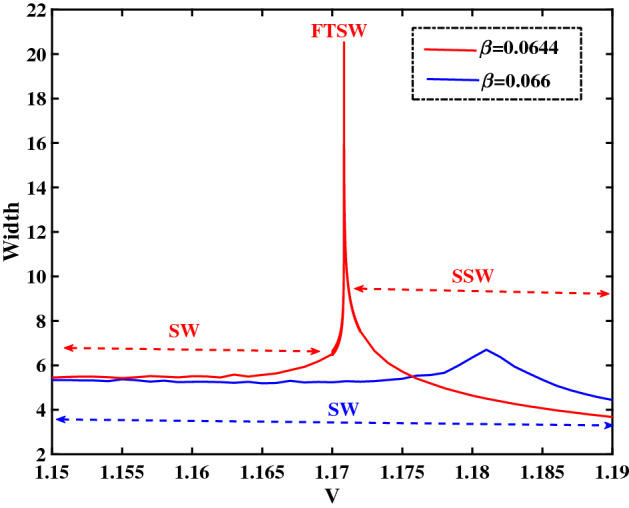
Electrostatic solitary waves (ESWs) have been detected in abundance in Space plasma observations, both by satellites in near-Earth plasma environments as well as by planetary missions, e.g. Cassini in Saturn or MAVEN in Mars. In their usual form, these are manifested as a bipolar electric field corresponding to a bell-shaped pulse in the electrostatic potential. Recent studies have suggested the existence of alternative forms of ESWs, including flat-top solitary waves (FTSWs) and supersolitary waves (SSWs), both of which are often encountered in Space observations such as in polar cap boundary layer, the auroral acceleration region and elsewhere. This article focuses on the existence and characterization of different types of electrostatic solitary waves in multicomponent Space plasmas. Relying on a multi-fluid plasma model, comprising two types of ions and two different electron populations, we have identified the conditions for existence of flat-top solitary waves and supersolitons, in contrast to "standard" solitary waves. Both ion species are models as cold fluids, for simplicity. Our analysis reveals that the coexistence of the two electron populations is pivotal for the formation of such non-standard electrostatic structures, and that their characteristic parameters (temperature, density ratio) plays a decisive role in their generation and structural characteristics. Nonetheless, while supersolitary waves may exist in a wide range of parameter values (as confirmed by earlier theoretical studies), it appears that flat-top solitary waves will occur in a narrow window in the parameter region, which may explain their scarce (but non-negligible) frequency of observation. Our theoretical findings confirm and validate the existence of alternative (non-conventional) ESW waveforms in auroral plasma (in addition to the ubiquitous bipolar electric field form), where such an electron coexistence is typically observed.


Conflict of interest statement

The authors declare no competing interests.

Figures

Figure 1
Figure 1
Sagdeev pseudopotential profiles for different V values; the depicted curves represent (I) RSW (in green color) for V=1.15, (II) FTSW (in red color) for V=1.17077242, and (III) SSW (in blue color) for V=1.172. The remaining parameter values are: β=0.06439, ζ=0.0001, δ=0.01, μ=16, and Q=1.
Figure 2
Figure 2
Phase portrait profiles for different V values; the depicted curves represent (I) RSW (in green color), for V=1.15, (II) FTSW (in red color), for V=1.17077242, and (III) SSW (in blue color), for V=1.172. The remaining parameter values are: β=0.06439, ζ=0.0001, δ=0.01, μ=16, and Q=1.
Figure 3
Figure 3
The electrostatic potential profiles corresponding to the Sagdeev pseudopotential curves shown in Fig. 1 are depicted: (a) a regular SW (RSW) for V=1.15; (b) a flat-top SW (FTSW) for V=1.17077242; (c) FTSW for V=1.1707725, and (d) a supersolitary wave (SSW), for V=1.172. The remaining parameter values are: β=0.06439, ζ=0.0001, δ=0.01, μ=16, and Q=1.
Figure 4
Figure 4
The Electric field profiles corresponding to the Sagdeev pseudopotential curves shown in Fig. 1 (and the ES potential pulses in Fig. 2) are depicted: (a) RSW for V=1.15; (b) FTSW for V=1.17077242; (c) FTSW for V=1.1707725 and (d) SSW for V=1.172. The remaining parameter values are: β=0.06439, ζ=0.0001, δ=0.01, μ=16, and Q=1.
Figure 5
Figure 5
The space profile of the plasma state variables (density of all plasma components, fluid speed for the ion species at the bottom row) are depicted, corresponding to the FTSW profile shown in Fig. 1 (see Curve II), for V=1.17077242. The remaining parameter values are: β=0.06439, ζ=0.0001, δ=0.01, μ=16, and Q=1.
Figure 6
Figure 6
(a) Top panel: Sagdeev pseudopotential profiles for different V values corresponding to ζ=0 (i.e. no cold electron population); the depicted curves represent regular SWs, for all values of V: Curve I for V=1.15; Curve II for V=1.17077242 and Curve III for V=1.172. (b) Bottom panel: Sagdeev pseudopotential profiles for different V values corresponding to ζ=0.0001 (i.e. a small portion of cold electrons; the depicted curves represent (I) RSW for V=1.15; (II) FTSW, for V=1.17077242 and (III) SSW for V=1.172, The remaining parameter values are: β=0.06439, δ=0.01, μ=16, and Q=1.
Figure 7
Figure 7
Sagdeev pseudopotential profiles for different V values; the depicted curves represent (I) RSW (in green color), for V=1.169, (II) FTSW (in red color), for V=1.170836, and (III) SSW (in blue color), for V=1.171. The remaining parameter values are: β=0.0644, ζ=0.0001, δ=0.01, μ=16, and Q=1.
Figure 8
Figure 8
Potential profiles corresponding to the Sagdeev pseudopotential curves shown in Fig. 7: (a) RSW, for V=1.169, (b) FTSW, for V=1.170836, (c) FTSW for V=1.17084, and (d) SSW, for V=1.171. The remaining parameter values are: β=0.0644, ζ=0.0001, δ=0.01, μ=16, and Q=1.
Figure 9
Figure 9
Electric field profiles corresponding to the electrostatic potential profiles plotted in Fig. 8, (a) RSW, for V=1.169, (b) FTSW, for V=1.170836, (c) FTSW for V=1.17084and (d) SSW, for V=1.171. The remaining parameter values are: β=0.0644, ζ=0.0001, δ=0.01, μ=16, and Q=1.
Figure 10
Figure 10
Sagdeev pseudopotential profile transition corresponding to three different β values for a fixed V value (V=1.17077242). RSW (in green color) for β=0.065; FTSW (in red color) for β=0.06439, and SSW (in blue color) for β=0.064. The remaining parameter values are: ζ=0.0001, δ=0.01, μ=16 and Q=1.
Figure 11
Figure 11
Variation of amplitude (Φ0) Vs β for three different values of V. Blue curve corresponds to V=1.172, red curve corresponds to V=1.17077242, and green curve corresponds to V=1.15. The remaining parameter values are: ζ=0.0001, δ=0.01, μ=16 and Q=1.
Figure 12
Figure 12
Potential profiles corresponding to β=0.066. Panels (a)–(c) represent regular solitary waves (RSWs) for V=1.170, V=1.1805 and V=1.1820 respectively; panel (d) represents a supersolitary wave (SSW), for V=1.188. The remaining parameter values are: ζ=0.0001, δ=0.01, μ=16 and Q=1.
Figure 13
Figure 13
Variation of the width versus the β for two different values of V. The red curve corresponds to V=1.17077242 and the blue curve corresponds to V=1.172. The remaining parameter values are: ζ=0.0001, δ=0.01, μ=16 and Q=1.
Figure 14
Figure 14
Variation of the width versus the velocity V for two different values of β. The blue curve corresponds to β=0.066 (as in Fig. 12) and the red curve corresponds to β=0.0644 (cf. Fig. 8). The remaining parameter values are: ζ=0.0001, δ=0.01, μ=16 and Q=1.

References

    1. Temerin M, Cerny K, Lotko W, Mozer FS. Observations of double layers and solitary waves in the auroral plasma. Phys. Rev. Lett. 1982;48:1175–1179. doi: 10.1103/PhysRevLett.48.1175. - DOI
    1. Tsurutani B, et al. Plasma waves in the dayside polar cap boundary layer: Bipolar and monopolar electric pulses and whistler mode waves. Geophys. Res. Lett. 1998;25:4117–4120. doi: 10.1029/1998GL900114. - DOI
    1. Pickett J, et al. Furthering our understanding of electrostatic solitary waves through cluster multispacecraft observations and theory. Adv. Space Res. 2008;41:1666–1676. doi: 10.1016/j.asr.2007.05.064. - DOI
    1. McFadden JP, et al. Fast observations of ion solitary waves. J. Geophys. Res. Space Phys. 2003;108:1. doi: 10.1029/2002JA009485. - DOI
    1. Dauxois T, Peyrard M. Physics of Solitons. Cambridge University Press; 2006.