. 2022 Oct 28;5(1):1145.
doi: 10.1038/s42003-022-04112-2.

Dysregulated transforming growth factor-beta mediates early bone marrow dysfunction in diabetes

Affiliations

Dysregulated transforming growth factor-beta mediates early bone marrow dysfunction in diabetes

Jina J Y Kum et al. Commun Biol. .

Abstract

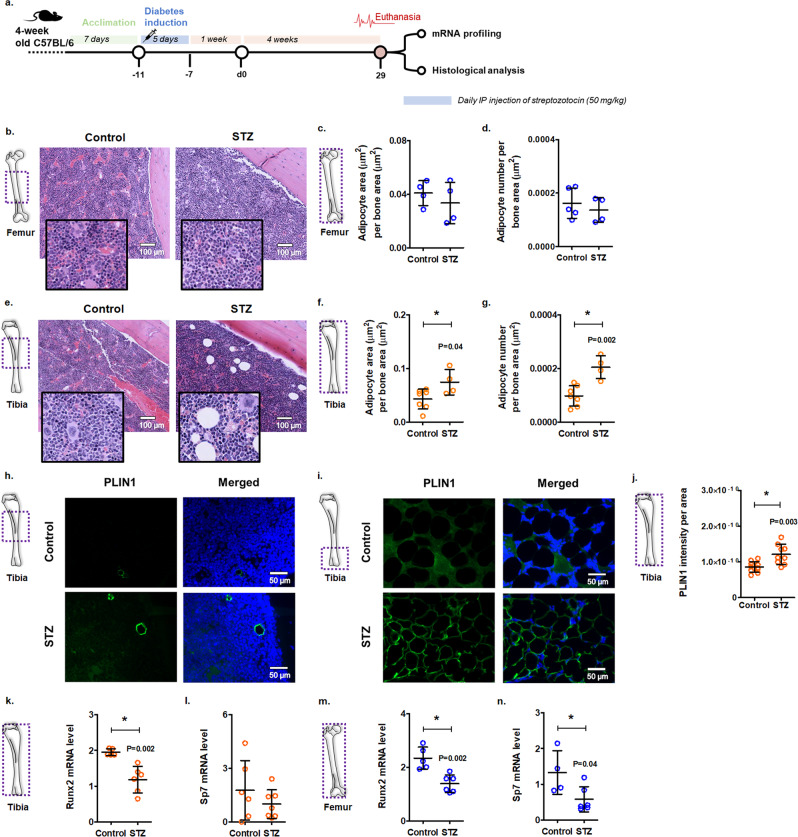
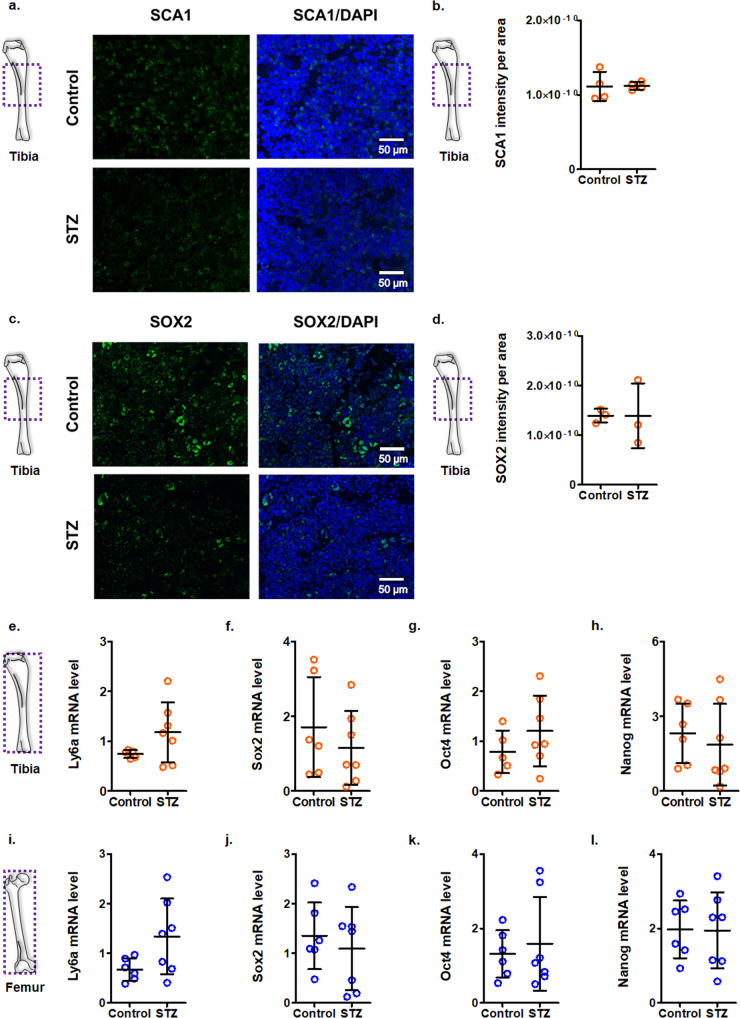
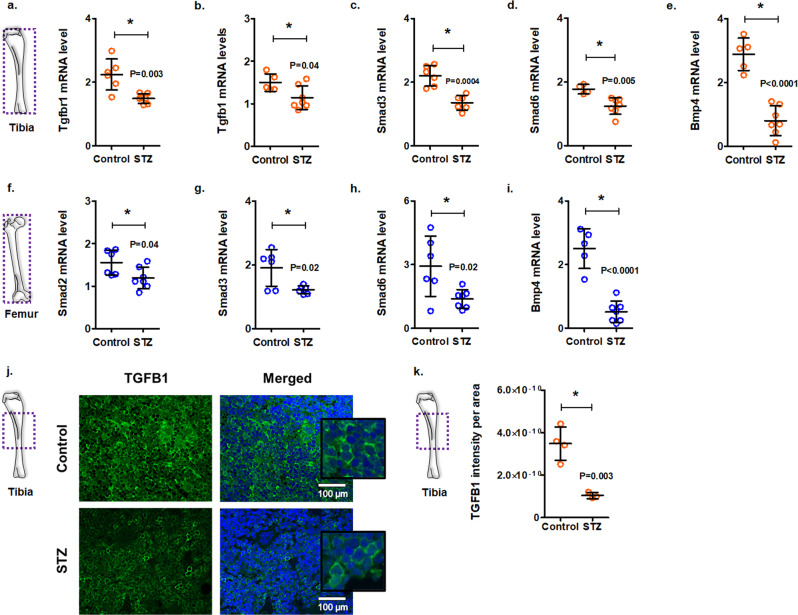
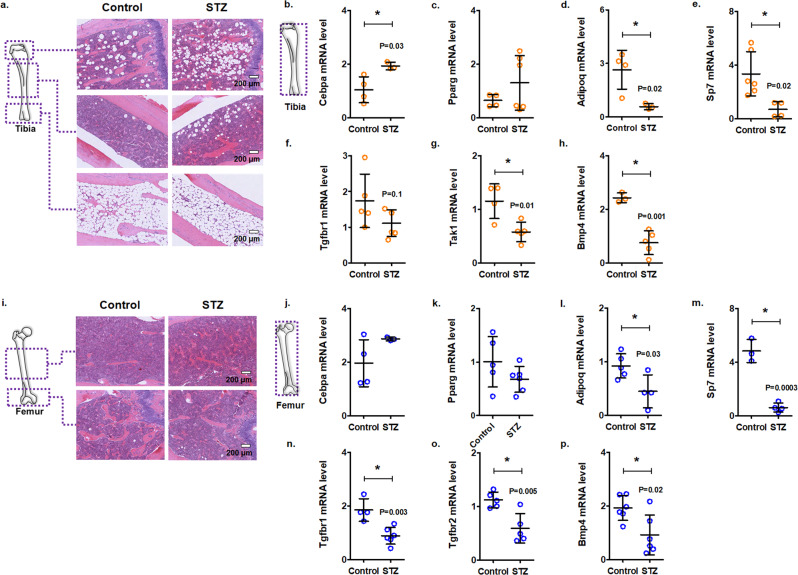
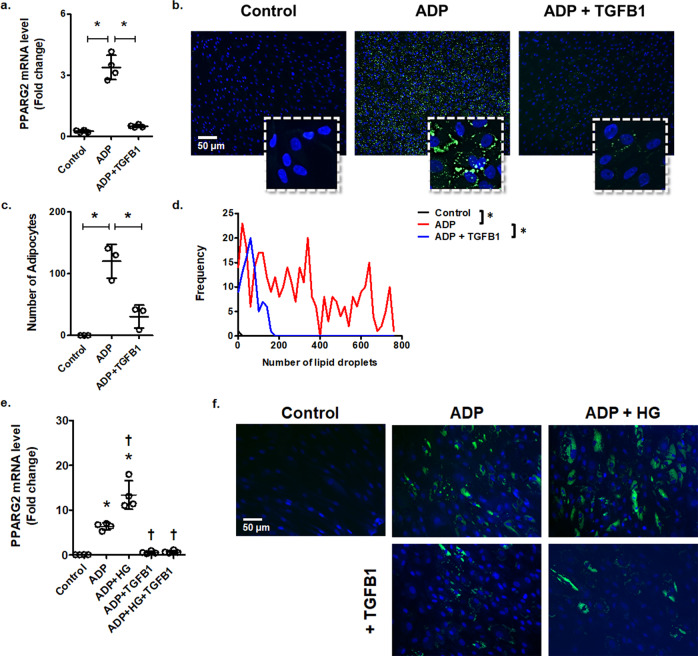
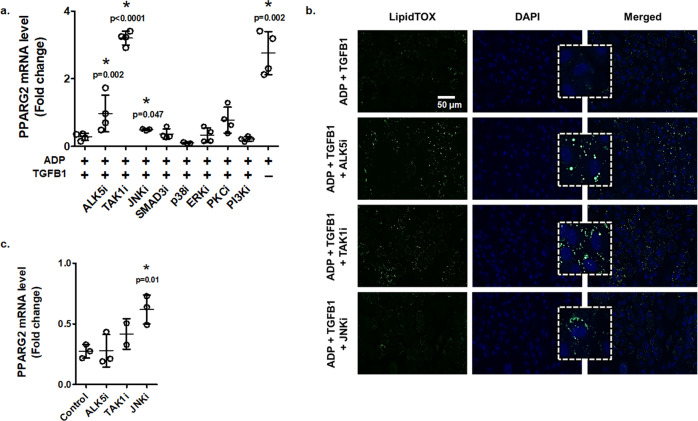
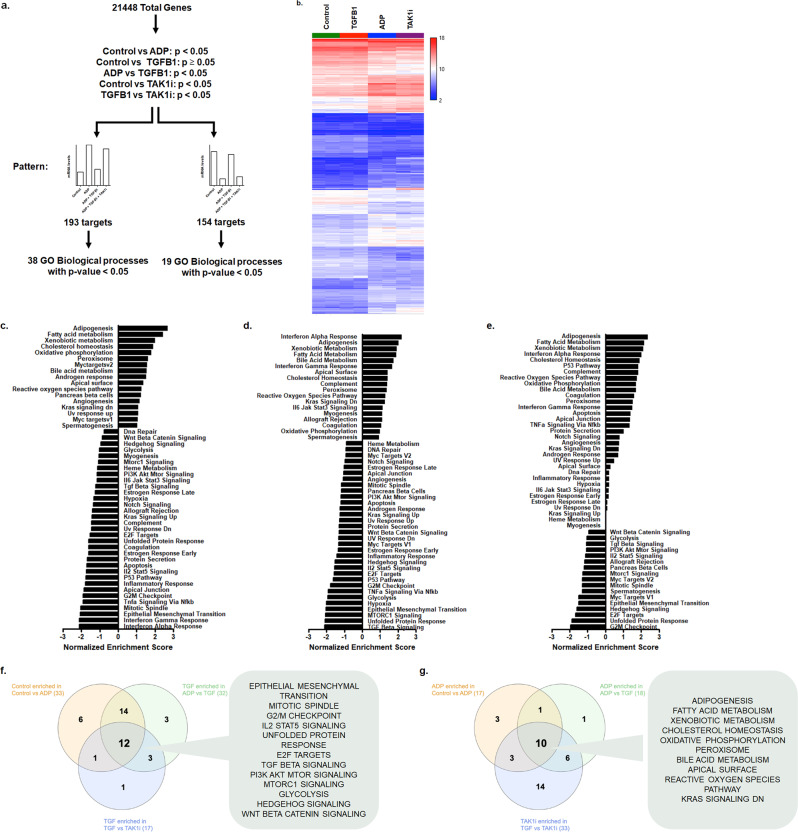
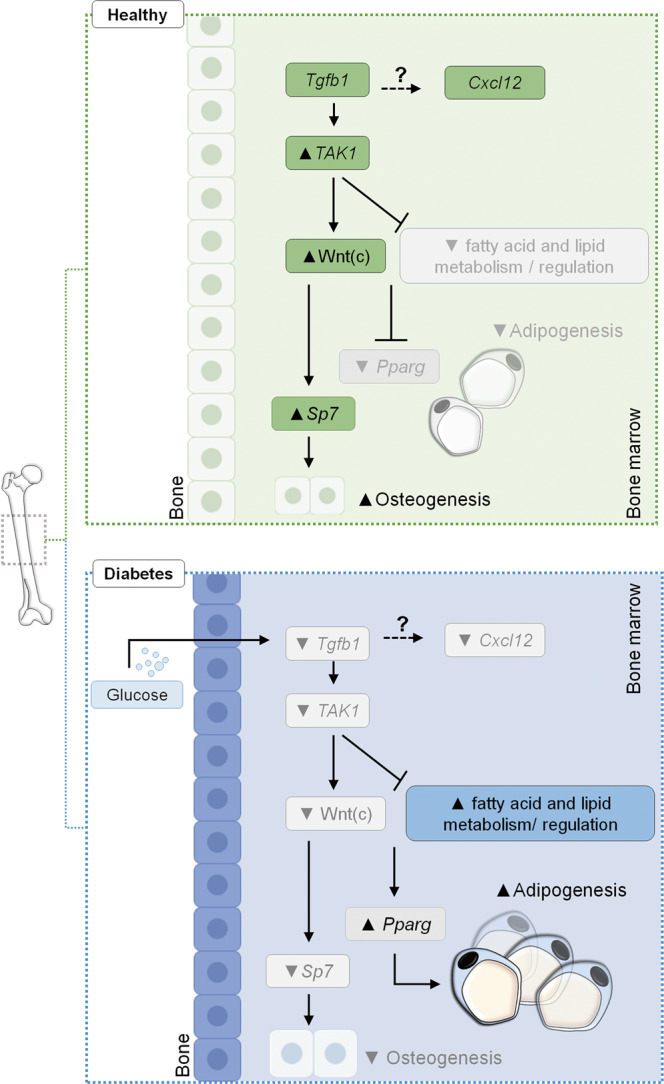
Diabetes affects select organs such as the eyes, kidney, heart, and brain. Our recent studies show that diabetes also enhances adipogenesis in the bone marrow and reduces the number of marrow-resident vascular regenerative stem cells. In the current study, we have performed a detailed spatio-temporal examination to identify the early changes that are induced by diabetes in the bone marrow. Here we show that short-term diabetes causes structural and molecular changes in the marrow, including enhanced adipogenesis in tibiae of mice, prior to stem cell depletion. This enhanced adipogenesis was associated with suppressed transforming growth factor-beta (TGFB) signaling. Using human bone marrow-derived mesenchymal progenitor cells, we show that TGFB pathway suppresses adipogenic differentiation through TGFB-activated kinase 1 (TAK1). These findings may inform the development of novel therapeutic targets for patients with diabetes to restore regenerative stem cell function.


Conflict of interest statement

The authors declare no competing interests.

Figures

Fig. 1
Fig. 1. Streptozotocin-induced diabetes enhances adipocyte number and area in tibiae of mice at 1 month.
a Experimental scheme for diabetic mouse study. Diabetes was induced in C57BL/6 mice with daily intraperitoneal injections of streptozotocin (STZ; 50 mg/kg) for 5 consecutive days. Non-diabetic control mice received an equal volume of citrate buffer. Blood glucose levels were checked 1 week after the last STZ injection to confirm hyperglycemia (d0). b Representative H&E-stained images of the mouse femur [scale bar = 100 μm]. Inserts showing higher magnification. Quantification of adipocyte area per bone area (c) and adipocyte number per bone area (d) in the femurs. Parameters were measured using MarrowQuant [Mean ± SD; n = 4 (5 for control in panel d); each data point represents a mouse; two-tailed student’s t-test: *p < 0.05]. e Representative images of the H&E-stained mouse tibia [scale bar = 100 μm]. Inserts showing higher magnification. Quantification of adipocyte area per bone area (f) and adipocyte number per bone area (g) in the tibiae [Mean ± SD; n = 7 control and 4 STZ in panels f and g; each data point represents a mouse; two-tailed student’s t-test: *p < 0.05]. Immunofluorescence staining of mouse tibia for perilipin-1 (PLIN1; green). Sections were counterstained with DAPI (blue) [scale bar = 50 μm]. Figure showing shaft (h) and distal regions (i) of the tibia. j Quantification of PLIN1 intensity per area, as determined by ImageJ [Mean ± SD; n = 10 control and 9 STZ; two-tailed student’s t-test: *p < 0.05]. mRNA levels of osteogenesis-associated genes were measured in the tibiae (k, l) and femurs (m, n) of control and diabetic (STZ) mice [Data normalized to Actb and Gapdh; Mean ± SD; n = 5 control and 6 STZ in panel k, 4 control and 6 STZ in panel l, 5 control and 6 STZ in panel m; each data point represents a mouse; two-tailed student’s t-test: *p < 0.05].
Fig. 2
Fig. 2. Stem cell antigens in the tibia of streptozotocin-induced diabetic mice at 1 month do not show any changes.
a Immunofluorescence staining of the tibiae of control and diabetic (STZ; 1 month) mice for SCA1 (green). Sections were counterstained with DAPI (blue) [scale bar = 50 μm]. b Quantification of SCA1 intensity per area, as determined by ImageJ [Mean ± SD; n = 4; two-tailed student’s t-test: *p < 0.05]. c Immunofluorescence staining of the tibiae of control and diabetic (STZ; 1 month) mice for SOX2 (green). Sections were counterstained with DAPI (blue) [scale bar = 50 μm]. d Quantification of SOX2 intensity per area, as determined by ImageJ [Mean ± SD; n = 3; two-tailed student’s t-test: *p < 0.05]. eh mRNA levels of stem cell markers in tibia flush samples, showing Sca1 (Ly6a), Sox2, Oct4 (Pou5f1), and Nanog [Data normalized to Actb and Gapdh; Mean ± SD; n = 5 control and 7 STZ in panel e, 6 control and 7 STZ in panel f, 5 control and 7 STZ in panel g, 6 control and 7 STZ in panel h; each data point represents a mouse; two-tailed student’s t-test: *p < 0.05]. il mRNA levels of stem cell markers in femur flush samples, showing Sca1 (Ly6a), Sox2, Oct4 (Pou5f1), and Nanog [Data normalized to Actb and Gapdh; Mean ± SD; n = 6 control and 7 STZ; each data point represents a mouse; two-tailed student’s t-test: *p < 0.05].
Fig. 3
Fig. 3. Suppressed TGFB pathway in the bone marrow of streptozotocin-induced diabetic mice at 1 month.
Tibia and femur samples were harvested from control and streptozotocin (STZ)-induced diabetic mice after 1 month. ae mRNA levels of the TGFB pathway genes in the tibiae of mice [For panels a, b, data normalized to Actb, Atp5f1, and Pgk1; for panels ce, data normalized to Actb and Gapdh; Mean ± SD; n = 6 control and 7 STZ in panel a, 5 control and 7 STZ in panel b, 6 control and 6 STZ in panel c, 4 control and 7 STZ in panel d, 5 control and 7 STZ in panel e; each data point represents a mouse; two-tailed student’s t-test: *p < 0.05]. fi mRNA levels of the TGFB pathway genes in the femurs of mice [For panels fi, data normalized to Actb and Gapdh; Mean ± SD; n = 6 control and 7 STZ in panel f, 6 control and 6 STZ in panel g, 6 control and 7 STZ in panel h; 5 control and 7 STZ in panel i; each data point represents a mouse; two-tailed student’s t-test: *p < 0.05]. j Immunostaining of tibia marrow for TGFB1 (green). Sections were counterstained with DAPI (blue) [scale bar = 100 μm]. Inserts showing higher magnification. k Quantification of TGFB1 intensity per area, as determined by ImageJ [Mean ± SD; n = 4 control and 3 STZ; two-tailed student’s t-test: *p < 0.05].
Fig. 4
Fig. 4. Enhanced adiposity in tibiae of mice after 2 months of streptozotocin-induced diabetes.
C57BL/6 male mice received streptozotocin (STZ; 50 mg/kg) or citrate buffer (non-diabetic controls). Tibiae were harvested 2 months after the onset of diabetes. a Representative H&E-stained sections of the tibia showing proximal, shaft, and distal regions [scale bar = 200 μm]. mRNA levels of adipogenesis-associated (bd) and osteogenesis-associated (e) genes in marrow flush samples of mouse tibia [Data normalized to Actb, Atp5f1, and Pgk1; Mean ± SD; n = 4 control and 3 STZ in panel b, 4 control and 6 STZ in panel c, 4 control and 3 STZ in panel d, 6 control and 4 STZ in panel e; each data point represents a mouse; two-tailed student’s t-test: *p < 0.05]. mRNA levels of TGFB pathway genes in the tibiae of control or diabetic (STZ) mice after 2 months of diabetes onset [Data normalized to Actb and Gapdh; Mean ± SD; n = 4 control and 5 STZ in panels f and g, 3 control and 5 STZ in panel h; each data point represents a mouse; two-tailed student’s t-test: *p < 0.05]. i Representative H&E-stained sections of the femur showing shaft and distal regions [scale bar = 200 μm]. mRNA levels of adipogenesis-associated (jl) and osteogenesis-associated (m) genes in marrow flush samples of mouse femur [Data normalized to Actb, Atp5f1, and Pgk1; Mean ± SD; n = 4 control and 3 STZ in panel j, 5 control and 6 STZ in panel k, 5 control and 4 STZ in panel l, 3 control and 4 STZ in panel m; each data point represents a mouse; two-tailed student’s t-test: *p < 0.05]. mRNA levels of TGFB pathway genes in the femurs of control or diabetic (STZ) mice after 2 months of diabetes onset [Data normalized to Actb and Gapdh; Mean ± SD; n = 4 control and 6 STZ in panel n, 5 control and 5 STZ in panel o, 6 control and 6 STZ in panel p; each data point represents a mouse; two-tailed student’s t-test: *p < 0.05].
Fig. 5
Fig. 5. TGFB1 exposure inhibits adipogenic differentiation of bone marrow mesenchymal progenitor cells.
Human bone marrow-derived progenitor cells (bm-MPCs) were induced to differentiate in an adipogenesis-inducing media (ADP), with or without TGFB1 (10 ng/mL) for 72 h. a mRNA levels of PPARG2 in bm-MPCs [Data normalized to ACTB, GAPDH, and RPLP0; Mean ± SD; n = 4; each data point represents an independent sample; ANOVA followed by Bonferroni post hoc analysis: *p < 0.05]. b bm-MPCs, treated as indicated in panel a, were stained with LipidTOX (green) to detect intracellular lipid accumulation. Cells were counterstained with DAPI (blue) [scale bar = 50 μm]. Inserts showing higher magnification. The number of adipocytes and frequency of lipid droplets were measured by CellProfiler [Mean ± SD; n = 3 for panel c, 3 images per replicate were measured for panel d; ANOVA followed by Bonferroni post hoc analysis: *p < 0.05]. e bm-MPCs were cultured in control, adipogenic media (ADP), or ADP supplemented with TGFB1 (10 ng/mL) or high glucose (HG; 25 mmol/L) for 7 days. mRNA levels of PPARG2 were measured [Data normalized to ACTB; Mean ± SD; n = 4; each data point represents an independent sample; ANOVA followed by Bonferroni post hoc analysis: *p < 0.05 compared with control, †p < 0.05 compared with ADP]. f Detection of intracellular lipid accumulation in bm-MPCs by LipidTOX (green) staining. Cells were counterstained with DAPI (blue) [scale bar = 50 μm]. Cells were treated as indicated in Panel e.
Fig. 6
Fig. 6. TAK1-JNK axis mediates TGFB1 signaling to inhibit mesenchymal progenitor cell differentiation into adipocytes.
Bone marrow-derived mesenchymal progenitor cells (bm-MPCs) were cultured in adipogenic media (ADP) with TGFB1 (10 ng/mL), and various inhibitors of the TGFB signaling pathway. All inhibitors were tested at 10 µmol/L concentration and for 72-hour exposure. a Levels of PPARG2 mRNA in bm-MPCs [Data normalized to ACTB, GAPDH, and RPLP0; Mean ± SD; n = 4 for all treatments except ADP + TGFB1 + JNKi and ADP + TGFB1 + p38i which were 3; each data point represents an independent sample; two-tailed student’s t-test: *p < 0.05 compared with adipogenic media and TGFB1 (ADP + TGFB1)]. b bm-MPCs, treated as indicated in panel a, were stained for intracellular lipid accumulation by LipidTOX (green). Cells were counterstained with DAPI (blue) [scale bar = 50 μm]. Inserts showing higher magnification. c bm-MPCs cultured in control (DMEM) media supplemented with TAK1 inhibitor (TAK1i; 10 µmol/L) or JNK inhibitor (JNKi; 10 µmol/L) for 72 h were analyzed for PPARG2 mRNA levels [Data normalized to ACTB, GAPDH, and RPLP0; Mean ± SD; n = 3 control, 3 ALK5i, 3 JNKi, and 2 TAK1i; each data point represents an independent sample; two-tailed student’s t-test: *p < 0.05 compared with control].
Fig. 7
Fig. 7. Identifying TGFB-responsive genes in bone marrow-derived mesenchymal progenitor cells.
a A threshold of p = 0.05 was used to identify differentially regulated genes between the groups. The patterns sought, either (1) genes upregulated with adipogenic media with/without TAK1 inhibitor (TAK1i), which is normalized with TGFB1; or (2) genes downregulated with adipogenic media with/without TAK1i, which is normalized with TGFB1. The identified targets were further analyzed with the DAVID informatics tool to identify significant biological processes. b A heatmap of the differentially expressed genes (347 genes) from the Clariom S Assay (n = 2 for each group) that clusters Control and TGFB1; and ADP and TAK1i. The gene set enrichment analysis for groups: c Control versus adipogenic differentiation; d adipogenic differentiation versus adipogenic differentiation with TGFB1; and e adipogenic differentiation with TGFB1 versus adipogenic differentiation with TGFB1 and TAK1 inhibitor. A positive normalized enrichment score indicates gene sets that are enriched in bm-MPCs exposed to adipogenic differentiation media (c, d) and adipogenic differentiation media with TGFB1 and TAK1 inhibitor (e). A Venn diagram illustrating the enriched pathways found in control and TGFB1 (f) and adipogenic differentiation and TAK1 inhibitor (g). The list of pathways is the common pathways found in all three comparisons.
Fig. 8
Fig. 8. Schematic illustrating the working model of diabetes-induced bone marrow dysfunction.
Transforming growth factor-beta (TGFB) signaling in healthy bone tissues maintains a balance between osteoblastogenesis and adipogenesis, in collaboration through canonical Wnt signaling. At least for adipogenesis, TGFB restricts differentiation of marrow progenitor cells through the non-canonical TGFB-activated kinase 1 (TAK1) mechanism. Elevated glucose levels in diabetes suppress the TGFB signaling pathway, which, through alleviation of TAK1, leads to Pparg induction and expression of fatty acid- and lipid metabolism-regulating genes to favour adipogenesis. Dashed black arrows indicate linkages that require further investigation.

Similar articles

Cited by

References

    1. Ogurtsova K, et al. IDF Diabetes Atlas: Global estimates for the prevalence of diabetes for 2015 and 2040. Diabetes Res Clin. Pr. 2017;128:40–50. - PubMed
    1. Yellowlees Douglas J, et al. Bone marrow-CNS connections: implications in the pathogenesis of diabetic retinopathy. Prog. Retin Eye Res. 2012;31:481–494. - PMC - PubMed
    1. Bhatwadekar AD, et al. Hematopoietic stem/progenitor involvement in retinal microvascular repair during diabetes: Implications for bone marrow rejuvenation. Vis. Res. 2017;139:211–220. - PMC - PubMed
    1. Santopaolo M, Sambataro M, Spinetti G, Madeddu P. Bone marrow as a target and accomplice of vascular complications in diabetes. Diabetes Metab. Res Rev. 2020;36(Suppl 1):e3240. - PubMed
    1. Oikawa A, et al. Diabetes mellitus induces bone marrow microangiopathy. Arterioscler Thromb. Vasc. Biol. 2010;30:498–508. - PMC - PubMed

Publication types

Substances