

Can quantitative peritumoral CT radiomics features predict the prognosis of patients with non-small cell lung cancer? A systematic review
- PMID: 36307554
- PMCID: PMC9935659
- DOI: 10.1007/s00330-022-09174-8
Can quantitative peritumoral CT radiomics features predict the prognosis of patients with non-small cell lung cancer? A systematic review
Abstract
Objectives: To provide an overarching evaluation of the value of peritumoral CT radiomics features for predicting the prognosis of non-small cell lung cancer and to assess the quality of the available studies.
Methods: The PubMed, Embase, Web of Science, and Cochrane Library databases were searched for studies predicting the prognosis in patients with non-small cell lung cancer (NSCLC) using CT-based peritumoral radiomics features. Information about the patient, CT-scanner, and radiomics analyses were all extracted for the included studies. Study quality was assessed using the Radiomics Quality Score (RQS) and the Prediction Model Risk of Bias Assessment Tool (PROBAST).
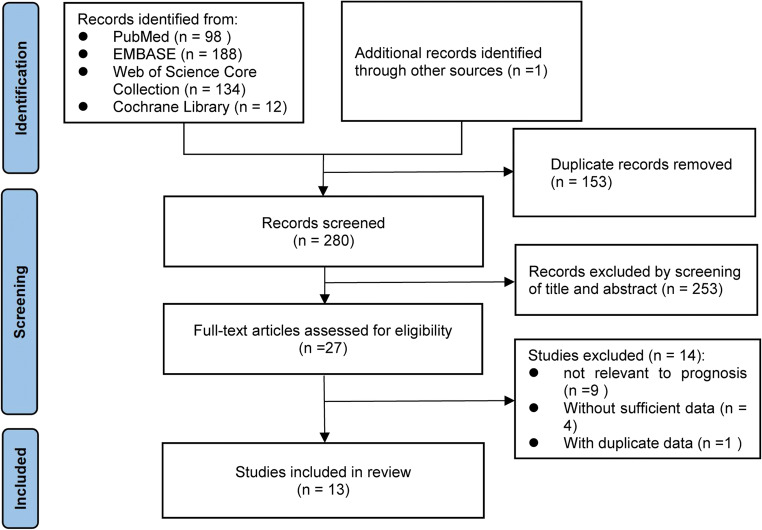
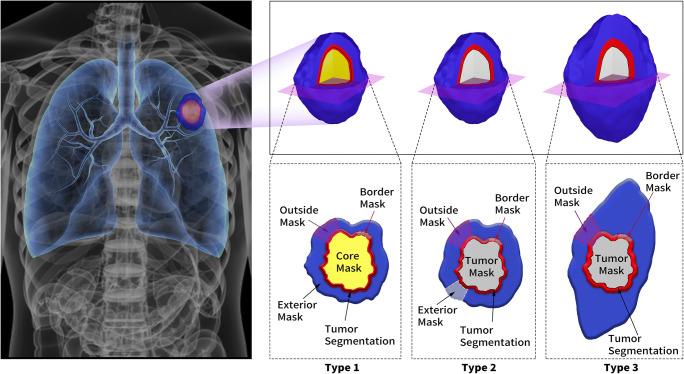
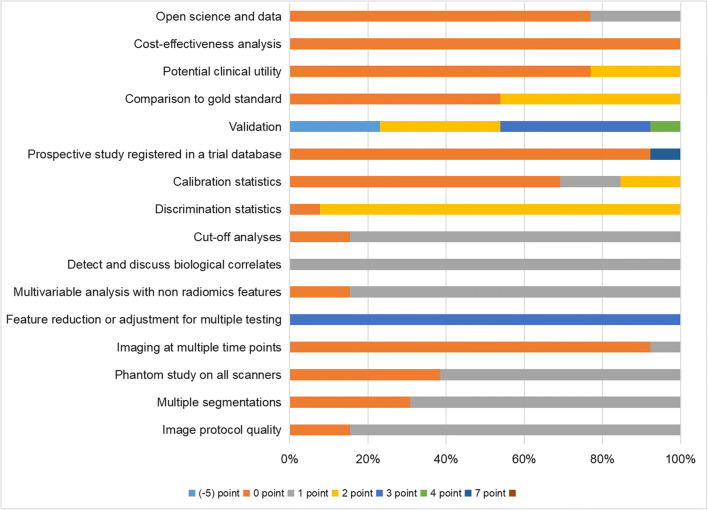
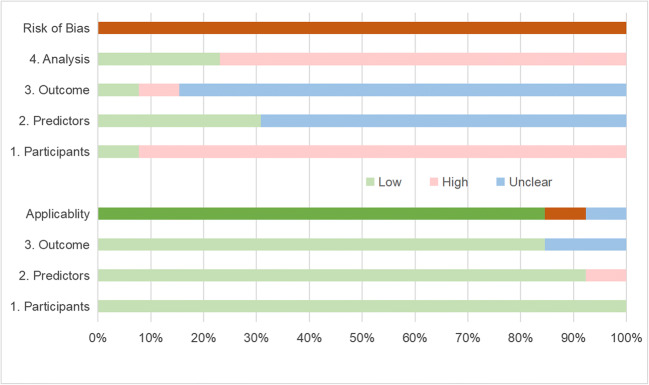
Results: Thirteen studies were included with 2942 patients from 2017 to 2022. Only one study was prospective, and the others were all retrospectively designed. Manual segmentation and multicenter studies were performed by 69% and 46% of the included studies, respectively. 3D-Slicer and MATLAB software were most commonly used for the segmentation of lesions and extraction of features. The peritumoral region was most frequently defined as dilated from the tumor boundary of 15 mm, 20 mm, or 30 mm. The median RQS of the studies was 13 (range 4-19), while all of included studies were assessed as having a high risk of bias (ROB) overall.
Conclusions: Peritumoral radiomics features based on CT images showed promise in predicting the prognosis of NSCLC, although well-designed studies and further biological validation are still needed.
Key points: • Peritumoral radiomics features based on CT images are promising and encouraging for predicting the prognosis of non-small cell lung cancer. • The peritumoral region was often dilated from the tumor boundary of 15 mm or 20 mm because these were considered safe margins. • The median Radiomics Quality Score of the included studies was 13 (range 4-19), and all of studies were considered to have a high risk of bias overall.
Keywords: Carcinoma, non-small-cell lung; Machine learning; Prognosis; Solitary pulmonary nodule; Tomography, X-ray computed.
© 2022. The Author(s).
Conflict of interest statement
The authors of this manuscript declare no relationships with any companies whose products or services may be related to the subject matter of the article.
Figures
Similar articles
-
CT-based radiomics for differentiating invasive adenocarcinomas from indolent lung adenocarcinomas appearing as ground-glass nodules: Asystematic review.Eur J Radiol. 2021 Nov;144:109956. doi: 10.1016/j.ejrad.2021.109956. Epub 2021 Sep 17. Eur J Radiol. 2021. PMID: 34563797 Review.
-
Dual-Region Computed Tomography Radiomics-Based Machine Learning Predicts Subcarinal Lymph Node Metastasis in Patients with Non-small Cell Lung Cancer.Ann Surg Oncol. 2024 Aug;31(8):5011-5020. doi: 10.1245/s10434-024-15197-w. Epub 2024 Mar 23. Ann Surg Oncol. 2024. PMID: 38520581
-
Prognostic Value and Pathological Correlation of Peritumoral Radiomics in Surgically Resected Non-Small Cell Lung Cancer.Acad Radiol. 2024 Sep;31(9):3801-3810. doi: 10.1016/j.acra.2024.01.033. Epub 2024 Feb 23. Acad Radiol. 2024. PMID: 38402002
-
Post-radiotherapy stage III/IV non-small cell lung cancer radiomics research: a systematic review and comparison of CLEAR and RQS frameworks.Eur Radiol. 2024 Oct;34(10):6527-6543. doi: 10.1007/s00330-024-10736-1. Epub 2024 Apr 16. Eur Radiol. 2024. PMID: 38625613 Free PMC article.
-
The influence of image selection and segmentation on the extraction of lung cancer imaging radiomics features using 3D-Slicer software.BMC Cancer. 2025 Apr 17;25(1):728. doi: 10.1186/s12885-025-14094-z. BMC Cancer. 2025. PMID: 40247266 Free PMC article.
Cited by
-
Preoperative CT-based radiomics combined with tumour spread through air spaces can accurately predict early recurrence of stage I lung adenocarcinoma: a multicentre retrospective cohort study.Cancer Imaging. 2023 Sep 7;23(1):83. doi: 10.1186/s40644-023-00605-3. Cancer Imaging. 2023. PMID: 37679806 Free PMC article.
-
Advancing Hepatocellular Carcinoma Management Through Peritumoral Radiomics: Enhancing Diagnosis, Treatment, and Prognosis.J Hepatocell Carcinoma. 2024 Nov 4;11:2159-2168. doi: 10.2147/JHC.S493227. eCollection 2024. J Hepatocell Carcinoma. 2024. PMID: 39525830 Free PMC article. Review.
-
Preoperative assessment of tertiary lymphoid structures in stage I lung adenocarcinoma using CT radiomics: a multicenter retrospective cohort study.Cancer Imaging. 2024 Dec 18;24(1):167. doi: 10.1186/s40644-024-00813-5. Cancer Imaging. 2024. PMID: 39696659 Free PMC article.
-
EfficientNet-Based System for Detecting EGFR-Mutant Status and Predicting Prognosis of Tyrosine Kinase Inhibitors in Patients with NSCLC.J Imaging Inform Med. 2024 Jun;37(3):1086-1099. doi: 10.1007/s10278-024-01022-z. Epub 2024 Feb 15. J Imaging Inform Med. 2024. PMID: 38361006 Free PMC article.
-
Prediction of radiosensitivity in non-small cell lung cancer based on computed tomography and tumor genomics: a multiple real world cohort study.Respir Res. 2025 Apr 11;26(1):134. doi: 10.1186/s12931-025-03202-z. Respir Res. 2025. PMID: 40217247 Free PMC article.
References
Publication types
MeSH terms
Grants and funding
LinkOut - more resources
Full Text Sources
Medical
