. 2022 Dec;32(12):1047-1067.
doi: 10.1038/s41422-022-00736-5. Epub 2022 Oct 28.

Integrated proteogenomic characterization across major histological types of pituitary neuroendocrine tumors

Affiliations

Integrated proteogenomic characterization across major histological types of pituitary neuroendocrine tumors

Fan Zhang et al. Cell Res. 2022 Dec.

Abstract

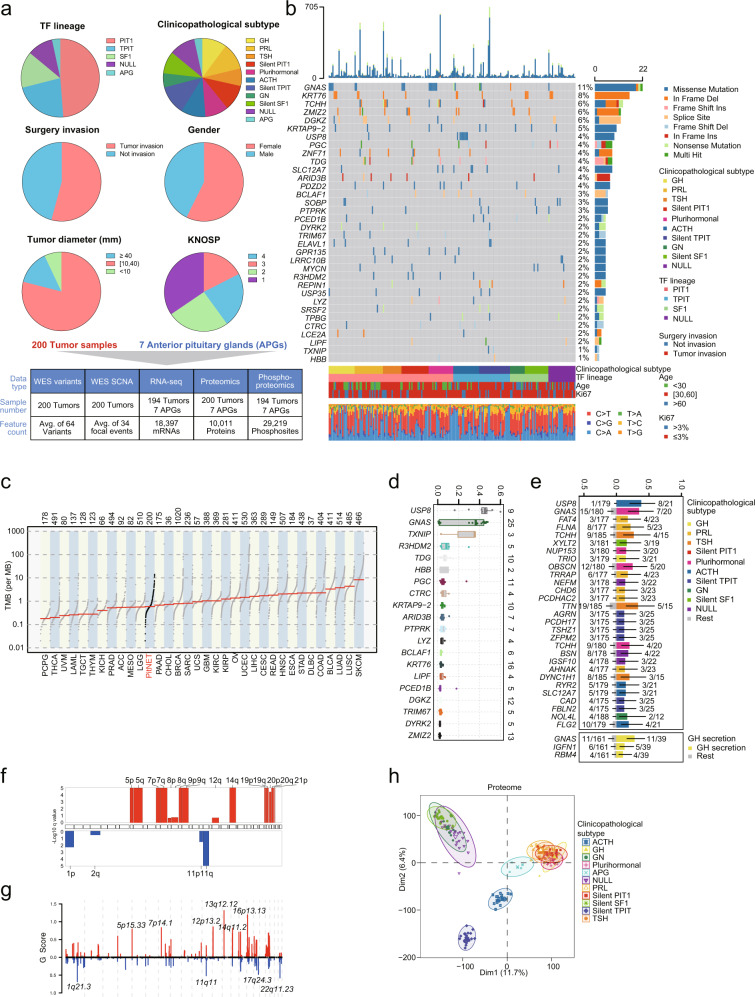
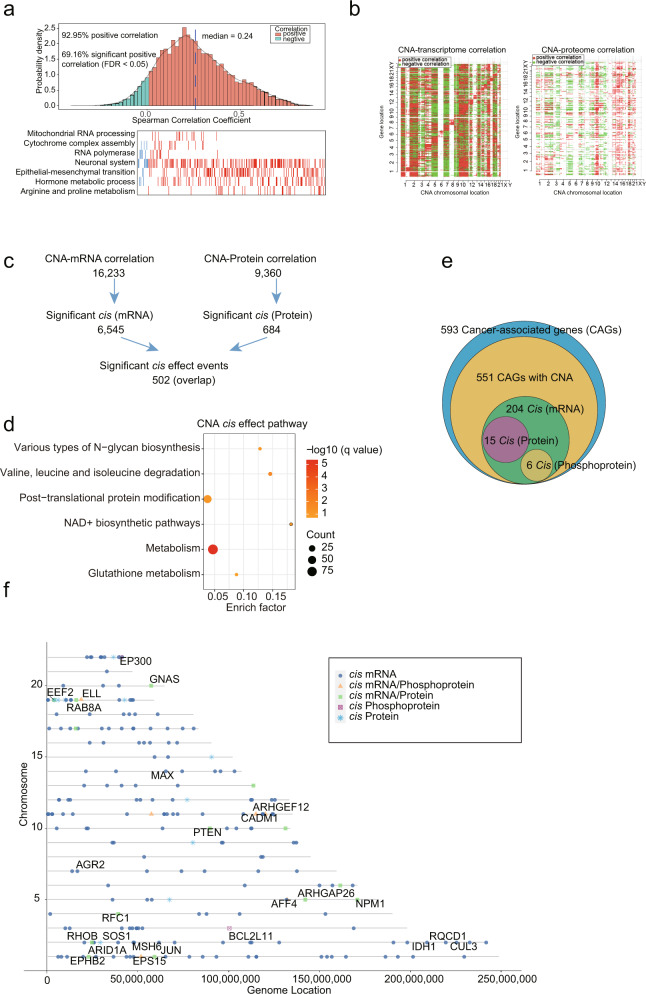
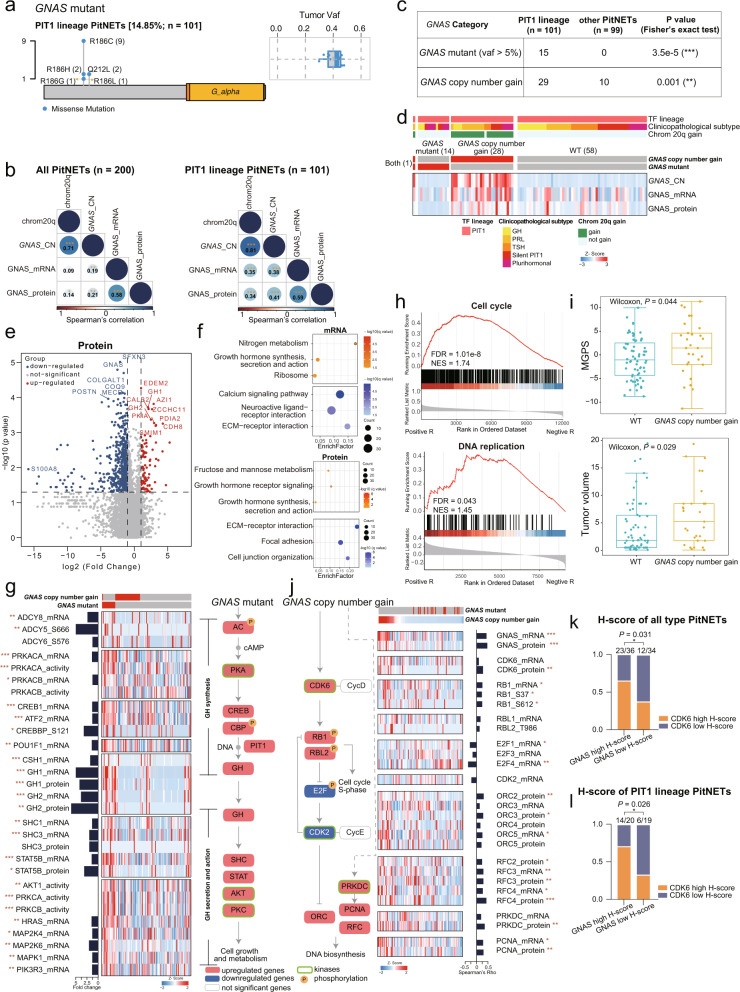
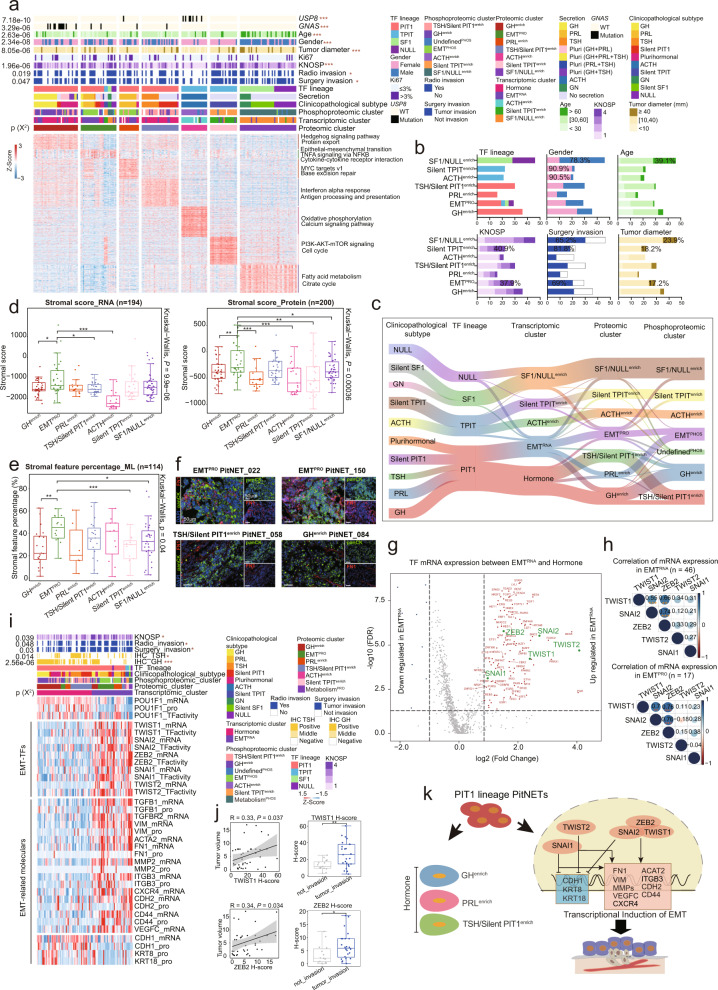
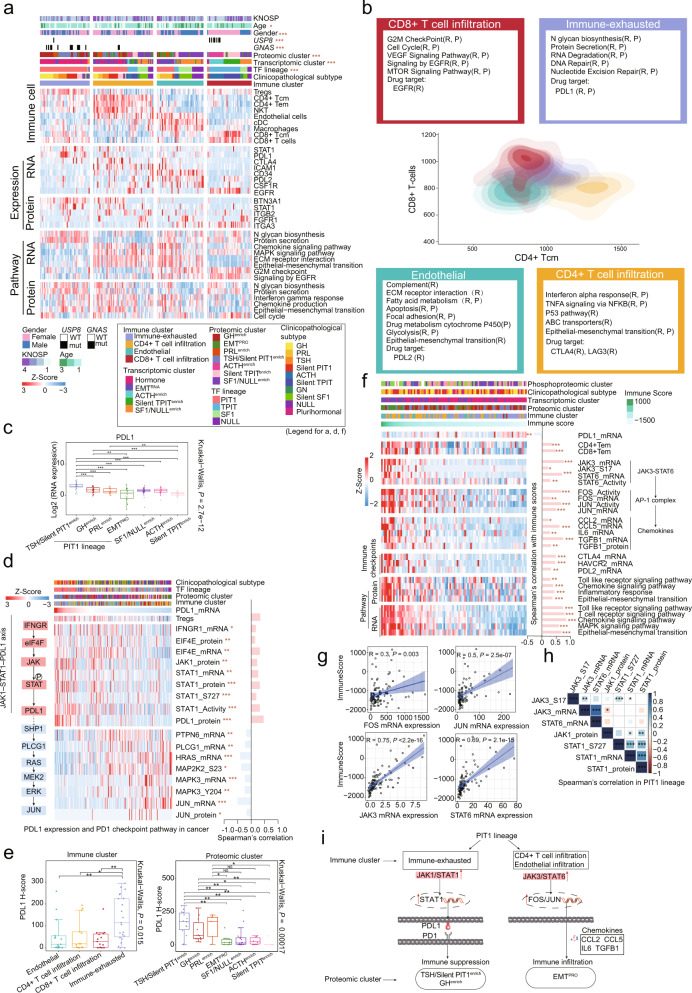
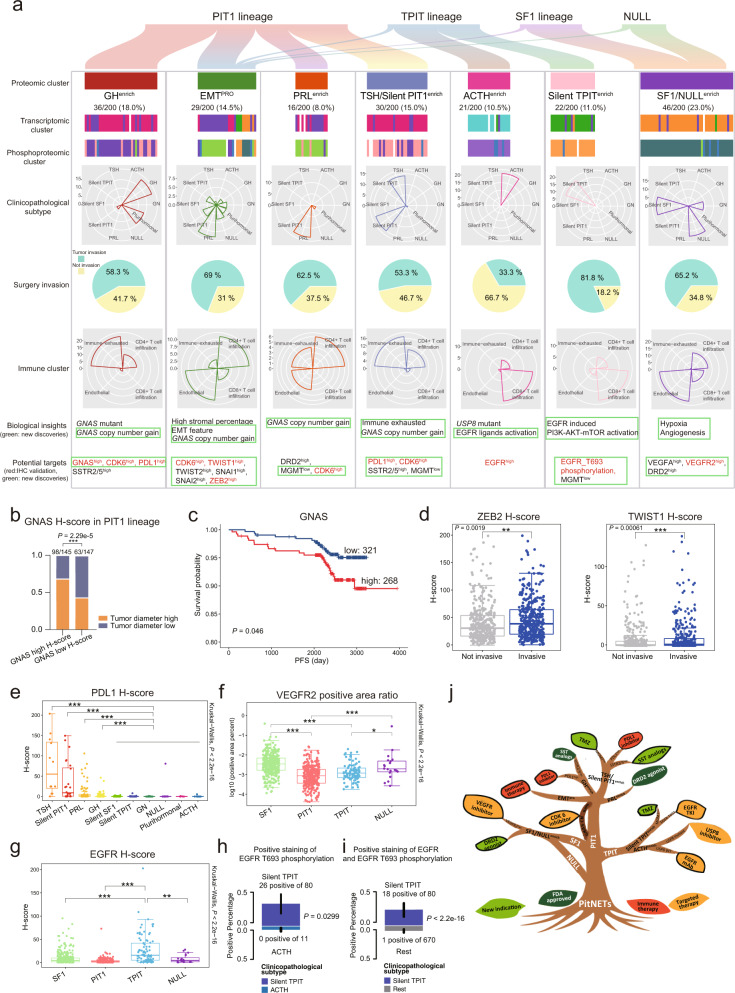
Pituitary neuroendocrine tumor (PitNET) is one of the most common intracranial tumors. Due to its extensive tumor heterogeneity and the lack of high-quality tissues for biomarker discovery, the causative molecular mechanisms are far from being fully defined. Therefore, more studies are needed to improve the current clinicopathological classification system, and advanced treatment strategies such as targeted therapy and immunotherapy are yet to be explored. Here, we performed the largest integrative genomics, transcriptomics, proteomics, and phosphoproteomics analysis reported to date for a cohort of 200 PitNET patients. Genomics data indicate that GNAS copy number gain can serve as a reliable diagnostic marker for hyperproliferation of the PIT1 lineage. Proteomics-based classification of PitNETs identified 7 clusters, among which, tumors overexpressing epithelial-mesenchymal transition (EMT) markers clustered into a more invasive subgroup. Further analysis identified potential therapeutic targets, including CDK6, TWIST1, EGFR, and VEGFR2, for different clusters. Immune subtyping to explore the potential for application of immunotherapy in PitNET identified an association between alterations in the JAK1-STAT1-PDL1 axis and immune exhaustion, and between changes in the JAK3-STAT6-FOS/JUN axis and immune infiltration. These identified molecular markers and alternations in various clusters/subtypes were further confirmed in an independent cohort of 750 PitNET patients. This proteogenomic analysis across traditional histological boundaries improves our current understanding of PitNET pathophysiology and suggests novel therapeutic targets and strategies.


Conflict of interest statement

The authors declare no competing interests.

Figures

Fig. 1
Fig. 1. Proteogenomic landscape of PitNETs.
a Top panel, pie charts of clinical indicators. Bottom panel, sample numbers and multi-omics datasets of the cohort. b Genomic profile and associated clinical features of patients with PitNETs. SMGs in this dataset identified by MutSigCV and OncodriveCLUST (q value < 0.1) are shown. Right panel, percentage of samples affected. Top panel, number of mutations per sample. Middle panel, distribution of significant mutations across sequenced samples, color coded by mutation type. Bottom panel, percentage of somatic base changes per sample. c Comparison of the TMB of our PitNETs cohort and 33 cancer types in TCGA studies. d Boxplot showing the VAF of the top 20 SMGs. e Bar plot showing the genes with significantly different mutation frequencies based on Fisher’s exact test by clinicopathological subtype (Fisher’s exact test, P value < 0.01). The numbers listed on the right side of the barplot represented the mutation frequencies in the indicated clinicopathological subtype tumors. The numbers listed on the left side of the barplot represented the mutation frequencies in the rest tumors. f, g Arm-level and focal-level amplifications and deletions. GISTIC analysis was performed to determine significant regions and genes included in the recurrent CNAs identified in patients with PitNETs. h PCA analysis of proteomics data from 200 PitNETs and 7 APGs based on clinicopathological subtypes.
Fig. 2
Fig. 2. Impact of CNAs on the transcriptome, proteome and phosphoproteome of PitNETs.
a Gene-wise mRNA-protein Spearman’s correlation in tumors. Red, pathways involving positively correlated genes; blue, pathways involving negatively correlated genes (Spearman’s correlation, FDR < 0.05). b The correlation of CNAs to mRNA (left) or protein abundance (right), with significant positive correlations in red and negative correlations in green (Spearman’s correlation, FDR < 0.05). Genes were sorted by chromosomal location on the x- and y-axes. c Cascading effects of CNAs and the overlap between cis events via the transcriptome and proteome analyses (Spearman’s correlation, FDR < 0.05). d Prioritized cis effect CNA drivers were used for pathway enrichment analysis in ConsensusPathDB. e Venn diagram showing the CAGs with significant CNA cis effects via multi-omics data analyses (Spearman’s correlation, FDR < 0.1). f Genes with cascading copy number cis regulation of their cognate mRNA, protein, and phosphoprotein levels. Shapes indicate the cis effects across the indicated datasets.
Fig. 3
Fig. 3. Impact of GNAS mutation and GNAS copy number gain in the PIT1 lineage.
a Lollipop plot and boxplot showing the position and tumor VAF of the GNAS mutation in the PIT1 lineage. b Spearman’s correlation of chromosome 20q and the copy number, mRNA expression and protein abundance of GNAS in all PitNET samples and PIT1 lineage samples. Spearman’s correlation, *P < 0.05, **P < 0.01, ***P < 0.001. c Distribution of GNAS altered samples in different categories among the PIT1 lineage and other lineages (Fisher’s exact test, **P < 0.01, ***P < 0.001). d Heatmap visualizing multi-omics profiles of the levels of GNAS copy number, mRNA expression and protein abundance. e Volcano plots displaying the differentially expressed proteins in GNAS mutant and GNAS WT patients after applying a two-fold change in expression with P < 0.05 (Wilcoxon rank-sum test). Proteins significantly enriched in the GNAS mutant and GNAS WT patients are represented as red/blue-filled dots. f Pathways enriched for the differentially expressed mRNAs and proteins. Pathways that were significantly upregulated/downregulated in the GNAS mutants are represented as red/blue-filled dots. g Heatmap of multi-omics features of GH secretion-related genes. The pathway diagram on the right depicts how the features included in the heatmap regulate GH synthesis, secretion and activity. Red boxes indicate upregulated genes and blue boxes indicate downregulated genes. Green rectangles indicate kinases and orange circles indicate phosphorylated proteins. Bar chart next to the heatmap shows the fold changes of GNAS mutant/WT (*P < 0.05, **P < 0.01, ***P < 0.001). h GSEA plots for proliferation-related pathways based on the rank of GNAS copy number-mRNA (bottom) or protein (upper) abundance correlations. i Boxplots showing the difference of MGPS and tumor volume between WT and GNAS copy number gain group. The significance was calculated by Wilcoxon test. j Heatmap of multi-omics features of proliferation-related genes. The pathway diagram on the left depicts how the features included in the heatmap regulate cell cycle S-phase and DNA biosynthesis. Red boxes indicate upregulated genes and blue boxes indicate downregulated genes. Green rectangles indicate kinases and orange circles indicate phosphorylated protein. Bar chart next to the heatmap shows the Spearman’s correlation coefficient between GNAS copy number and proliferation-related genes (*P < 0.05, **P < 0.01, ***P < 0.001). k, l Bar plots showing the proportion of CDK6 high H-score cells between GNAS high H-score group and GNAS low H-score group in all PitNETs and PIT1 lineage PitNETs. The significance was calculated by Fisher’s exact test.
Fig. 4
Fig. 4. Molecular subtypes of PitNETs based on proteogenomic analysis and association studies.
a Heatmap illustrating the characterization of seven proteomic clusters. Each column represents a patient sample and rows indicate proteins. The color of each cell shows the z score of the protein in that sample. PitNET classification, hormone secretion status, invasion status, clinical features, and mutation status annotations are shown above the heatmap. The chi-square test was used to evaluate the association of proteomic clusters with the 9 variables on the heatmap (*P < 0.05, **P < 0.01, ***P < 0.001). Single-sample Gene Set Enrichment Analysis (ssGSEA) based on proteomics data was also applied to identify the dominant pathway signatures in each proteomic cluster. b Summary of the variables with significant differences among the seven proteomic clusters. The percentage represents the proportion of the population. c Sankey diagram depicting the result of integrative multi-omics analysis, showing the flow of cluster assignments across multiple classification of PitNETs. d Boxplots depicting the distribution of stromal scores inferred by ESTIMATE based on the RNA data (left) and protein data (right) among tumors of the seven proteomic clusters. Kruskal-Wallis test was used to test if any of the differences among the subgroups were statistically significant. The Wilcoxon rank-sum test was used to estimate the difference between two subgroups, *P < 0.05, **P < 0.01, ***P < 0.001. e Boxplot depicting the distribution of stromal scores based on stromal feature percentage_ML among tumors of the seven proteomic clusters. Kruskal-Wallis test was used to test whether any of the differences among the subgroups were statistically significant. Wilcoxon rank-sum test was used to estimate the difference between two subgroups, *P < 0.05, **P < 0.01, ***P < 0.001. f Representative IF staining of pan-cytokeratin (panCK) and fibronectin1 (FN1) in EMTPRO and non-EMTPRO clusters. Scale bar, 50 μm. g Volcano plot showing differential mRNA expression of TFs between EMTRNA and Hormone clusters (the horizontal axis is log2(fold change), and the vertical axis is –log10 FDR). The upregulated TFs in EMTRNA are highlighted in red and EMT-TFs are highlighted in green. h Correlation heatmaps showing the correlation among the mRNA expression of five EMT-TFs in EMTRNA and EMTPRO clusters. Spearman’s correlation, **P < 0.01, ***P < 0.001. i Taking POU1F1 as the positive control, heatmap showing the molecules significantly differentially expressed between EMTRNA and Hormone clusters at the mRNA, protein, and TF activity levels, including EMT-TFs and EMT-related markers. j IHC staining validated the correlation between EMT-TFs and tumor invasion. Scatterplots showing the correlation of H-scores of TWIST1 and ZEB2 with tumor volume (Spearman’s correlation). The boxplots show the association of H-scores of TWIST1 and ZEB2 with surgery invasion status (Wilcoxon rank-sum test). k Summary of the multi-omics classification of the PIT1 lineage.
Fig. 5
Fig. 5. Immune landscape in PitNETs.
a The four immune clusters identified by consensus clustering showing cell-type features, immune checkpoints, and ssGSEA pathways. Differential expression between tumors of one immune cluster vs the rest at the mRNA and protein levels (Wilcoxon rank-sum test, P < 0.05) and the corresponding enriched pathways (Wilcoxon rank-sum test, P < 0.05) were shown. Chi-square test was used to test the association of immune clusters with the 9 variables on the heatmap (*P < 0.05, ***P < 0.001). b Contour plot of two-dimensional density based on CD8+ T cells scores (y-axis) and CD4+ Tcm scores (x-axis) for different immune clusters. For each immune cluster, key upregulated pathways, and significant drug targets (Wilcoxon rank-sum test, P < 0.05) identified based on RNA-seq (R) and proteomics (P) are reported in the annotation boxes. c Boxplot of PDL1 mRNA among the seven proteomic clusters. Kruskal-Wallis test was used to test whether any of the differences among the subgroups were statistically significant. Wilcoxon rank-sum test was used to estimate the significance of two subgroups, **P < 0.01; ***P < 0.001. d PD1-PDL1 signaling pathway-related genes were highly correlated with PDL1 mRNA expression at the mRNA, protein, and phosphoprotein levels in all PitNETs. The bar chart on the right shows Spearman’s correlation coefficient with PDL1 mRNA expression (*P < 0.05, **P < 0.01, ***P < 0.001). e Boxplots showing the PDL1 H-score among proteomic clusters and immune clusters. Kruskal-Wallis test was used to test whether any of the differences among the subgroups were statistically significant. Wilcoxon rank-sum test was used to estimate the significance of two subgroups, *P < 0.05; **P < 0.01, NS, not significant. f Spearman’s correlations (P < 0.05) between the ESTIMATE immune score and proteogenomic profiles of immune infiltration, chemokines, immune checkpoints, and pathways in the PIT1 lineage. g Scatterplots showing the Spearman’s correlation of the immune score with the mRNA expression of FOS, JUN, JAK3, and STAT6. h Spearman’s correlation among JAK1, JAK3, STAT6, and STAT1 at the mRNA, protein, and phosphorylation levels in the PIT1 lineage (*P < 0.05, **P < 0.01, ***P < 0.001). i Diagram depicting the mechanism of the distinct immune clusters within the PIT1 lineage.
Fig. 6
Fig. 6. Summary of molecular characteristics based on proteomic clusters in 200 PitNETs and validation of potential targets in an independent cohort.
a Graphical summary showing the major molecular findings of 200 PitNETs: heatmap showing unbiased consensus clustering of proteomic clusters, transcriptomic clusters and phosphoproteomic clusters; radar maps showing different proportions of seven proteomic clusters in clinicopathological subtypes and immune clusters; pie charts represent surgery invasion; biological insights and potential targets are listed at the bottom. Novel prognostic markers and therapeutic targets were marked by green boxes in the last two lines. IHC validation molecules are marked with red font. b Bar plot showing the proportion of high tumor diameter between GNAS high H-score group and GNAS low H-score group in the cohort of 750 PitNETs. The significance was calculated by Fisher’s exact test. c GNAS staining is correlated with PFS in the cohort of 750 PitNETs (log-rank test). d Boxplots describing the high H-scores of ZEB2 and TWIST1 in tumor invasive group compared with non-invasive group in 750 PitNET cohort (Wilcoxon rank-sum test). e IHC staining of PDL1 in an independent cohort of 750 PitNETs. Boxplot showing the H-score of PDL1 in TSH, silent PIT1, PRL, GH and other clinicopathological subtypes, respectively (Wilcoxon rank-sum test, ***P < 0.001). Kruskal-Wallis test was used to test whether any of the differences among the subgroups were statistically significant. f IHC staining of VEGFR2 in an independent cohort of 750 PitNETs. Boxplot showing the percentage of tumor tissues with positive staining among TF lineages. Kruskal-Wallis test was used to test whether any of the differences among the subgroups were statistically significant. Wilcoxon rank-sum test was used to estimate the significance of two subgroups, *P < 0.05, ***P < 0.001. g IHC staining of EGFR in an independent cohort of 750 PitNETs. Boxplot showing the H-score among TF lineages. Kruskal-Wallis test was used to test whether any of the differences among the subgroups were statistically significant. Wilcoxon rank-sum test was used to estimate the significance of two subgroups, **P < 0.01, ***P < 0.001. h Bar plot showing the proportion of EGFR T693 phosphorylation-positive staining in silent TPIT and ACTH subtypes based on Fisher’s exact test. i Bar plot showing the proportion of both EGFR and EGFR T693 phosphorylation-positive staining in silent TPIT compared to other subtypes based on Fisher’s exact test. j The PitNET tree shows that the main TF lineages (PIT1, TPIT, and SF1) and NULL tumors can be further divided into seven proteomic clusters (GHenrich, EMTPRO, PRLenrich, TSH/silent PIT1enrich, ACTHenrich, silent TPITenrich, and SF1/NULLenrich). Dark green leaves represent drugs with FDA approval for use in the specific reported clinicopathological subtypes, while light green leaves represent new indications of FDA-approved drugs with potential efficacy in patients based on proteomic clusters. Red leaves represent immune therapies and orange leaves represent potential targeted therapies. Leaves with black outlines are newly discovered in our study. Abbreviations in PitNET tree: TMZ, temozolomide; TKI, tyrosine kinase inhibitor; mAB, monoclonal antibody; MGMT, O-6-methylguanine-DNA methyltransferase; SST, somatostatin.

Comment in

Similar articles

Cited by

References

    1. Fernandez A, Karavitaki N, Wass JA. Prevalence of pituitary adenomas: a community-based, cross-sectional study in Banbury (Oxfordshire, UK) Clin. Endocrinol. 2010;72:377–382. doi: 10.1111/j.1365-2265.2009.03667.x. - DOI - PubMed
    1. Melmed S, et al. Diagnosis and treatment of hyperprolactinemia: an Endocrine Society clinical practice guideline. J. Clin. Endocrinol. Metab. 2011;96:273–288. doi: 10.1210/jc.2010-1692. - DOI - PubMed
    1. Molitch ME. Diagnosis and treatment of pituitary adenomas: a review. JAMA. 2017;317:516–524. doi: 10.1001/jama.2016.19699. - DOI - PubMed
    1. Villa C, et al. A standardised diagnostic approach to pituitary neuroendocrine tumours (PitNETs): a European Pituitary Pathology Group (EPPG) proposal. Virchows Arch. 2019;475:687–692. doi: 10.1007/s00428-019-02655-0. - DOI - PubMed
    1. Lopes MBS. The 2017 World Health Organization classification of tumors of the pituitary gland: a summary. Acta Neuropathol. 2017;134:521–535. doi: 10.1007/s00401-017-1769-8. - DOI - PubMed

Publication types