

Evaluation of cross-platform compatibility of a DNA methylation-based glucocorticoid response biomarker
- PMID: 36307860
- PMCID: PMC9617416
- DOI: 10.1186/s13148-022-01352-1
Evaluation of cross-platform compatibility of a DNA methylation-based glucocorticoid response biomarker
Abstract
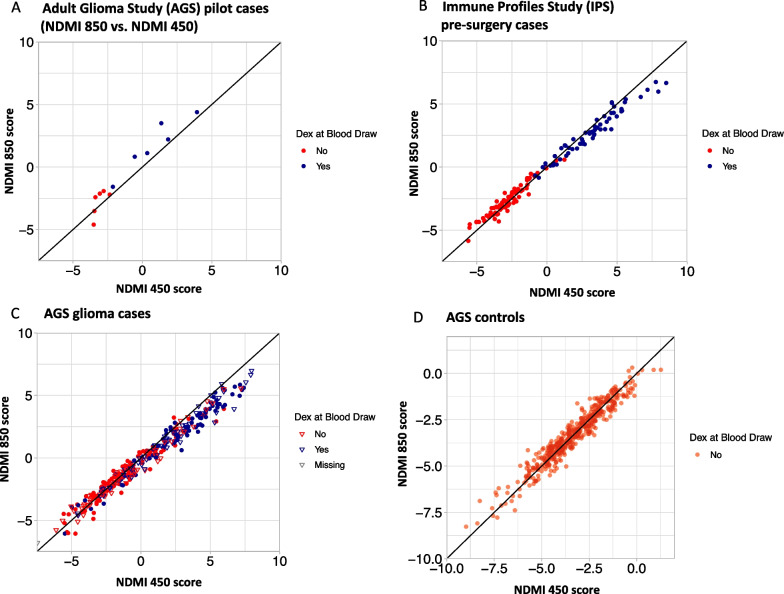
Background: Identifying blood-based DNA methylation patterns is a minimally invasive way to detect biomarkers in predicting age, characteristics of certain diseases and conditions, as well as responses to immunotherapies. As microarray platforms continue to evolve and increase the scope of CpGs measured, new discoveries based on the most recent platform version and how they compare to available data from the previous versions of the platform are unknown. The neutrophil dexamethasone methylation index (NDMI 850) is a blood-based DNA methylation biomarker built on the Illumina MethylationEPIC (850K) array that measures epigenetic responses to dexamethasone (DEX), a synthetic glucocorticoid often administered for inflammation. Here, we compare the NDMI 850 to one we built using data from the Illumina Methylation 450K (NDMI 450).
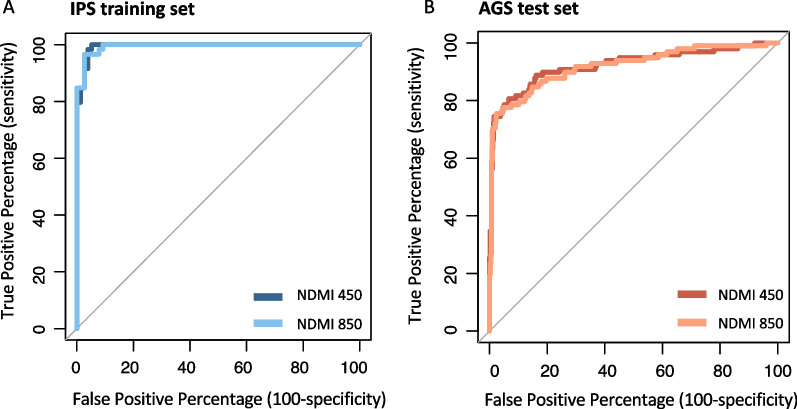
Results: The NDMI 450 consisted of 22 loci, 15 of which were present on the NDMI 850. In adult whole blood samples, the linear composite scores from NDMI 450 and NDMI 850 were highly correlated and had equivalent predictive accuracy for detecting DEX exposure among adult glioma patients and non-glioma adult controls. However, the NDMI 450 scores of newborn cord blood were significantly lower than NDMI 850 in samples measured with both assays.
Conclusions: We developed an algorithm that reproduces the DNA methylation glucocorticoid response score using 450K data, increasing the accessibility for researchers to assess this biomarker in archived or publicly available datasets that use the 450K version of the Illumina BeadChip array. However, the NDMI850 and NDMI450 do not give similar results in cord blood, and due to data availability limitations, results from sample types of newborn cord blood should be interpreted with care.
Keywords: 450K versus 850K; Algorithmic biomarker; Cord blood; DNA methylation; Dexamethasone; Glucocorticoid; Whole blood.
© 2022. The Author(s).
Conflict of interest statement
JKW and KTK are co-founders of Cellintec, which had no role in the current study.
Figures


Similar articles
-
Systematic evaluation of DNA methylation age estimation with common preprocessing methods and the Infinium MethylationEPIC BeadChip array.Clin Epigenetics. 2018 Oct 16;10(1):123. doi: 10.1186/s13148-018-0556-2. Clin Epigenetics. 2018. PMID: 30326963 Free PMC article.
-
DNA methylation as a pharmacodynamic marker of glucocorticoid response and glioma survival.Nat Commun. 2022 Sep 20;13(1):5505. doi: 10.1038/s41467-022-33215-x. Nat Commun. 2022. PMID: 36127421 Free PMC article.
-
Evaluating DNA methylation age on the Illumina MethylationEPIC Bead Chip.PLoS One. 2019 Apr 19;14(4):e0207834. doi: 10.1371/journal.pone.0207834. eCollection 2019. PLoS One. 2019. PMID: 31002714 Free PMC article.
-
Arsenic Exposure and Epigenetic Alterations: Recent Findings Based on the Illumina 450K DNA Methylation Array.Curr Environ Health Rep. 2015 Jun;2(2):137-44. doi: 10.1007/s40572-015-0052-1. Curr Environ Health Rep. 2015. PMID: 26231363 Free PMC article. Review.
-
Establishing an analytic pipeline for genome-wide DNA methylation.Clin Epigenetics. 2016 Apr 27;8:45. doi: 10.1186/s13148-016-0212-7. eCollection 2016. Clin Epigenetics. 2016. PMID: 27127542 Free PMC article. Review.
Cited by
-
Biomarkers of aging through the life course: A Recent Literature Update.Curr Opin Epidemiol Public Health. 2023 Jun;2(2):7-17. doi: 10.1097/pxh.0000000000000018. Curr Opin Epidemiol Public Health. 2023. PMID: 38130910 Free PMC article.
References
Publication types
MeSH terms
Substances
Grants and funding
- R01 CA139020/CA/NCI NIH HHS/United States
- HHSN261201800032I/CA/NCI NIH HHS/United States
- HHSN261201800015I/CA/NCI NIH HHS/United States
- P30 CA082103/CA/NCI NIH HHS/United States
- HHSN261201800009I/CA/NCI NIH HHS/United States
- R25 CA112355/CA/NCI NIH HHS/United States
- R01 CA126831/CA/NCI NIH HHS/United States
- R01 CA216265/CA/NCI NIH HHS/United States
- NU58DP006344/DP/NCCDPHP CDC HHS/United States
- P50 CA097257/CA/NCI NIH HHS/United States
- P20 GM130423/GM/NIGMS NIH HHS/United States
- R01 CA207360/CA/NCI NIH HHS/United States
- UL1 RR024131/RR/NCRR NIH HHS/United States
- R01 CA253976/CA/NCI NIH HHS/United States
- R01 CA052689/CA/NCI NIH HHS/United States
- P20 GM104416/GM/NIGMS NIH HHS/United States
LinkOut - more resources
Full Text Sources
Medical
Research Materials
