

Association between osteocalcin, a pivotal marker of bone metabolism, and secretory function of islet beta cells and alpha cells in Chinese patients with type 2 diabetes mellitus: an observational study
- PMID: 36307866
- PMCID: PMC9615358
- DOI: 10.1186/s13098-022-00932-8
Association between osteocalcin, a pivotal marker of bone metabolism, and secretory function of islet beta cells and alpha cells in Chinese patients with type 2 diabetes mellitus: an observational study
Abstract
Background: Several recent studies have found that Osteocalcin (OCN), a multifunctional protein secreted exclusively by osteoblasts, is beneficial to glucose metabolism and type 2 diabetes mellitus (T2DM). However, the effects of OCN on islets function especially islet ɑ cells function in patients with type 2 diabetes mellitus characterized by a bi-hormonal disease are still unclear. The purpose of this cross-sectional study was to investigate the relationship between serum OCN and the secretion of islet β cells and ɑ cells in Chinese patients with type 2 diabetes mellitus.
Methods: 204 patients with T2DM were enrolled. Blood glucose (FBG, PBG0.5h, PBG1h, PBG2h, PBG3h), insulin (FINS, INS0.5h, INS1h, INS2h, INS3h), C-peptide (FCP, CP0.5h, CP1h, CP2h, CP3h), and glucagon (GLA0, GLA0.5 h, GLA1h, GLA2h, GLA3h) levels were measured on 0 h, 0.5 h, 1 h, 2 h, and 3 h after a 100 g standard bread meal load. Early postprandial secretion function of islet β cells was calculated as Δcp0.5h = CP0.5-FCP. The patients were divided into low, medium and high groups (T1, T2 and T3) according to tertiles of OCN. Comparison of parameters among three groups was studied. Correlation analysis confirmed the relationship between OCN and pancreatic secretion. Multiple regression analysis showed independent contributors to pancreatic secretion.
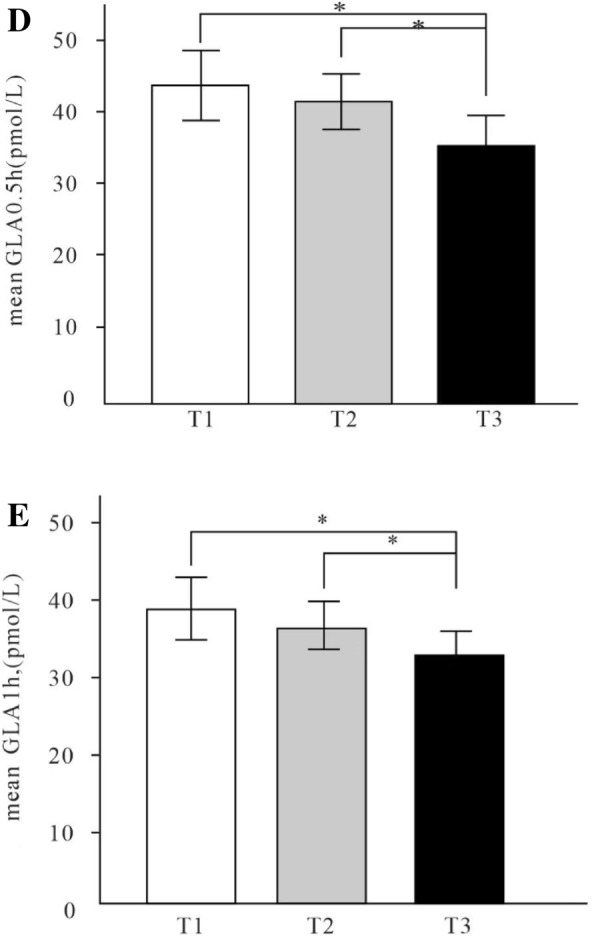
Main results: FBG, and PBG2h were the lowest while Δcp0.5h was the highest in the highest tertile group (respectively, p < 0.05). INS3h, area under the curve of insulin (AUCins3h) in T3 Group were significantly lower than T1 Group (respectively, p < 0.05). GLA1h in T3 group was lower than T1 group (p < 0.05), and GLA0.5 h in T3 group was lower than T2 and T1 groups (p < 0.05). Correlation analysis showed OCN was inversely correlated with Homeostatic model of insulin resistance (HOMA-IR), INS3h, AUCins3h (p < 0.05), and was still inversely correlated with FCP, GLA0.5 h, GLA1h, area under the curve of glucagon (AUCgla3h) (respectively, p < 0.05) after adjustment for body mass index (BMI) and alanine aminotransferase (ALT). The multiple regression analysis showed that OCN was independent contributor to Δcp0.5h, GLA0.5h and GLA1h (respectively, p < 0.05).
Conclusions: Higher serum OCN level is closely related to better blood glucose control, higher insulin sensitivity, increased early-phase insulin secretion of islet β cells and appropriate inhibition of postprandial glucagon secretion of islet ɑ cells in adult patients with type 2 diabetes mellitus.
Keywords: Blood glucose; Glucagon secretion; Pancreatic secretion; Serum osteocalcin; Type 2 diabetes mellitus.
© 2022. The Author(s).
Conflict of interest statement
There are no conflicts of interest.
Figures


References
-
- Unger RH, Orci L. The essential role of glucagon in the pathogenesis of diabetes mellitus. Lancet. 1975;1(7897):14–16. - PubMed
-
- Demant M, Bagger JI, Suppli MP, et al. Determinants of fasting hyperglucagonemia in patients with type 2 diabetes and nondiabetic control subjects. Metab Syndr Relat Disord. 2018;16(10):53–536. - PubMed
Grants and funding
LinkOut - more resources
Full Text Sources
