. 2022 Dec;21(12):e13731.
doi: 10.1111/acel.13731. Epub 2022 Oct 28.

SIAH proteins regulate the degradation and intra-mitochondrial aggregation of PINK1: Implications for mitochondrial pathology in Parkinson's disease

Affiliations

SIAH proteins regulate the degradation and intra-mitochondrial aggregation of PINK1: Implications for mitochondrial pathology in Parkinson's disease

Fatimah Abd Elghani et al. Aging Cell. 2022 Dec.

Abstract

Parkinson's disease (PD) is characterized by degeneration of neurons, particularly dopaminergic neurons in the substantia nigra. PD brains show accumulation of α-synuclein in Lewy bodies and accumulation of dysfunctional mitochondria. However, the mechanisms leading to mitochondrial pathology in sporadic PD are poorly understood. PINK1 is a key for mitophagy activation and recycling of unfit mitochondria. The activation of mitophagy depends on the accumulation of uncleaved PINK1 at the outer mitochondrial membrane and activation of a cascade of protein ubiquitination at the surface of the organelle. We have now found that SIAH3, a member of the SIAH proteins but lacking ubiquitin-ligase activity, is increased in PD brains and cerebrospinal fluid and in neurons treated with α-synuclein preformed fibrils (α-SynPFF). We also observed that SIAH3 is aggregated together with PINK1 in the mitochondria of PD brains. SIAH3 directly interacts with PINK1, leading to their intra-mitochondrial aggregation in cells and neurons and triggering a cascade of toxicity with PINK1 inactivation along with mitochondrial depolarization and neuronal death. We also found that SIAH1 interacts with PINK1 and promotes ubiquitination and proteasomal degradation of PINK1. Similar to the dimerization of SIAH1/SIAH2, SIAH3 interacts with SIAH1, promoting its translocation to mitochondria and preventing its ubiquitin-ligase activity toward PINK1. Our results support the notion that the increase in SIAH3 and intra-mitochondrial aggregation of SIAH3-PINK1 may mediate α-synuclein pathology by promoting proteotoxicity and preventing the elimination of dysfunctional mitochondria. We consider it possible that PINK1 activity is decreased in sporadic PD, which impedes proper mitochondrial renewal in the disease.

Keywords: PINK1; Parkinson's disease; SIAH1; SIAH3; intra-mitochondrial protein aggregation; mitochondrial dysfunction; mitophagy; ubiquitin.


Conflict of interest statement

None declared.

Figures

FIGURE 1
FIGURE 1
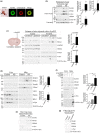
SIAH3 levels are increased in PD brains and CSF. (a,b) Homogenates from substantia nigra (a) or frontal cortex (b) of sporadic PD and matched controls were analyzed with anti‐SIAH3 (upper panel). Graphs depict SIAH3 levels in the nigra (a) and cortex (b) normalized to actin. Figures are the representative of 3 independent Western blot analyses. Values represent the average ± SEM of analyzed samples. *, **** Different from control at p < 0.0001 (a), p = 0.0235 (b) (Student's t test). (c) Aliquotes of CSF of sporadic PD and matched controls were analyzed with anti‐SIAH3, anti‐α‐synuclein and anti‐CHCHD2 antibodies. Ponceau S was used as a loading control. Figure is representative of 3 independent Western blot analyses. Values represent the average ± SEM of analyzed samples. *p = 0.0494 (SIAH3/α‐Syn) and = 0.0425 (SIAH3/Ponceau S) (Student's t test). (d) Levels of endogenous SIAH3 in the presence of control siRNA and siRNA to SIAH3 were determined with anti‐SIAH3. Graph depicts SIAH3 levels relative to actin. Values represent the average ± SEM of 4 experiments. **p = 0.0226 (Student's t test). (e) α‐SynPFF increases the levels of SIAH3 in neurons. Neurons (DIV4) were incubated with monomeric α‐synuclein and α‐synPFF (2 μg/ml) for 14 days. Graphs represent the levels of SIAH3 and PINK1 relative to actin. Values represent the average ± SEM of 3 independent experiments. ** Different from control at p = 0.0013 and 0.002 (SIAH3, control and monomeric, respectively); p = 0.0047 and 0.009 (PINK1, control and monomeric, respectively) (Repeated measures one‐way ANOVA with Bonferroni post‐hoc test). Except for the SIAH3 values in the control nigra (a), all human samples have a normal distribution according to the Shapiro–Wilk test (see Supporting Information).
FIGURE 2
FIGURE 2
SIAH3, along with PINK1, is aggregated in the mitochondria of PD brains. (a) Human substantia nigra were incubated with anti‐SIAH3 and anti‐α‐synuclein antibodies. The panel at the left represents an adjacent section incubated with anti‐SIAH3 antibody alone and developed by DAB staining. An arrow indicates a SIAH3‐positive Lewy body. Neuromelanine is observed in an adjacent neuron without Lewy bodies. The section was counterstained with Mayer's Haematoxilin. Scale, 5 μm (fluorescent panels) and 10 μm (DAB panel). (b) Homogenates from substantia nigra of PD and controls were incubated with proteinase K for 30 min and probed with indicated antibodies. As control, samples not subjected to proteinase K were probed for α‐synuclein (last panel). Graphs depict remaining SIAH3, PINK1 and α‐synuclein levels after 30 min proteinase K. Figures are representative of 3 independent Western blot analyses. Values represent the average ± SEM of analyzed samples. *p = 0.0485 (SIAH3) and 0.0152 (α‐synuclein), ns = 0.0741 (PINK1) (Student's t test). (c) Ipsilateral and contralateral striatum of mice injected unilaterally with α‐SynPFF (30 days) were fractionated into Triton/SDS‐soluble and Triton/SDS‐insoluble fractions. Levels of SIAH3 and PINK1 in the soluble and insoluble fractions were detected with specific antibodies. Differential protein extraction is shown by antibodies used against the indicated proteins. Pathogenicity of α‐SynPFF is shown by the exclusive presence of phosphorylated S129 α‐synuclein in the insoluble fractions of ipsilateral striatum of mice. Figures are the representative of 3 independent Western blot analyses. Values represent the average ± SEM of analyzed samples. *p = 0.0486 (SIAH3), ns p = and 0.1390 (PINK1) (Student's t test). (d) Cytosolic and mitochondrial fractions from human frontal cortex of control and PD brains. The Levels of lSIAH3 and PINK1 in mitochondria were detected with specific antibodies. The purity of the fractionation was determined by the levels of Tom20, VDAC, and LDH. Graphs represent the relative levels of SIAH3 and PINK1 in mitochondrial fractions corrected by the levels of Tom20. Figures are the representative of 3 independent Western blot analyses. Values represent the average ± SEM of analyzed samples. ***p = 0.0004 (SIAH3) and 0.0854 (PINK1) (Student's t test). (e) Purified mitochondria from human frontal cortex of control and PD brains were analyzed by cellulose acetate filter (filter trap assay) using specific antibodies to indicated proteins. (f) Cytosolic and mitochondrial fractions from neurons treated with monomeric α‐synuclein and α‐SynPFF. The levels of SIAH3 and PINK1 in mitochondria were detected with specific antibodies. The purity of fractionation was determined by the levels of HSP60 and LDH. Graphs represent the relative levels of SIAH3 and PINK1 in mitochondrial fractions corrected by the levels of HSP60. Values represent the average ± SEM of 3 independent experiments. *p = 0.0378 (SIAH3, control × α‐SynPFF) and 0.0217 (SIAH3, monomeric × α‐SynPFF) and *, **p = 0.0019 (PINK1, control × α‐SynPFF) and 0.0254 (PINK1 monomeric × α‐SynPFF) (Repeated measures one‐way ANOVA with Bonferroni post‐hoc test). (g) Purified mitochondria from neurons exposed to monomeric α‐synuclein and α‐SynPFF were analyzed by cellulose acetate filter (filter trap assay) using specific antibodies to indicated proteins. All human and mouse samples have a normal distribution according to the Shapiro–Wilk test (see Supporting Information).
FIGURE 3
FIGURE 3
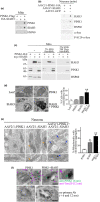
SIAH3 promotes PINK1 aggregation inside the mitochondria of cells and neurons. (a) Mitochondrial fractions were purified from transfected HEK293 cells (a) and neurons (b). The degree of protein aggregation in the mitochondria was determined by cellulose acetate filter (filter trap assay). In A, aggregation of SIAH3 and PINK1 was determined using anti‐HA and anti‐Flag, respectively. In B, SIAH3 and PINK1 aggregation was determined with anti‐SIAH3 and anti‐HA, respectively. (c) Mitochondrial fractions from transfected HEK293 cells were treated with 2% SDS followed by addition of 5M urea. Insoluble pellets of each condition were subjected to Western blot. Levels of SIAH3 and PINK1 were determined with anti‐myc and anti‐HA, respectively. Mitochondrial loading was determined with anti‐HSP60. (d,e) Transmission electron microscopy of transfected HEK293 cells (d) and AAV2/1‐transduced neurons (e) showing aggregate formation inside mitochondria when in the presence of SIAH3 and PINK1. Blue arrows show condensed aggregates by PINK1 and SIAH3 in neurons (right panels). Orange arrows show smaller and less dense aggregates by SIAH3 in neurons (middle panels). Scale, 200 nm (D), 500 and 200 nm (e). Values are the average ± SEM of 3 independent experiments. ** Different from control at p = 0.0042 (d) and * and ** p = 0.0311 and 0.0015, respectively (e) (Repeated measures one‐way ANOVA with Bonferroni post‐hoc test). (f) Immunoelectron microscopy depicts aggregation of PINK1 in the mitochondria by SIAH3. Transfected HEK293 cells were assayed with anti‐PINK1 (green arrows) and anti‐Tom20 (purple arrows). Inset depicts PINK1 aggregate within the mitochondria. Lower panels depict the lack of 6 and 12 nm gold staining when in the absence of primary antibodies. Scale, 200 nm.
FIGURE 4
FIGURE 4
Aggregation promoted by SIAH3 leads to PINK1 inactivation in the mitochondria. (a) HEK293 cells were transfected with HA‐SIAH3, and cleavage of endogenous PINK1 was determined with anti‐PINK1 (upper panel). Graph represents the ratio of cleaved over uncleaved endogenous PINK1. *p = 0.039 (Student's t test). (b) Neurons transduced with AAV2/1 particles driven by synapsin promoter were analyzed for PINK1 cleavage using anti‐HA. *p = 0.0367 (Student's t test). (c) Cell lysates of transfected HEK293 cells were fractionated into cytosolic and mitochondrial fractions. PINK1 and SIAH3 were monitored using anti‐Flag and anti‐HA, respectively. The purity of cytosolic and mitochondrial fractions was examined using anti‐LDH and anti‐HSP60, respectively. Graph represents the ratio of cleaved over uncleaved PINK1. *p = 0.031 (Student's t test). (d) Transfected HEK293 cells were treated with 2% SDS followed by 5M urea and 70% formic acid. Insoluble pellets of each condition were subjected to Western blot. Levels of SIAH3 and PINK1 were determined with anti‐myc and anti‐HA, respectively. LDH was used as loading control. (e) Transfected HEK293 cells were treated for 12 h with 4 μM antimycin, 10 μM oligomycin, and 20 μM QVD (Szargel et al., 2016). Phosphorylation of ubiquitin was analyzed using anti‐phospho‐ubiquitin. Levels of PINK1 and SIAH3 were determined using anti‐Flag and anti‐HA, respectively. Graph represents the percentage of phosphorylated ubiquitin in cells. **p = 0.0064 (Student's t test). (f) Transfected HEK293 cells were incubated with JC‐1 and analyzed by live microscopy. Red JC‐1 corresponds to polarized, whereas green JC‐1 represents depolarized mitochondria (arrow). Transfected cells (BFP‐positive cells) are outlined, and a cell with green only JC‐1 (depolarized) in the presence of SIAH3 and PINK1 is indicated by an arrow. Scale, 10 μm. Graph represents the percentage of transfected cells with depolarized mitochondria (with green only JC‐1). *, *** Different from control at p = 0.0323 and = 0.0001, respectively (Repeated measures one‐way ANOVA with Bonferroni post‐hoc test). Values in all graphs represent the average ± SEM of 3 independent experiments.
FIGURE 5
FIGURE 5
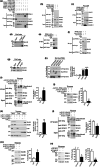
SIAH3 and PINK1 co‐aggregation in mitochondria leads to neuronal toxicity. (a) Mitochondria of transfected HEK293 cells were fractionated, and levels of SIAH3 constructs were determined with anti‐HA. Purity of fractions was determined by anti‐HSP60 and anti‐LDH. Graph represents the levels of HA‐tagged proteins in mitochondria relative to HSP60. ****, ** Different from control at p < 0.0001; p = 0.0055 and 0.0017 (ΔN‐30 and ΔN‐60, respectively) (Repeated measures one‐way ANOVA with Bonferroni post‐hoc test). (b) Mitochondrial fractions from transfected HEK293 cells were analyzed by filter trap assay. The degree of SIAH3 constructs and PINK1 aggregation were determined with anti‐HA and anti‐Flag, respectively. (c) Neurons were transfected with PINK1‐Flag in the presence of HA‐SIAH3 or HA‐LacZ. Neurons were analyzed for mitochondrial (GFP‐mito) clustering and nuclear condensation and fragmentation. Arrows indicate mitochondrial clustering when in the presence of SIAH3 and PINK1. Scale, 10 μm. Graphs depict the percent of GFP‐mito‐positive neurons containing clustered mitochondria and condensed and fragmented nuclei. For mitochondrial clustering, different from control at *, ****p = 0.0318 and <0.0001, respectively. For nuclear condensation, **, **** different from control at p = 0.0015 and <0.0001, respectively (Repeated measures one‐way ANOVA with Bonferroni post‐hoc test). (d) Neurons were transfected with PINK1‐Flag and HA‐SIAH3 constructs and analyzed with anti‐HA (red) and anti‐Tom20 (green). Arrow indicates the presence of full‐length SIAH3 in clustered mitochondria when in the presence of PINK1. Scale, 10 μm. (e) Neurons were transduced with AAV2/1‐PINK1‐HA in the presence of AAV2/1‐SIAH3 or AAV2/1‐SIAH3 ΔN‐60 and analyzed with anti‐HA (green) and anti‐Tom20 (red). Arrows indicate the presence of PINK1‐positive clusters when in the presence of SIAH3 but not SIAH3 ΔN‐60. Scale, 10 μm. Values in all graphs represent the average ± SEM of 3 independent experiments.
FIGURE 6
FIGURE 6
SIAH1 promotes ubiquitination and degradation of PINK1 and SIAH3 hinders this process. (a) Co‐immunoprecipitation of PINK1 with SIAH3. Transfected HEK293 cell lysates were subjected to immunoprecipitation with anti‐myc. Co‐immunoprecipitation of PINK1 was detected with anti‐Flag. Immunoprecipitation was detected with anti‐myc. (b) Co‐immunoprecipitation of HA‐tagged PINK1 with SIAH3. Transfected HEK293 cell lysates were subjected to immunoprecipitation with anti‐HA. Co‐immunoprecipitation of SIAH3, but not LacZ, was detected with anti‐myc. Immunoprecipitation of PINK1 was detected with anti‐HA. (c) Co‐immunoprecipitation of PINK1 with SIAH3 in N2a cells. Transfected N2a cell lysates were processed for immunoprecipitation with anti‐HA. Co‐immunoprecipitation of SIAH3, but not the control FKBP12, was detected with anti‐myc. Immunoprecipitation of PINK1 was detected with anti‐HA. (d) Endogenous PINK1 was immunoprecipitated from brain lysate using anti‐PINK1 (lower panel), and co‐immunoprecipitation of SIAH3 with PINK1, but not with IgG, was determined with anti‐SIAH3 (upper panel). (e) Co‐immunoprecipitation of SIAH1 with PINK1. Transfected HEK293 cell lysates were subjected to immunoprecipitation with anti‐HA. Co‐immunoprecipitation of SIAH1 was detected with anti‐myc. Immunoprecipitation of PINK1 was detected with anti‐HA. (f) Reverse assay shows the co‐immunoprecipitation of PINK1 (anti‐PINK1) with SIAH1, but not with the control LacZ (anti‐myc). (g) PINK1 and SIAH1 interact in vivo. PINK1 was immunoprecipitated from rat brains using anti‐PINK1 antibody (lower panel), and co‐immunoprecipitation was determined with anti‐SIAH1 antibody (upper panel). (h) Direct binding of recombinant purified PINK1 and SIAH3 as well as SIAH1. Purified GST‐proteins (SIAH3, SIAH1 and 14‐3‐3) were incubated with His‐PINK1, and binding was determined using anti‐GST antibody (first panel). Levels of added His‐PINK1 (second panel) and GST‐proteins (third panel) were determined by anti‐His and anti‐GST antibodies, respectively. Graph represents the binding of SIAH3, SIAH1, and 14‐3‐3 proteins to His‐PINK1 compared to that of His alone. **** Different from control at p < 0.0001 (Repeated measures one‐way ANOVA with Bonferroni post‐hoc test). (i) SIAH1 promotes the ubiquitination of PINK1 in neurons. AAV2/1‐transduced neurons were treated with 10 μM lactacystin for 16 h. PINK1‐HA was immunoprecipitated with anti‐HA, and ubiquitination of the immunoprecipitate was determined with anti‐ubiquitin. Graph shows the percent of ubiquitinated PINK1‐HA relative to the levels of immunoprecipitated PINK1‐HA. *p = 0.0226 (Student's t test). (j) SIAH1 decreases PINK1 steady‐state levels in neurons. AAV2/1‐transduced neurons were analyzed for the levels of PINK1 using anti‐HA. Graph depicts the percent of PINK1‐HA relative to actin. **p = 0.0011 (Student's t test). (k) SIAH3 promotes the translocation of SIAH1 to the mitochondria of neurons. Mitochondrial fractions from transduced neurons were analyzed, and the presence of SIAH1 was determined with anti‐SIAH1 (first panel). Levels of SIAH3 in mitochondria was detected with anti‐SIAH3 (second panel). Fractionation purity was determined by Tom20 and LDH. Graph represents the levels of SIAH1 in mitochondrial fractions corrected to the levels of Tom20, in the absence and presence of SIAH3. **p = 0.0077 (Student's t test). (l) Decrease of SIAH1 auto‐ubiquitination by SIAH3 in neurons. Levels of SIAH1 ubiquitination were determined with anti‐ubiquitin (first panel). Immunoprecipitated SIAH1 was detected with anti‐SIAH1 (second panel). Graph represents the percent of ubiquitinated SIAH1 relative to the levels of immunoprecipitated SIAH1. *p = 0.0169 (Student's t test). (m) Accumulation of SIAH1 steady‐state by SIAH3 in neurons. Levels of SIAH1 in AAV2/1‐transduced neurons were determined with anti‐SIAH1 (upper panel). Graph depicts the percent of SIAH1 relative to actin, in the presence of GFP and SIAH3. *p = 0.0253 (Student's t test). (n) Neurons were transfected with siRNA control and siRNA to SIAH3. Levels of PINK1 and SIAH1 were determined with anti‐PINK1 and anti‐SIAH1, respectively. Graphs represent the percent of PINK1 and SIAH1 relative to actin, in the presence of siControl and siSIAH3. *, **p = 0.0204 and 0.033, respectively (Student's t test). Values in all graphs represent the average ± SEM of 3 independent experiments.

References

    1. Arena, G. , & Valente, E. M. (2017). PINK1 in the limelight: Multiple functions of an eclectic protein in human health and disease. The Journal of Pathology, 241(2), 251–263. 10.1002/path.4815 - DOI - PubMed
    1. Dehay, B. , Bove, J. , Rodriguez‐Muela, N. , Perier, C. , Recasens, A. , Boya, P. , & Vila, M. (2010). Pathogenic lysosomal depletion in Parkinson's disease. The Journal of Neuroscience, 30(37), 12535–12544. 10.1523/JNEUROSCI.1920-10.2010 - DOI - PMC - PubMed
    1. Di Maio, R. , Barrett, P. J. , Hoffman, E. K. , Barrett, C. W. , Zharikov, A. , Borah, A. , Hu, X. , McCoy, J. , Chu, C. T. , Burton, E. A. , Hastings, T. G. , & Greenamyre, J. T. (2016). Alpha‐synuclein binds to TOM20 and inhibits mitochondrial protein import in Parkinson's disease. Science Translational Medicine, 8(342), 342ra378. 10.1126/scitranslmed.aaf3634 - DOI - PMC - PubMed
    1. Engelender, S. , & Isacson, O. (2017). The threshold theory for Parkinson's disease. Trends in Neurosciences, 40(1), 4–14. 10.1016/j.tins.2016.10.008 - DOI - PubMed
    1. Gandhi, S. , Muqit, M. M. , Stanyer, L. , Healy, D. G. , Abou‐Sleiman, P. M. , Hargreaves, I. , Heales, S. , Ganguly, M. , Parsons, L. , Lees, A. J. , Latchman, D. S. , Holton, J. L. , Wood, N. W. , & Revesz, T. (2006). PINK1 protein in normal human brain and Parkinson's disease. Brain, 129(Pt 7), 1720–1731. 10.1093/brain/awl114 - DOI - PubMed

Publication types