. 2023 Jan;12(2):e2201891.
doi: 10.1002/adhm.202201891. Epub 2022 Nov 17.

Swelling-Dependent Shape-Based Transformation of a Human Mesenchymal Stromal Cells-Laden 4D Bioprinted Construct for Cartilage Tissue Engineering

Affiliations

Swelling-Dependent Shape-Based Transformation of a Human Mesenchymal Stromal Cells-Laden 4D Bioprinted Construct for Cartilage Tissue Engineering

Pedro J Díaz-Payno et al. Adv Healthc Mater. 2023 Jan.

Abstract

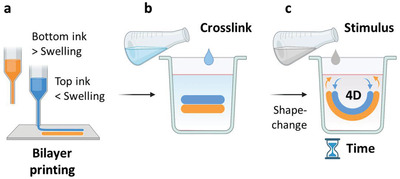
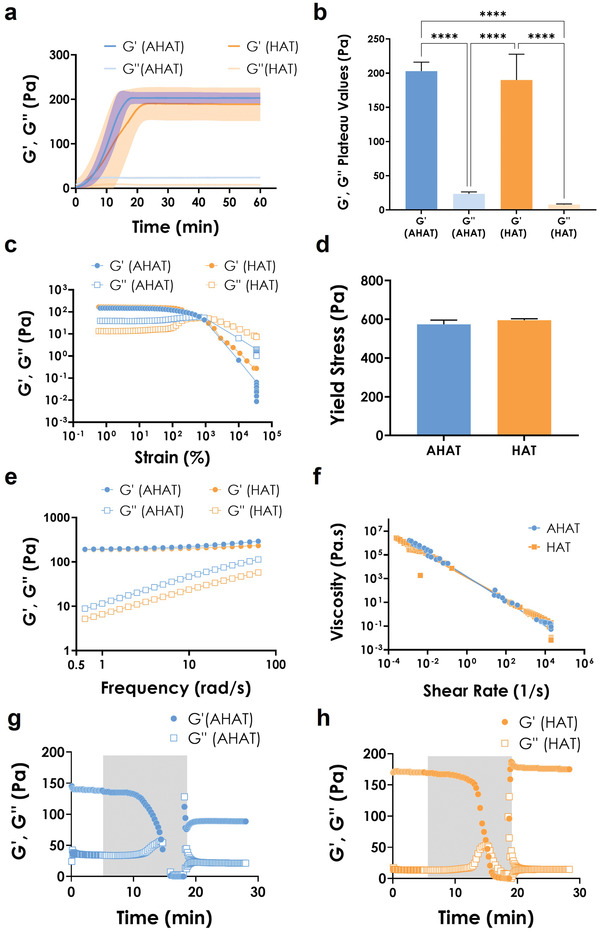
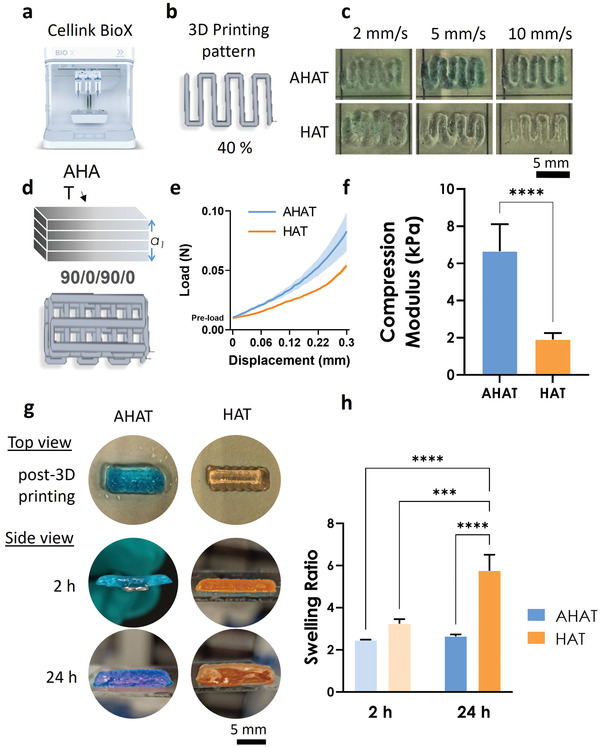
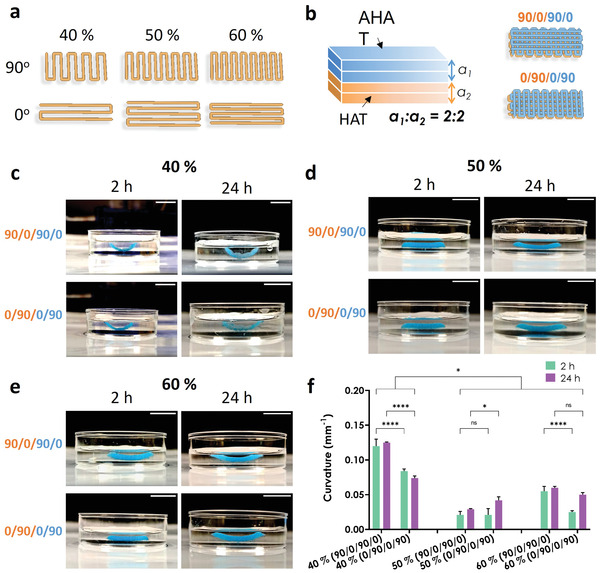
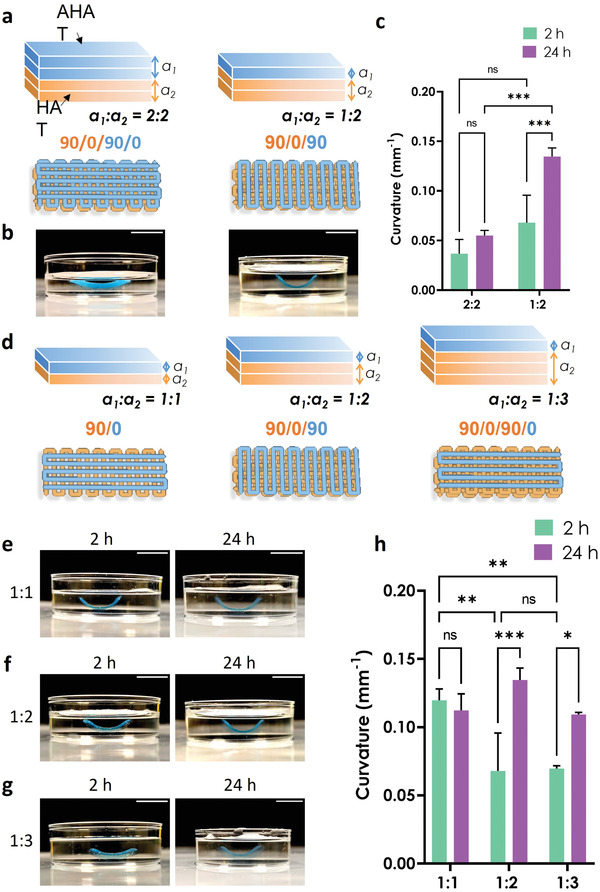
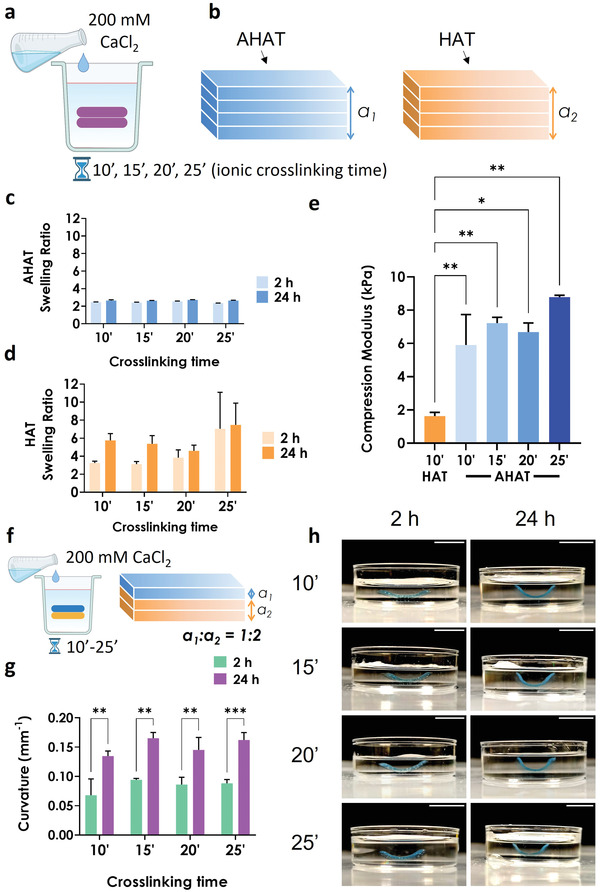
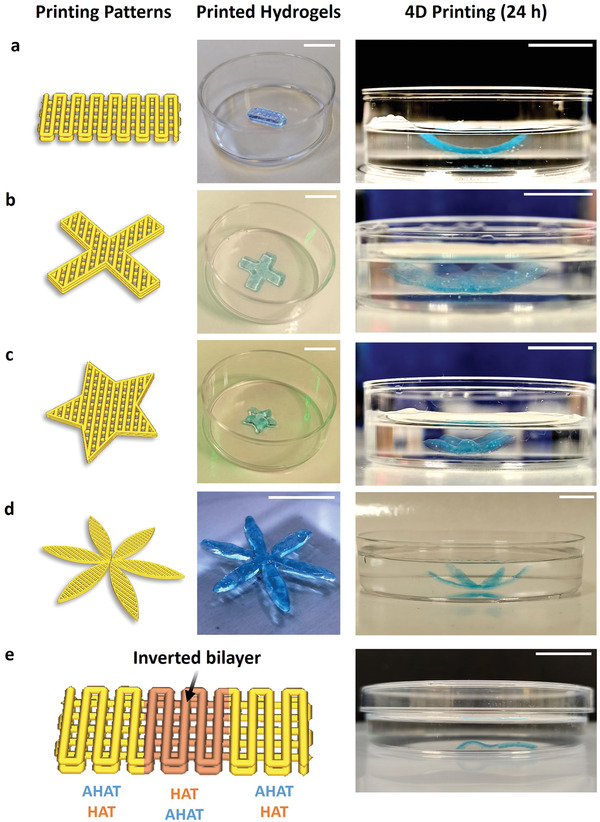
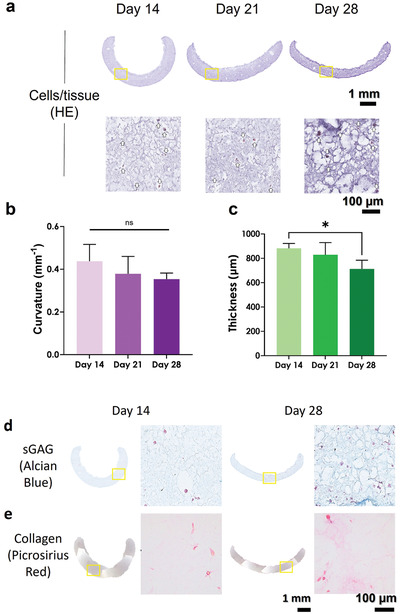
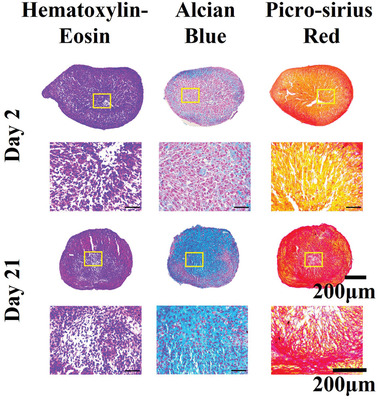
3D bioprinting is usually implemented on flat surfaces, posing serious limitations in the fabrication of multilayered curved constructs. 4D bioprinting, combining 3D bioprinting with time-dependent stimuli-induced transformation, enables the fabrication of shape-changing constructs. Here, a 4D biofabrication method is reported for cartilage engineering based on the differential swelling of a smart multi-material system made from two hydrogel-based materials: hyaluronan and alginate. Two ink formulations are used: tyramine-functionalized hyaluronan (HAT, high-swelling) and alginate with HAT (AHAT, low-swelling). Both inks have similar elastic, shear-thinning, and printability behavior. The inks are 3D printed into a bilayered scaffold before triggering the shape-change by using liquid immersion as stimulus. In time (4D), the differential swelling between the two zones leads to the scaffold's self-bending. Different designs are made to tune the radius of curvature and shape. A bioprinted formulation of AHAT and human bone marrow cells demonstrates high cell viability. After 28 days in chondrogenic medium, the curvature is clearly present while cartilage-like matrix production is visible on histology. A proof-of-concept of the recently emerged technology of 4D bioprinting with a specific application for the design of curved structures potentially mimicking the curvature and multilayer cellular nature of native cartilage is demonstrated.

Keywords: 4D bioprinting; biofabrication; shape-change; smart bioinks; tissue engineering.


Conflict of interest statement

The authors declare no conflict of interest.

Figures

Figure 1
Figure 1
4D printing concept based on swelling‐based differential growth. a) A schematic drawing of the two inks 3D printed into a bilayer: high swelling (bottom layer, in orange) and low swelling (top layer, in blue). b) The scaffold is then crosslinked to obtain a solid construct. c) Finally, a swelling‐based stimulus is applied on the construct, which triggers the construct's shape‐based transformation behavior over time (4D).
Figure 2
Figure 2
The rheological characterization of the inks made of Alginate/Hyaluronan‐ Tyramine (AHAT) and Hyaluronan‐Tyramine (HAT) for extrusion‐based 3D printing. a) The time dependence of the linear storage (G’) and loss modulus (G”) of AHAT (blue) and HAT (orange). The shaded area represents the standard deviation. b) The plateau values of G’ and G” for AHAT (blue) and HAT (orange). c) The amplitude strain sweep for the AHAT (blue) and HAT (orange) inks. The storage moduli, G’, are plotted as circles while loss moduli, G”, are plotted as squares. d) The yield stress values of AHAT (blue) and HAT (orange) determined by large amplitude oscillatory shear. e) The frequency dependence of the storage (G’) (circles) and loss moduli (G”) (squares) of the AHAT (blue) and HAT (orange) inks. f) The shear rate, γ˙, dependence of the shear viscosity, η, of the AHAT (blue) and HAT (orange). g) The oscillatory thixotropy tests for AHAT and h) HAT, where the shaded area represents the second step in which the stress was increased from 1 Pa to 5 kPa logarithmically, while the non‐shaded area was kept at a constant strain of 0.5% (Figure S1, Supporting Information).
Figure 3
Figure 3
The characterization of the stiffness and swelling ratio of the 3D printed scaffolds after ionic crosslinking. a) The BioX Cellink printer used for the studies (reproduced with Cellink permission). b) The pattern design of one layer (40% infill rectangle) used to optimize the printing parameters of the biomaterial inks. c) Representative images of one layer printed at different speeds (i.e., 2, 5, and 10 mm s−1) using the design in (b) for both inks. d) Top: Schematic drawing of the 3D scaffolds containing 4 layers fabricated with either the AHAT or HAT ink and the printing pattern design of the scaffolds organized in the raster angles of 90/0/90/0 degrees for each layer. e) The load versus displacement curve of the 3D scaffolds under unconfined compression test. The standard deviation is depicted using a shadowed color (both groups, n = 3). f) The Young's modulus of the 3D scaffolds obtained from the strain versus stress curve (n = 3). g) Representative images of the ionically crosslinked 3D printed scaffolds using the designs in (d), for each ink: either AHAT (blue) or HAT (orange) at different time‐points: post‐fabrication, 2 and 24 h after immersion in 0.9% NaCl. h) The swelling ratio of each ionically crosslinked 3D printed type of scaffold after 2 and 24 h of immersion (n = 3).
Figure 4
Figure 4
The effects of the printing angle and infill density on the degree of curvature. a) The design of the printing patterns used for the layers with different printing angles (either 90° or 0°) and different infill densities (i.e., 40, 50, or 60%). b) Schematic drawing of the 3D bilayered scaffolds showing the 4 sublayers: the two top sublayers were made of AHAT (blue, a1) while the two bottom sublayers were made of HAT (orange, a2). The two printing pattern designs of the 3D bilayered scaffolds with different printing angles (90/0/90/0° and 0/90/0/90°) are also presented. c) Representative images of the scaffolds printed with an infill density of 40% and starting either at a printing angle of 90° or at 0°. The photographs were taken either 2 h or 24 h after the application of the stimulus. AHAT is colored in blue, while HAT is translucent (or orange in the schematic drawing). d) Representative images of the scaffolds with an infill density of 50%. e) Representative images of the scaffolds with an infill density of 60%. f) The degree of curvature (1/mm) measured from the pictures of the scaffolds in (c), (d), and (e) (n = 3). The scale bar in all sub‐figures corresponds to a length of 10 mm.
Figure 5
Figure 5
The effects of the bilayer ratio (AHAT:HAT) on the degree of curvature. a) Schematic drawing of the 3D printed biphasic scaffolds made of either 2 layers of each material (left) or 1 layer of AHAT and 2 layers of HAT (right), and the corresponding printing patterns starting with the same printing angle (90°) and infill density (60%). b) Representative images of the scaffolds after 24 h of stimulus application. c) The degree of curvature (1/mm) measured from the pictures of the scaffolds at two different time points (n ≥ 3). d) Schematic drawing of the 3D printed biphasic scaffolds made with three configurations: 1 layer of each material (left), 1 layer of AHAT with 2 layers of HAT (middle), or 1 layer of AHAT and 3 layers of HAT (right). The corresponding printing patterns starting with the same printing angle (90°) and infill density (60%) are also presented. e–g) Representative images of the scaffolds with different AHAT:HAT layer ratios after 2 and 24 h of stimulus application. h) The degree of curvature (1/mm) measured from the photographs of the scaffolds at two different time‐points (n = 3). The scale bars in all the sub‐figures correspond to 10 mm.
Figure 6
Figure 6
The effects of ionic crosslinking time on the degree of curvature. a) Schematic drawing representing the post‐printing ionic crosslinking treatment with 200 mm CaCl2 for 10 to 25 min. b) Schematic drawing of a single‐material 3D printed scaffolds made of either AHAT (blue) or HAT (orange). c,d) The swelling ratio of either AHAT or HAT 3D printed scaffolds with different crosslinking times, after 2 or 24 h of stimulus application. e) Young's modulus of the HAT scaffolds after 10 min of crosslinking and of the AHAT scaffolds after different crosslinking times (n = 3). f) Schematic drawing illustrating the post‐printing crosslinking treatment with 200 mm CaCl2 for 10 min of the biphasic 3D printed scaffold with 1 top layer of stable AHAT (blue) and 2 bottom layers of swellable HAT biomaterial ink (orange). g) The curvature of each scaffold crosslinked at different times, after 2 or 24 h of stimulus application. h) Representative images of the scaffolds crosslinked with different times, after 2 and 24 h of stimulus application. Scale bar for all pictures: 10 mm.
Figure 7
Figure 7
Structurally different constructs exhibiting different types of shape transformation. Representative images of the construct post‐printing, and after 24 h of stimulus application for the biphasic scaffolds made of one top layer AHAT and two bottom layers of HAT ink in the shape of: a) A (standard) rectangular construct, b) a cross‐shaped construct, c) a star‐shaped construct, d) a flower‐shaped construct, and e) a scaffold designed with alternating regions HAT/AHAT–AHAT/HAT– HAT/AHAT to create S‐shaped structures. The scale bars in all sub‐figures correspond to 10 mm.
Figure 8
Figure 8
The effects of ionic crosslinking and 4D bioprinting on cell viability. a) Schematic drawing of the CaCl2 treatment on a monolayer of hMSCs. b) Live/dead fluorescent images showing alive cells in green and damaged/dead cells in red after exposure to different concentrations of CaCl2 at different times (emulating potential scaffold crosslinking treatments). c) The heat‐map plot quantifying the live/dead ratio in (b). d) Schematic drawing of the 4D bioprinting process from post‐printing ionic crosslinking with 200 mm CaCl2 for 10 min to 4D stimulus application via subsequent exposure to DMEM medium. e) The live/dead fluorescent representative images of the cell‐laden scaffolds (5 × 10⁶ cells mL−1) after 1, 7, and 14 days of stimulus application. f) The quantification of the % of viable cells from (e). g) The metabolic activity was determined by applying the Presto blue assay to the cell‐laden scaffolds at different time‐points. The data were normalized with respect to the day 1 values. h) Top: Schematic drawing of the biphasic scaffolds illustrating two cell‐laden AHAT layers and two cell‐free HAT layers. The cells from the top AHAT layer were labeled green, while the cells from the second AHAT layer were labeled red (colorized in purple for color‐blind aid); bottom: the images of the shape‐shifted scaffold 24 h post‐ionic crosslinking following bioprinting. The sub‐figure includes a schematic drawing of the colored‐labeled cell‐laden scaffolds and the corresponding confocal microscopy images at two different magnifications.
Figure 9
Figure 9
Self‐curved 4D bioprinted constructs made with AHAT/HAT bioinks for cartilage TE. Histology of 4D bioprinted constructs cultured under chondrogenic conditions. a) Representative histological images of hematoxylin‐eosin (HE staining) at two different magnifications at 14, 21, and 28 days of culture. The squared boxes represent a zoomed‐in region of interest. White arrows indicate the stained hMSCs. b) Curvature of the scaffold at 14, 21, and 28 days of culture. c) Thickness of the scaffolds at 14, 21, and 28 days of culture. Representative histological images of d) Alcian blue staining for sGAG in dark blue and e) Picrosirius red staining for collagen in dark pink at two different magnifications at 14 and 28 days of culture. The squared boxes represent a zoomed‐in region of interest.
Figure 10
Figure 10
Chondrogenesis of human MSCs. Representative histological images of hematoxylin and eosin, alcian blue, and picrosirius‐red staining of MSC pellets cultured for 2 and 21 days in chondrogenic conditions at two different magnifications. The yellow box represents the magnified region of interest for the subfigures below each pellet.

Similar articles

Cited by

References

    1. Chen Y., Zhang J., Liu X., Wang S., Tao J., Huang Y., Wu W., Li Y., Zhou K., Wei X., Chen S., Li X., Xu X., Cardon L., Qian Z., Gou M., Sci. Adv. 2020, 6, eaba7406. - PMC - PubMed
    1. Costantini M., Testa S., Mozetic P., Barbetta A., Fuoco C., Fornetti E., Tamiro F., Bernardini S., Jaroszewicz J., Święszkowski W., Trombetta M., Castagnoli L., Seliktar D., Garstecki P., Cesareni G., Cannata S., Rainer A., Gargioli C., Biomaterials 2017, 131, 98. - PubMed
    1. Lee A., Hudson A. R., Shiwarski D. J., Tashman J. W., Hinton T. J., Yerneni S., Bliley J. M., Campbell P. G., Feinberg A. W., Science 2019, 365, 482. - PubMed
    1. Groll J., Boland T., Blunk T., Burdick J. A., Cho D.‐W., Dalton P. D., Derby B., Forgacs G., Li Q., Mironov V. A., Moroni L., Nakamura M., Shu W., Takeuchi S., Vozzi G., Woodfield T. B. F., Xu T., Yoo J. J., Malda J., Biofabrication 2016, 8, 013001. - PubMed
    1. Jiang T., Munguia‐Lopez J. G., Flores‐Torres S., Kort‐Mascort J., Kinsella J. M., Appl. Phys. Rev. 2019, 6, 011310.

Publication types

LinkOut - more resources