

Progressive Spinal Cord Degeneration in Friedreich's Ataxia: Results from ENIGMA-Ataxia
- PMID: 36308733
- PMCID: PMC9852007
- DOI: 10.1002/mds.29261
Progressive Spinal Cord Degeneration in Friedreich's Ataxia: Results from ENIGMA-Ataxia
Abstract
Background: Spinal cord damage is a hallmark of Friedreich's ataxia (FRDA), but its progression and clinical correlates remain unclear.
Objective: The objective of this study was to perform a characterization of cervical spinal cord structural damage in a large multisite FRDA cohort.
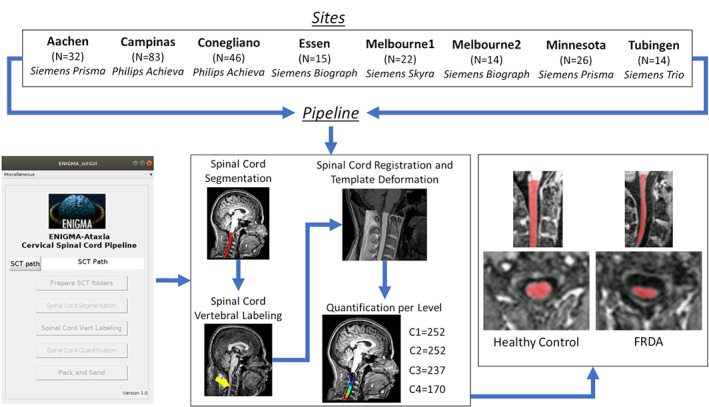
Methods: We performed a cross-sectional analysis of cervical spinal cord (C1-C4) cross-sectional area (CSA) and eccentricity using magnetic resonance imaging data from eight sites within the ENIGMA-Ataxia initiative, including 256 individuals with FRDA and 223 age- and sex-matched control subjects. Correlations and subgroup analyses within the FRDA cohort were undertaken based on disease duration, ataxia severity, and onset age.
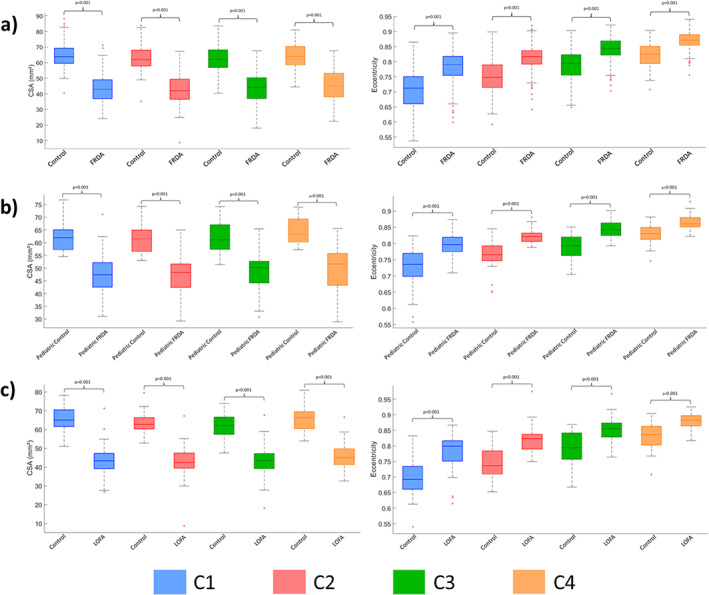
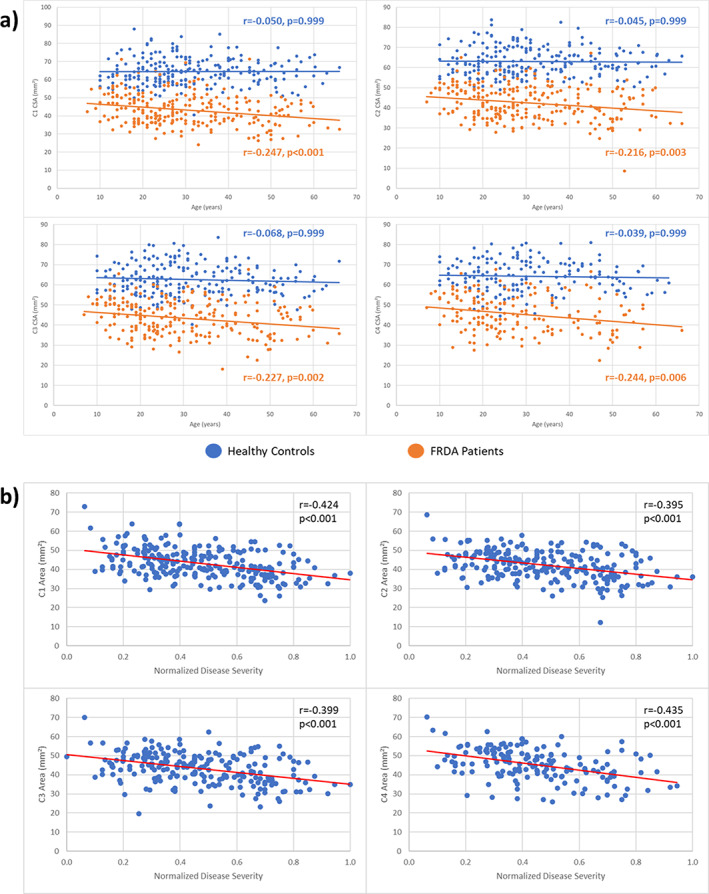
Results: Individuals with FRDA, relative to control subjects, had significantly reduced CSA at all examined levels, with large effect sizes (d > 2.1) and significant correlations with disease severity (r < -0.4). Similarly, we found significantly increased eccentricity (d > 1.2), but without significant clinical correlations. Subgroup analyses showed that CSA and eccentricity are abnormal at all disease stages. However, although CSA appears to decrease progressively, eccentricity remains stable over time.
Conclusions: Previous research has shown that increased eccentricity reflects dorsal column (DC) damage, while decreased CSA reflects either DC or corticospinal tract (CST) damage, or both. Hence our data support the hypothesis that damage to the DC and damage to CST follow distinct courses in FRDA: developmental abnormalities likely define the DC, while CST alterations may be both developmental and degenerative. These results provide new insights about FRDA pathogenesis and indicate that CSA of the cervical spinal cord should be investigated further as a potential biomarker of disease progression. © 2022 The Authors. Movement Disorders published by Wiley Periodicals LLC on behalf of International Parkinson and Movement Disorder Society.
Keywords: ENIGMA-ataxia; Friedreich's ataxia; MRI; SCT; spinal cord.
© 2022 The Authors. Movement Disorders published by Wiley Periodicals LLC on behalf of International Parkinson and Movement Disorder Society.
Figures

References
-
- Campuzano V, Montermini L, Molto MD, et al. Friedreich's ataxia: autosomal recessive disease caused by anintronic GAA triplet repeat expansion. Science 1996;271:1423–1427. - PubMed
-
- Pandolfo M. Friedreich ataxia. Arch Neurol 2008;65:1296–1303. - PubMed
-
- Reetz K, Dogan I, Hilgers RD, et al. Progression characteristics of the European Friedreich's ataxia consortium for translational studies (EFACTS): a 4‐year cohort study. Lancet Neurol 2021;20:362–372. - PubMed
-
- Martinez AR, Moro A, Abrahao A, et al. Nonneurological involvement in late‐onset Friedreich ataxia (LOFA): exploring the phenotypes. Cerebellum 2017;16:253–256. - PubMed
Publication types
MeSH terms
Grants and funding
LinkOut - more resources
Full Text Sources
Medical
Miscellaneous
