. 2022 Nov 9;30(11):1570-1588.e7.
doi: 10.1016/j.chom.2022.10.001. Epub 2022 Oct 28.

The Toxoplasma effector GRA28 promotes parasite dissemination by inducing dendritic cell-like migratory properties in infected macrophages

Affiliations

The Toxoplasma effector GRA28 promotes parasite dissemination by inducing dendritic cell-like migratory properties in infected macrophages

Arne L Ten Hoeve et al. Cell Host Microbe. .

Abstract

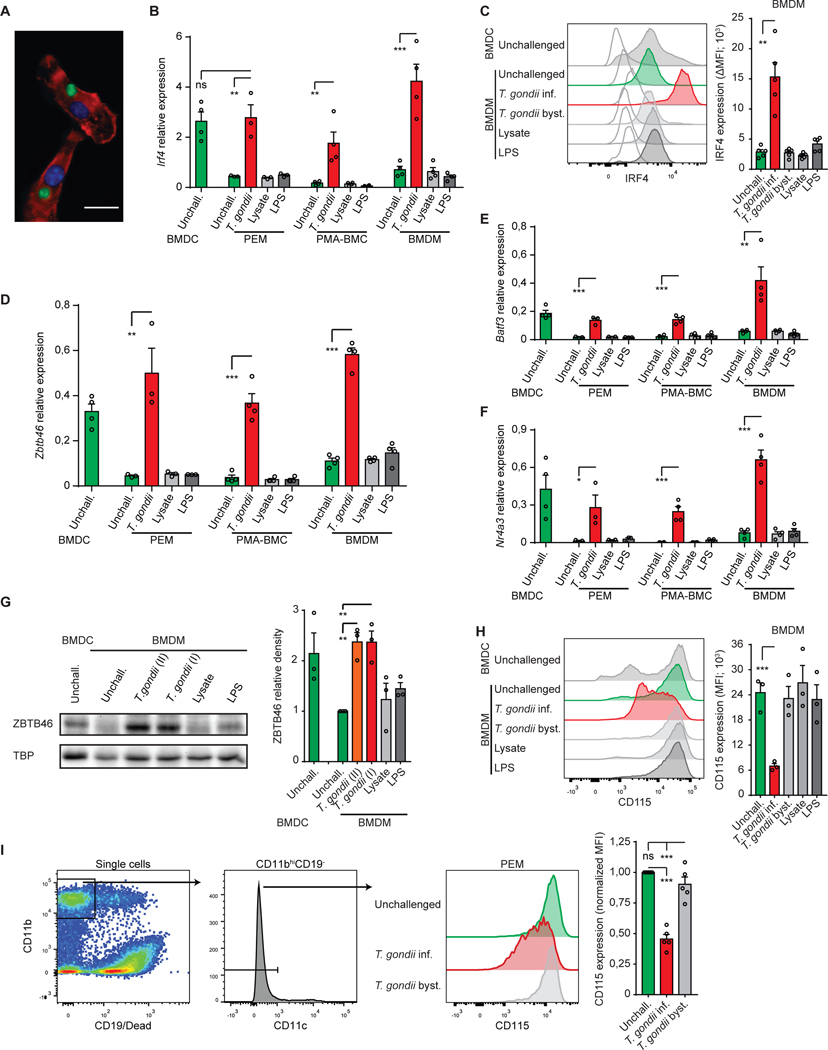
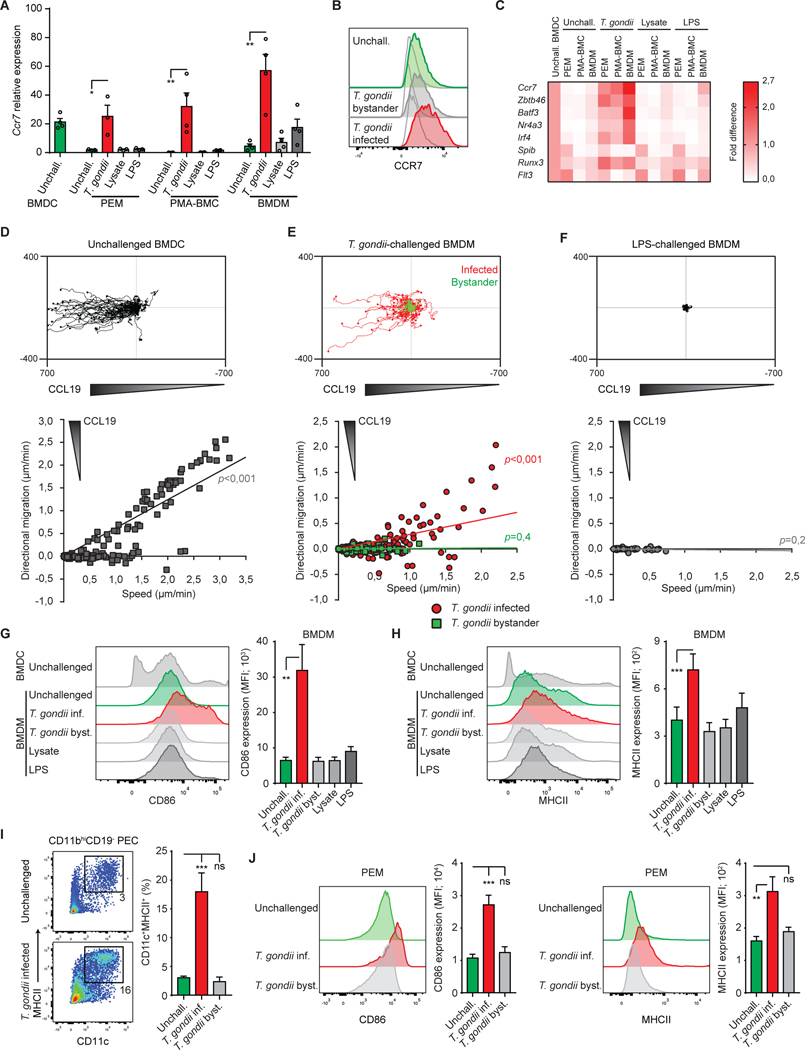
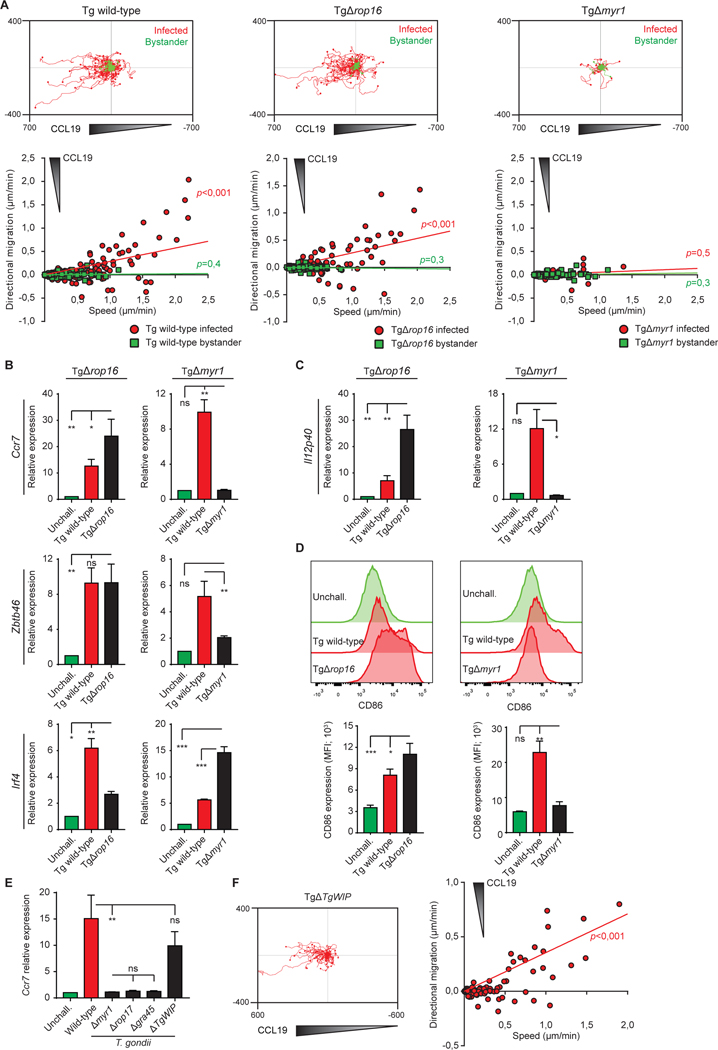
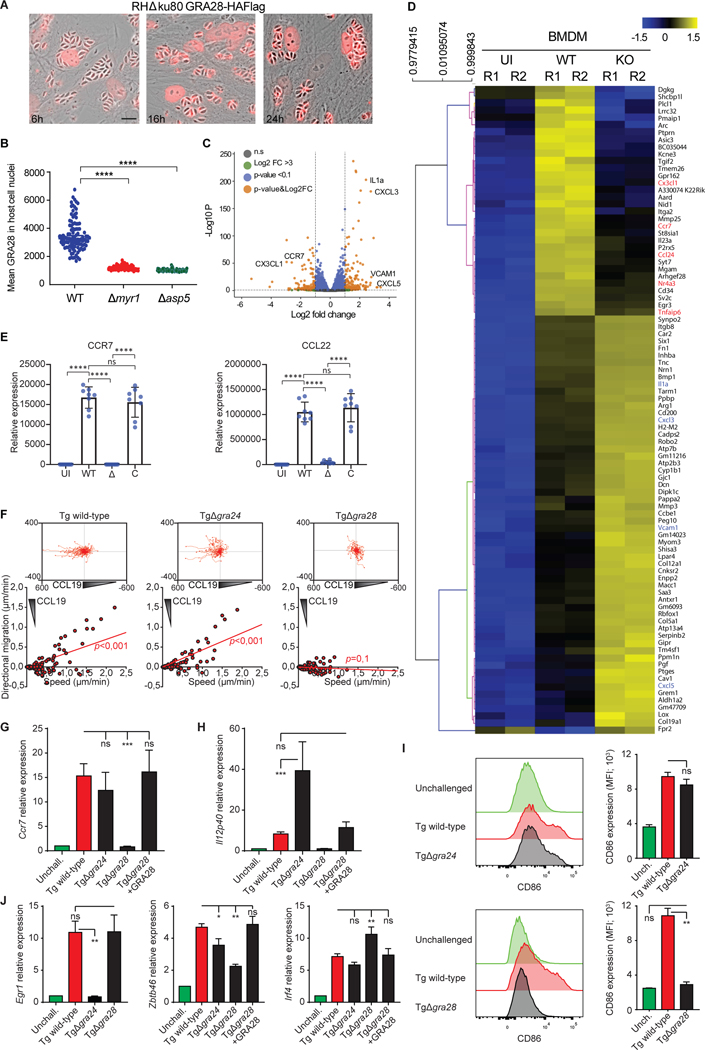
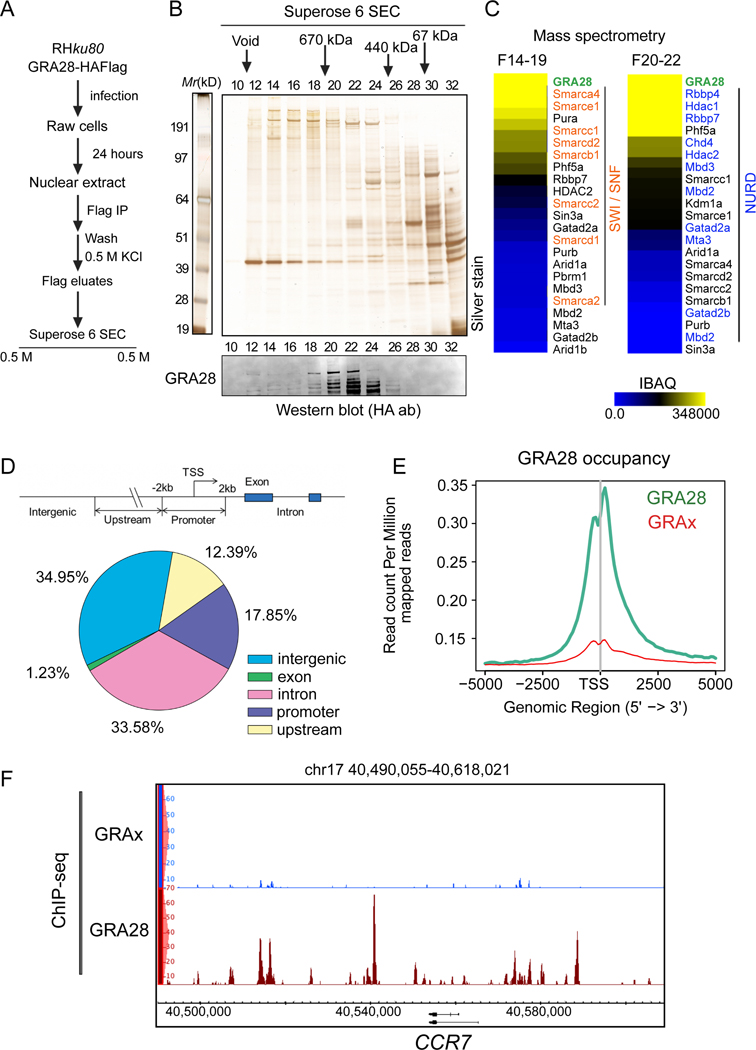
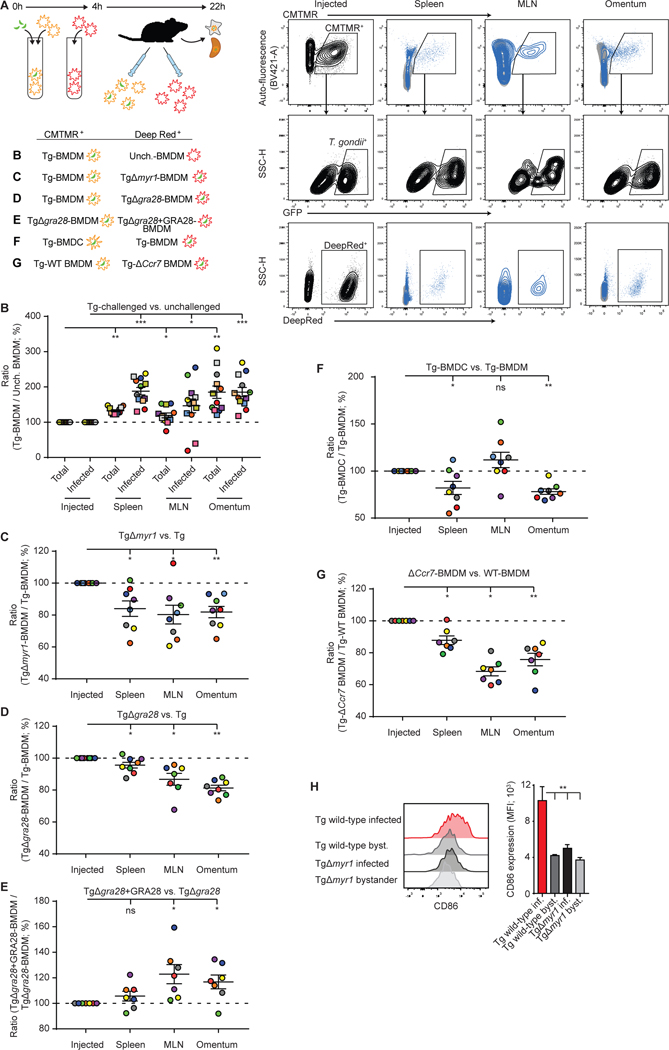
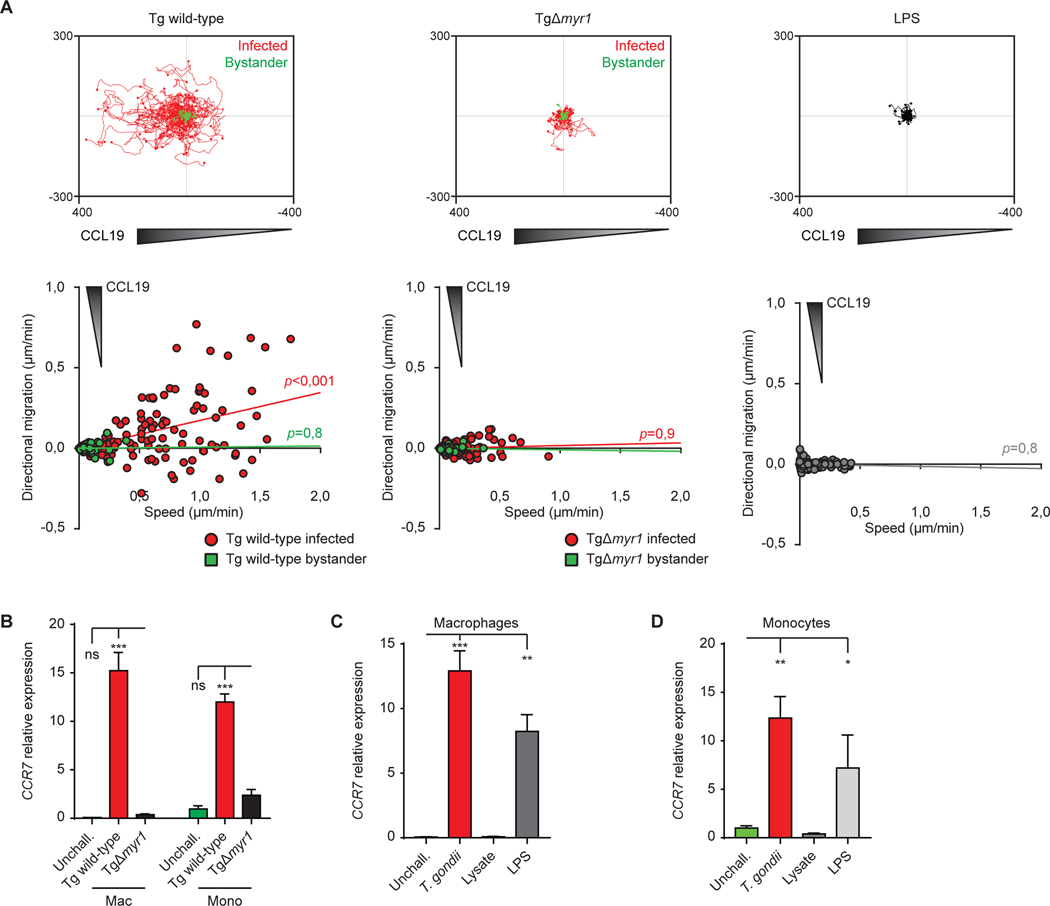
Upon pathogen detection, macrophages normally stay sessile in tissues while dendritic cells (DCs) migrate to secondary lymphoid tissues. The obligate intracellular protozoan Toxoplasma gondii exploits the trafficking of mononuclear phagocytes for dissemination via unclear mechanisms. We report that, upon T. gondii infection, macrophages initiate the expression of transcription factors normally attributed to DCs, upregulate CCR7 expression with a chemotactic response, and perform systemic migration when adoptively transferred into mice. We show that parasite effector GRA28, released by the MYR1 secretory pathway, cooperates with host chromatin remodelers in the host cell nucleus to drive the chemotactic migration of parasitized macrophages. During in vivo challenge studies, bone marrow-derived macrophages infected with wild-type T. gondii outcompeted those challenged with MYR1- or GRA28-deficient strains in migrating and reaching secondary organs. This work reveals how an intracellular parasite hijacks chemotaxis in phagocytes and highlights a remarkable migratory plasticity in differentiated cells of the mononuclear phagocyte system.

Keywords: apicomplexa; cell motility; chemokine receptor 7; chemotaxis; host-pathogen; immune evasion; intracellular parasitism; mononuclear phagocyte; protozoa.


Conflict of interest statement

Declaration of interests The authors declare no competing interests.

Figures

Figure 1.
Figure 1.. Expression of DC associated transcription factors in T. gondii-challenged macrophages
(A) Representative micrograph shows primary bone marrow-derived macrophages (BMDMs) stained for F-actin (red) and nuclei (blue), with replicating intracellular GFP-expressing T. gondii tachyzoites (green) 18 h post-challenge. Scale bar = 20 μm. (B) qPCR analyses of Irf4 cDNA from PEMs, PMA-BMCs and BMDMs challenged for 18 h with T. gondii type I tachyzoites (RH, MOI 2), tachyzoite lysate (MOI 2 equivalent) or LPS (10 ng/mL). For reference, macrophages and BMDCs were incubated in complete medium, unchallenged (unchall.). (C) Flow cytometric analysis of IRF4 expression by BMDCs and BMDMs challenged as in (B) with MOI 1. T. gondii-infected and bystander cells are distinguished by GFP+/−. Bar graph depicts the differences between anti-IRF4 and isotype mean fluorescence intensity (MFI, mean+SE) from 5 independent experiments (n = 5). (D, E, F) qPCR analyses of Zbtb46 (D), Batf3 (E) and Nr4a3 (F) cDNA, respectively, in cells challenged as in (B). (G) Western blot analysis of ZBTB46 expression in BMDCs and BMDMs challenged for 18 h with T. gondii type I or type II tachyzoites, tachyzoite lysate or LPS. Bar graph depicts density (mean+SE) related to unchallenged BMDMs (=1, n = 3). (H) Flow cytometry analysis of CD115 expression in BMDCs and BMDMs challenged as in (C). Bar graph depicts MFI (mean+SE) from 3 independent experiments. (I) Flow cytometric analysis of CD115 expression on PEMs challenged as in (C) with T. gondii (MOI 0,5) or left unchallenged, gated from live peritoneal cells as indicated. Bar graph depicts MFI (mean+SE) related to unchallenged PEM (= 1, n = 5). Relative expression (2−ΔCq) is displayed as mean+SE and individual measurements (n = 3–4). Statistical comparisons were made with ANOVA and Dunnett’s (B, E, F, G and H) or Holm-Bonferroni (C, D and I) post-hoc tests (* p ≤ 0,05, ** p ≤ 0,01, *** p ≤ 0,001, ns p > 0,05). See also Figure S1.
Figure 2.
Figure 2.. Expression of Ccr7 and chemotaxis towards CCL19 by T. gondii-challenged macrophages
(A) qPCR analyses of Ccr7 cDNA from BMDCs, PEMs, PMA-BMCs and BMDMs challenged for 18 h with T. gondii type I tachyzoites (RH), tachyzoite lysate, LPS or left unchallenged (unchall.). Relative expression (2−ΔCq) is displayed as mean+SE and individual measurements (n = 3–4). (B) Flow cytometric analysis of anti-CCR7 and isotype control stainings on BMDMs challenged for 18h with T. gondii type I tachyzoites or left unchallenged (unchall.). Representative of 2 independent experiments. (C) Heat map depicting relative mRNA expression changes of indicated genes for different types of macrophages and challenges. Color scale indicates mean fold difference in expression related to unchallenged BMDCs (=1) from 3–4 independent experiments. (D, E, F) Motility plots depict the displacement of unchallenged BMDCs and BMDMs challenged with T. gondii type I (RH) or LPS for 12 h in a collagen matrix with a CCL19 gradient as detailed in Methods details (scale in μm). For each condition, directional migration (μm/min) towards the CCL19 source and speed (μm/min) of individual cells are displayed in graphs, with linear regression lines. For T. gondii challenged BMDMs (E), infected cells (GFP+, red) and non-infected bystander cells (GFP-, green) were analyzed. P- values indicate the directional migration compared to hypothetical zero directionality (one-sample permutation test). Data from 2 (BMDCs) or ≥3 independent experiments. (G, H) Flow cytometric analysis of CD86 (G) and MHCII (H) expression in BMDCs and BMDMs challenged as in (A), with T. gondii-infected and bystander BMDMs distinguished by GFP+/−. Bar graph depicts the MFI (mean+SE, n = 4). (I) Flow cytometric analysis of CD11c and MHCII expression on CD11bhiCD19- peritoneal cells (PEC), challenged as in (C) with T. gondii or left unchallenged. Bar graph depicts the percentage of CD11c+MHCII+ cells (mean+SE, n = 5). (J) Flow cytometric analysis of CD86 and MHCII on PEMs (CD11bhiCD11c-CD19-), challenged as in (I). Bar graphs depict MFI (mean+SE, n= 5). * p ≤ 0,05, ** p ≤ 0,01, *** p ≤ 0,001, ns p > 0,05 (ANOVA and Holm-Bonferroni post-hoc test (A, G-J)). See also Figure S2.
Figure 3.
Figure 3.. Impact of parasite-derived secreted effectors on macrophage chemotaxis
(A) Motility plots depict displacement of BMDMs challenged with T. gondii type I (RH, Tg) wild-type, MYR1-deficient (Δmyr1) or ROP16-deficient (Δrop16) tachyzoites for 12h in a collagen matrix with a CCL19 gradient (scale in μm). Directional migration (μm/min) towards the CCL19 source and speed (μm/min) of individual cells are displayed in graphs, with linear regression lines. Infected cells (red) and non-infected bystander cells (green) were analyzed. P-values indicate the directional migration compared to hypothetical zero directionality (one-sample permutation test). (B, C) qPCR analysis of Ccr7, Zbtb46 and Irf4 (b) and Il12p40 (c) cDNA in BMDMs challenged for 18h with freshly egressed T. gondii wild-type, Δmyr1 or Δrop16 tachyzoites or left unchallenged. Relative expression (2-ΔΔCq) is displayed as mean+SE related to unchallenged (= 1). (D) Flow cytometric analyses of CD86 expression on BMDMs challenged as in (B). For wild-type/Δmyr1 experiments, cells were gated for GFP+. (E) qPCR analysis of Ccr7 cDNA expression in BMDMs challenged with type I (Tg) wild-type, Δmyr1, Δrop17, Δgra45 and ΔTgWIP tachyzoites and displayed as in (B). (F) Motility plot shows displacement of BMDMs challenged with ΔTgWIP tachyzoites in a CCL19 gradient and analysis as in (A). All datasets are from of 3–5 independent experiments and displayed as mean+SE. * p ≤ 0,05, ** p ≤ 0,01, *** p ≤ 0,001, ns p > 0,05 (ANOVA and Dunnett’s (B, C, D) or Holm-Bonferroni (E) post-hoc tests). See also Figure S3.
Figure 4.
Figure 4.. GRA28 is secreted in host cell nuclei in a Myr1 and Asp5-dependent manner to activate and repress gene expression in macrophages, with an impact on Ccr7 expression and chemotaxis.
(A) Time course of GRA28 secretion and export to the host cell nucleus. HFFs were challenged with RHΔku80 GRA28–HA–FLAG tachyzoites, stained with anti-HA antibodies (red) and visualized by epifluorescence and transmitted light microscopy at indicated timepoints (6, 12, 24 h). Scale bar, 10 μm. (B) RHΔku80 WT, Δasp5 and Δmyr1 parasites were transiently transfected with pTUB8-GRA28-HAFlag. The amount of GRA28 in the nucleus was quantified in at least 100 host cells for each parasite strain. (C) Genome-wide expression profiling of BALB/c BMDMs left uninfected or infected with WT and Δgra28 type II (Pru) tachyzoites. The results of tests for differential expression between WT and Δgra28 tachyzoites are presented in a volcano plot that plots the statistical significance against the fold change for each gene. The orange dots indicate transcripts that were significantly up and down regulated, using adjusted p < 0.1 (Bonferroni-corrected) and ± 3-fold change as the cut-off corresponding to each comparison. X-axis showing log2 fold change, Y-axis showing -log10(p-value). Vertical dashed lines indicate threefold up- and down-regulation. (D) Heat map representation of the differentially expressed mouse genes (>3 fold, RPKM >5 in at least one sample) between parental and Δgra28-infected cells. RPKM values were log2 transformed, Gene/Row normalized, and mean centered using MeV. (E) RAW macrophages were infected for 24 h with WT, Δgra28 (Δ) or TgΔgra28+GRA28 (C), the complemented line of type I (RH) tachyzoites, or left unchallenged (UI). GOI and TBP mRNA levels were determined by RT-qPCR and GOI values were normalized to TBP. ** p ≤ 0,01, *** p ≤ 0,001, **** p ≤ 0,0001, ns p > 0,05 (One-way ANOVA and Tukey’s multiple comparison test). Data are the mean ± s.d. (n ≥ 3). (F) Motility plots and analyses of BMDMs challenged with type I (RH) wild-type, Δgra24 or Δgra28 T. gondii tachyzoites (Tg) for 12h, and allowed to migrate in a CCL19 gradient. P-values indicate the directional migration compared to hypothetical zero directionality (one-sample permutation test). (G, H) qPCR analysis of Ccr7 (G) and IL12p40 (H) cDNA expression in BMDMs challenged with type I wild- type, Δgra24, Δgra28 or Δgra28+GRA28 tachyzoites (Tg) for 18h (RH) or left unchallenged. Relative expression (2-ΔΔCq) is displayed as mean+SE related to unchallenged (=1; n ≥ 4). (I) Flow cytometric analyses of anti-CD86 staining on BMDMs challenged as in (B). (J) qPCR analysis of Egr1, Zbtb46 and Irf4 in BMDMs challenged with type I wild-type (Tg), Δgra24 or Δgra28 or Δgra28+GRA28 tachyzoites or left unchallenged as in (G). Relative expression (2−ΔΔCq) related to unchallenged (=1; n ≥ 3). Datasets are from at least 3 independent experiments and displayed as mean+SE. * p ≤ 0,05, ** p ≤ 0,01, *** p ≤ 0,001, ns p > 0,05 (ANOVA and Dunnett’s (G, H, J) or Holm-Bonferroni (I) post-hoc test. See also Figure S4.
Figure 5.
Figure 5.. GRA28 binds to chromatin and partners with chromatin remodelers NuRD and SWI/SNF.
(A, B) GRA28-associated proteins were purified by FLAG chromatography from protein extracts of the murine RAW macrophage line infected with RHΔku80 GRA28–HA–FLAG. Fractions from size-exclusion chromatography of GRA28-containing complexes after Flag-affinity selection were analyzed on gels by silver staining and then by mass spectrometry-base proteomics to detect GRA28 and the aforementioned partners. (C) Heatmap showing the abundance ranks of each protein in each purified fraction derived from extracted iBAQ values. The identity of the proteins is indicated. (D) The pie chart shows the distribution of GRA28 peaks in the genome of human fibroblasts relative to gene features. (E) The average distribution of GRA28 and the control GRAx in gene promoters. Average-signal profiles of each protein were plotted over a region from − 5 kb to +5 kb relative to the TSS of each gene. Average tag count of the enrichment is shown on the y-axis. (F) IGB images of the gene CCR7 and ChIP-seq signal peaks for GRA28 and GRAx. See also Figure S5.
Figure 6.
Figure 6.. In vivo migration of T. gondii-challenged adoptively transferred BMDMs
(A) Illustration of experimental setup and conditions for co-adoptive transfers of T. gondii (RH)-challenged or unchallenged (unch.) BMDMs or BMDCs pre-labeled with CellTracker Deep Red or CMTMR dyes. B, C, D, E, F, G indicate, respectively, conditions and experimental setups for corresponding graphs below. Plots show flow cytometric detection of pre-labelled (CMTMR+/Deep red+) and parasitized cells (GFP+) extracted from organs 18h post-inoculation, as detailed under Methods. Events from organs are displayed in blue or black (inoculated) and in grey (non-inoculated). (B) Flow cytometric analysis of T. gondii-challenged (Tg) and unchallenged (unch.) BMDMs in the spleen, MLNs and omentum 18h post-inoculation. Data is presented as the change in ratio between detected challenged CMTMR+ cells and unchallenged Deep red+ cells (total) or specified by infection (GFP+/GFP-) related to the inoculated ratio (normalized to 100%). Mean ratio change ±SE and individual mice (n = 12) are displayed. (C) Flow cytometric analysis of BMDMs treated as indicated in (A) in the spleen, MLNs and omentum. The change in ratio between Deep red+GFP+ cells (TgΔmyr1-infected) and CMTMR+GFP+ cells (Tg-infected) related to inoculated (=100%) is shown. (D) Flow cytometric analysis of BMDMs treated as indicated in (A). The change in ratio between Deep red+CFSE+ TgΔgra28-infected cells and CMTMR+CFSE+ Tg-infected cells related to inoculated (=100%) is shown. (E) Flow cytometric analysis of BMDMs treated as indicated in (A). The change in ratio between Deep red+CFSE+ TgΔgra28+GRA28-infected cells and CMTMR+CFSE+ TgΔgra28-infected cells related to inoculated (=100%) is shown. (F) Flow cytometric analysis of T. gondii-challenged (Tg) BMDM and BMDC in the spleen, MLNs and omentum 18h post-inoculation. Data is presented as the change in ratio between infected CMTMR+GFP+ BMDCs and Deep red+GFP+ BMDMs related to inoculated (=100%) is shown. (G) Flow cytometric analysis of T. gondii-challenged (Tg) wild-type (WT) or CCR7-deficient (ΔCcr7) BMDM in the spleen, MLNs and omentum 18h post-inoculation. Data is presented as the change in ratio between infected CMTMR+GFP+ BMDCs and Deep red+GFP+ BMDMs related to inoculated (=100%) is shown. (H) Flow cytometric analysis of anti-CD86 staining in BMDMs challenged as in (D) recovered from the spleen. Bar graph depicts MFI (mean+SE) from 3 mice. Scatter plots display individual mice with symbols (n = 7–12) and mean±SE (B-G). * p ≤ 0,05, ** p ≤ 0,01, *** p ≤ 0,001, ns p > 0,05 (one-sample permutation (B-G) or ANOVA and Dunnett’s (H) post-hoc tests (H). See also Figure S6.
Figure 7.
Figure 7.. Expression of DC-associated transcription factors and chemotaxis in T. gondii-challenged human monocytic cells
(A) Motility plots and analyses (n = 3) of human monocyte-derived macrophages challenged with T. gondii type I (RH, Tg) wild-type, TgΔmyr1 or LPS for 12h in a CCL19 gradient as indicated under Methods details. (B) qPCR analysis of CCR7 cDNA from human macrophages and monocytes challenged for 18 h as in (A). Relative expression (2-ΔCq) is shown (mean+SE, n = 4). (C, D) qPCR analysis of CCR7 cDNA from human macrophages (C) and human monocytes (D) challenged for 18 h with T. gondii type I tachyzoites (Tg), tachyzoite lysate, LPS. For reference cells were or left unchallenged (unchall.). Relative expression (2-ΔCq) is shown (mean+SE, n = 4–5). * p ≤ 0,05, ** p ≤ 0,01, *** p ≤ 0,001, ns p > 0,05 (B-D; ANOVA, Dunnett’s post-hoc test). See also Figure S7.

Comment in

Similar articles

Cited by

References

    1. Alvarez D, Vollmann EH, and von Andrian UH (2008). Mechanisms and consequences of dendritic cell migration. Immunity 29, 325–342. 10.1016/j.immuni.2008.08.006 - DOI - PMC - PubMed
    1. Amon L, Lehmann CHK, Baranska A, Schoen J, Heger L, and Dudziak D.(2019). Transcriptional control of dendritic cell development and functions. International review of cell and molecular biology 349, 55–151. 10.1016/bs.ircmb.2019.10.001 - DOI - PubMed
    1. Attanasio C, Nord AS, Zhu Y, Blow MJ, Biddie SC, Mendenhall EM, Dixon J, Wright C, Hosseini R, Akiyama JA, et al. (2014). Tissue-specific SMARCA4 binding at active and repressed regulatory elements during embryogenesis. Genome Res 24, 920–929. 10.1101/gr.168930.113 - DOI - PMC - PubMed
    1. Aziz A, Soucie E, Sarrazin S, and Sieweke MH (2009). MafB/c-Maf deficiency enables self-renewal of differentiated functional macrophages. Science (New York, NY) 326, 867–871. 10.1126/science.1176056 - DOI - PubMed
    1. Bajana S, Roach K, Turner S, Paul J, and Kovats S.(2012). IRF4 promotes cutaneous dendritic cell migration to lymph nodes during homeostasis and inflammation. Journal of immunology (Baltimore, Md : 1950) 189, 3368–3377. 10.4049/jimmunol.1102613 - DOI - PMC - PubMed