. 2022 Nov 17;82(22):4232-4245.e11.
doi: 10.1016/j.molcel.2022.10.004. Epub 2022 Oct 28.

Integrator endonuclease drives promoter-proximal termination at all RNA polymerase II-transcribed loci

Affiliations

Integrator endonuclease drives promoter-proximal termination at all RNA polymerase II-transcribed loci

Chad B Stein et al. Mol Cell. .

Abstract

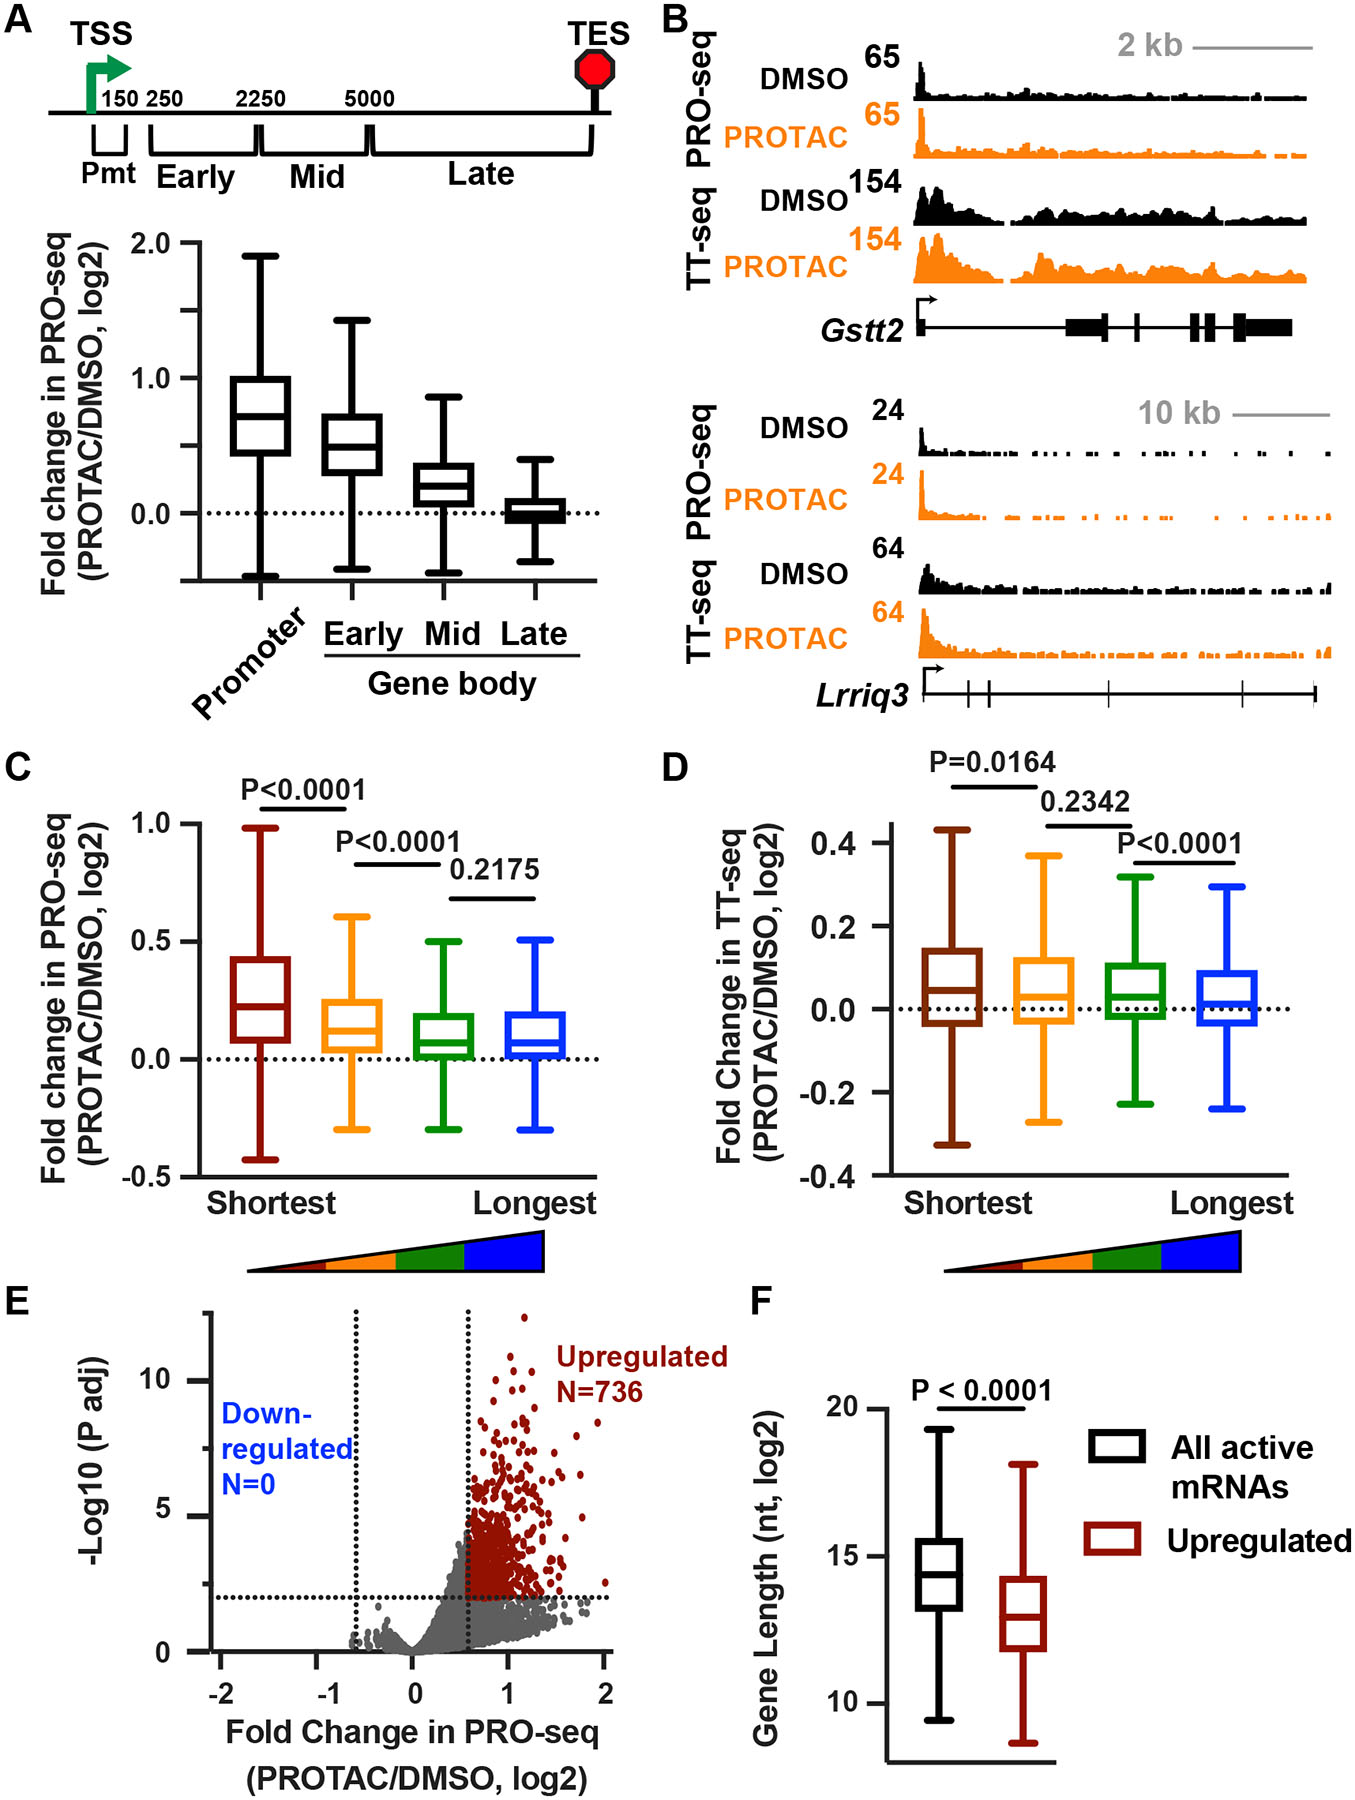
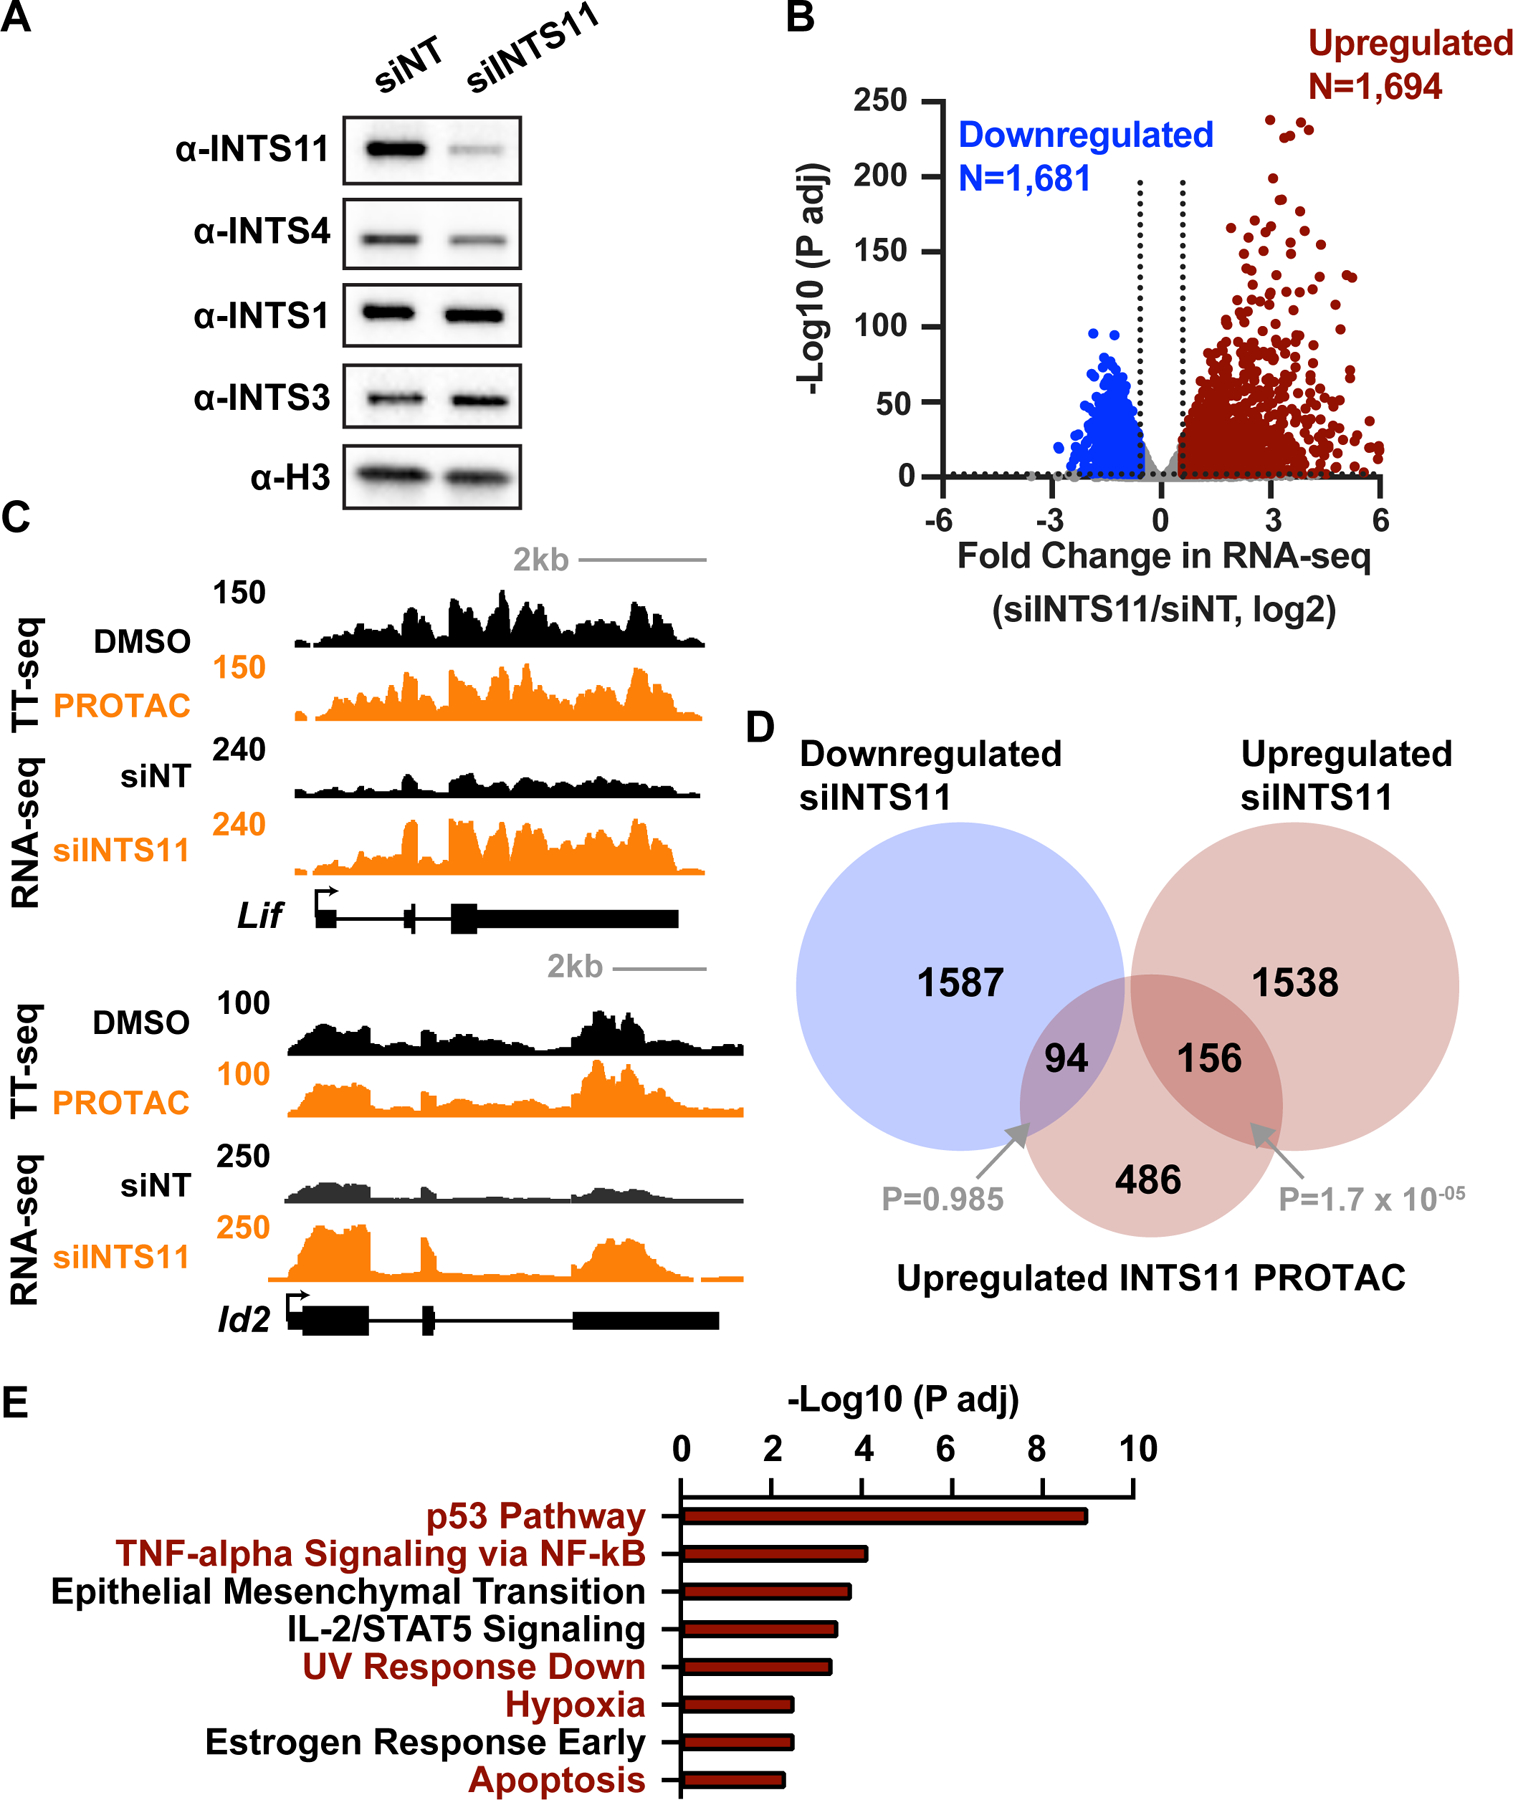
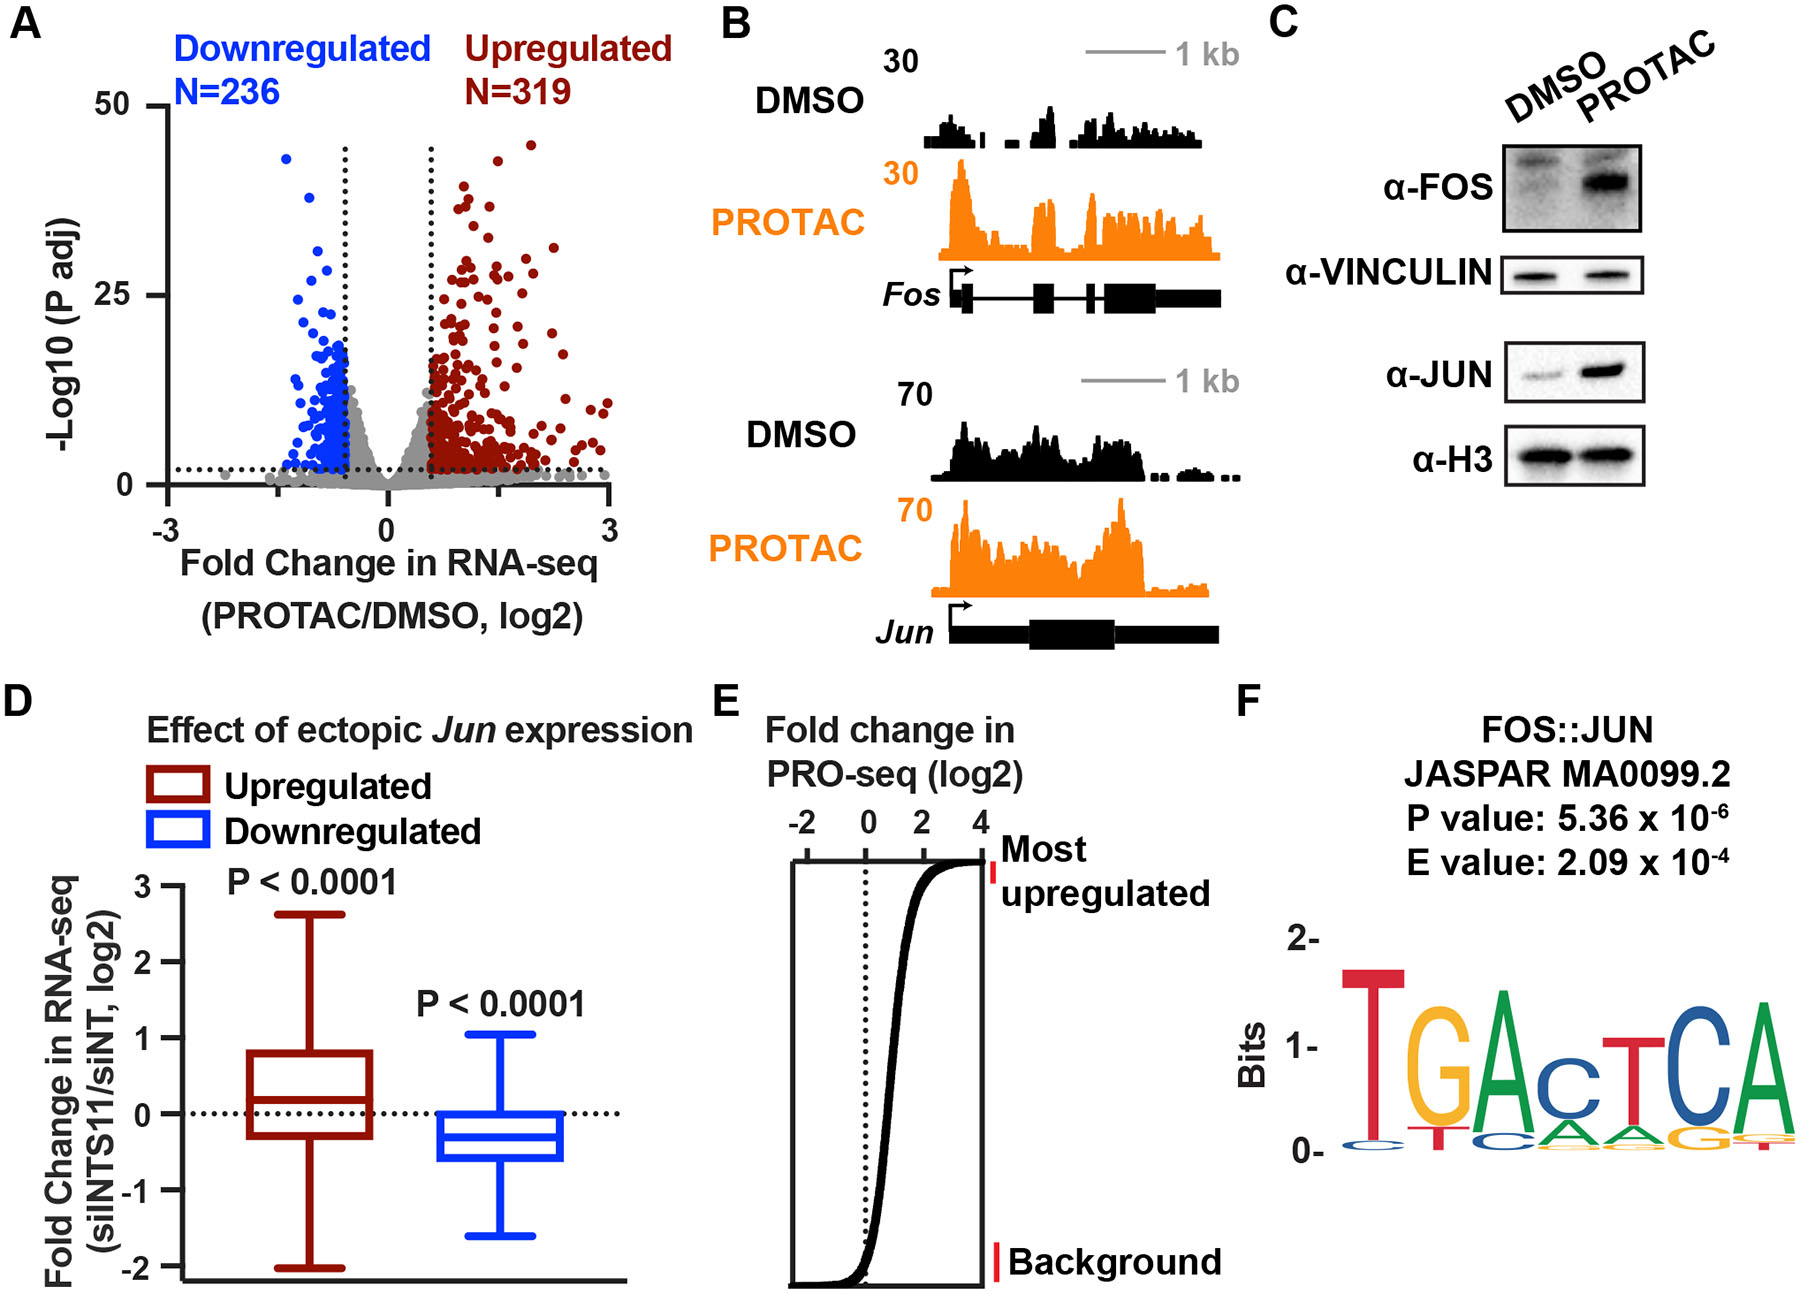
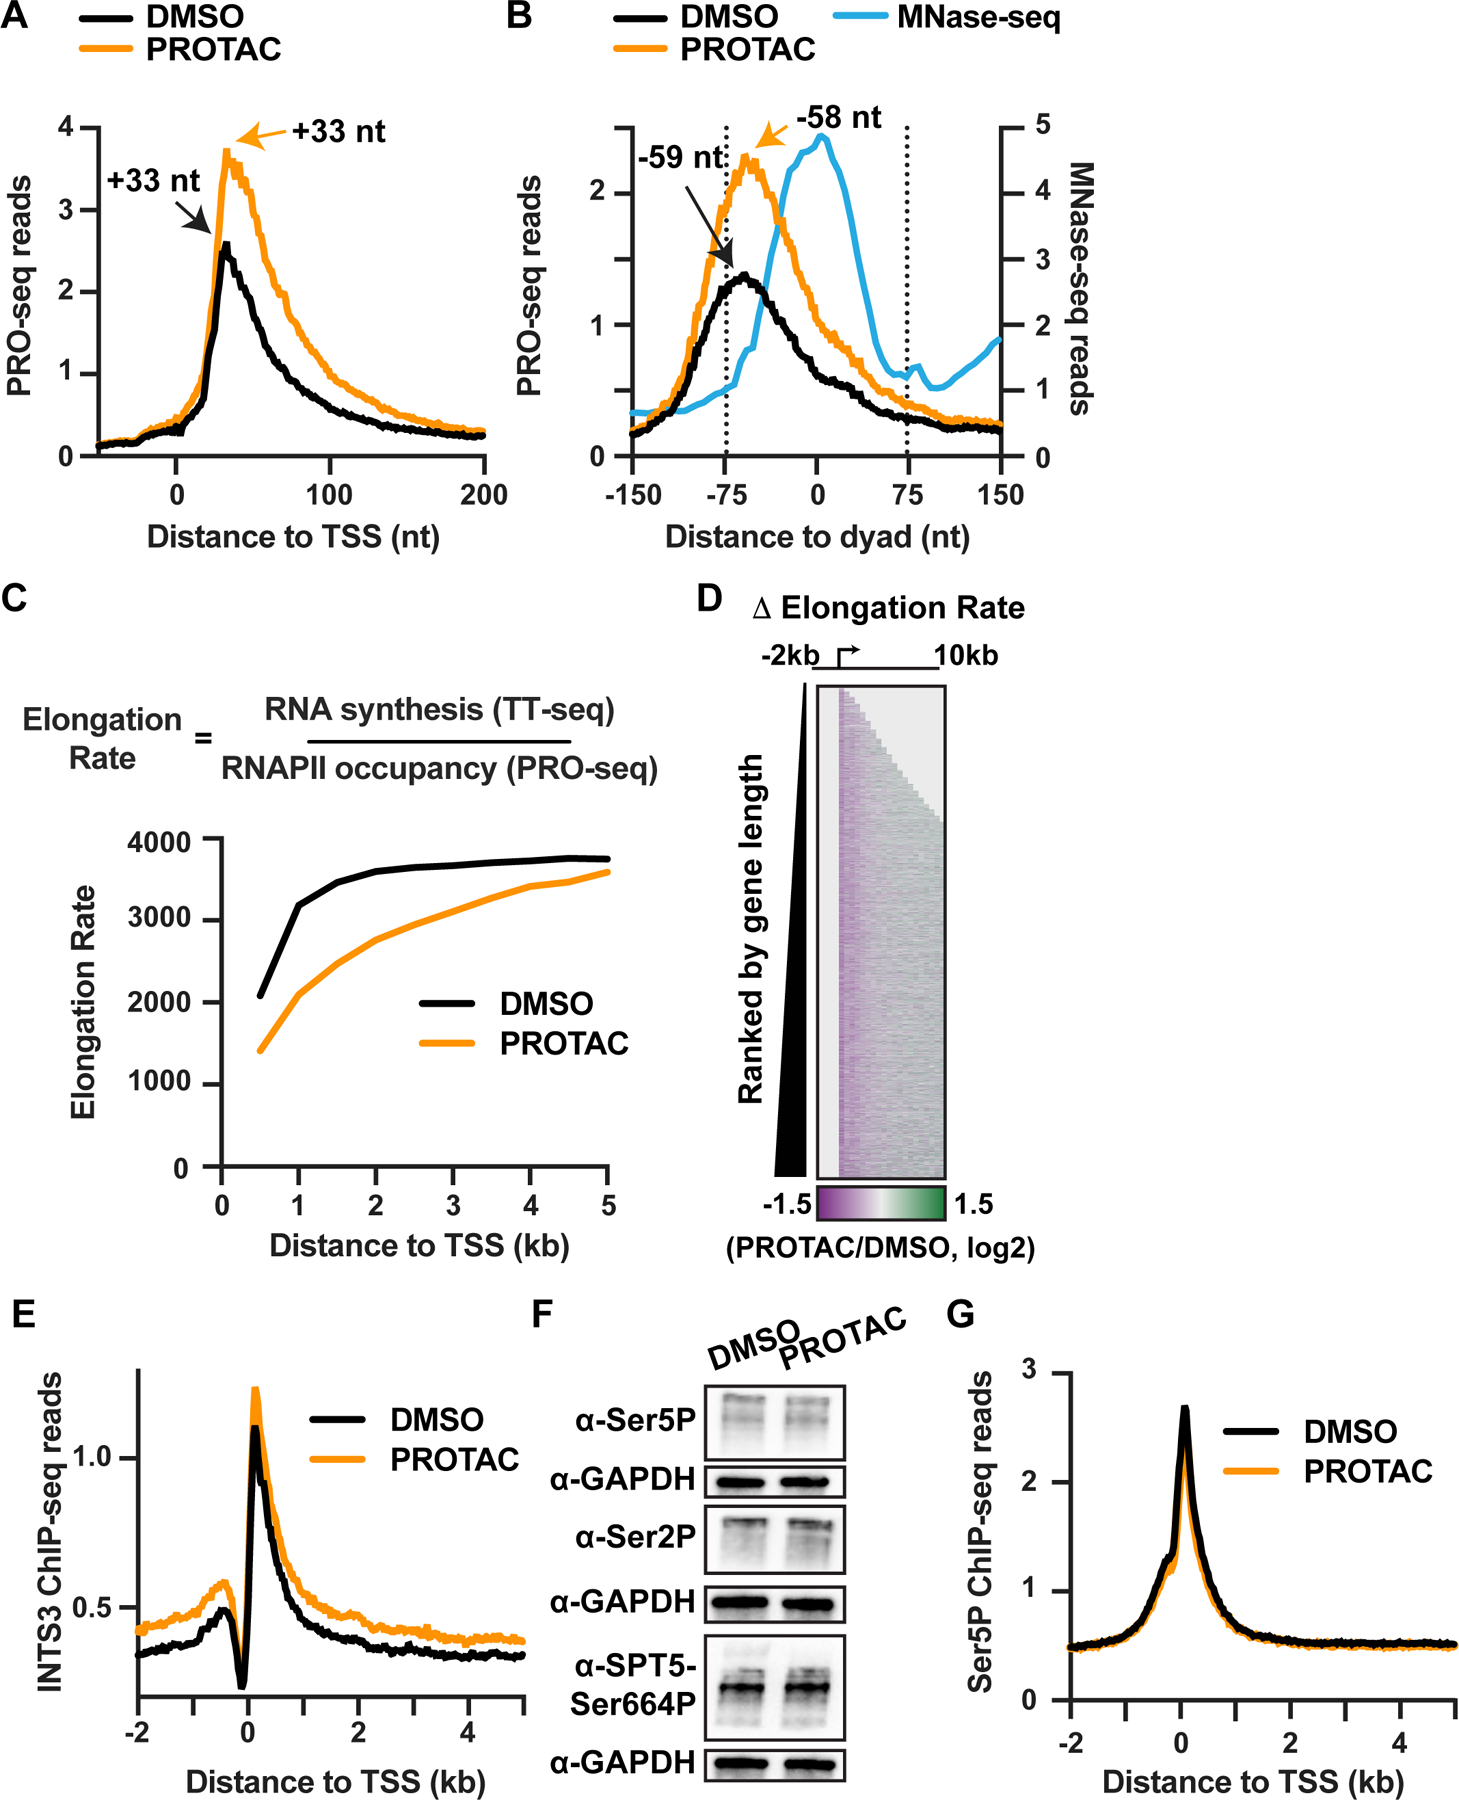
RNA polymerase II (RNAPII) pausing in early elongation is critical for gene regulation. Paused RNAPII can be released into productive elongation by the kinase P-TEFb or targeted for premature termination by the Integrator complex. Integrator comprises endonuclease and phosphatase activities, driving termination by cleavage of nascent RNA and removal of stimulatory phosphorylation. We generated a degron system for rapid Integrator endonuclease (INTS11) depletion to probe the direct consequences of Integrator-mediated RNA cleavage. Degradation of INTS11 elicits nearly universal increases in active early elongation complexes. However, these RNAPII complexes fail to achieve optimal elongation rates and exhibit persistent Integrator phosphatase activity. Thus, only short transcripts are significantly upregulated following INTS11 loss, including transcription factors, signaling regulators, and non-coding RNAs. We propose a uniform molecular function for INTS11 across all RNAPII-transcribed loci, with differential effects on particular genes, pathways, or RNA biotypes reflective of transcript lengths rather than specificity of Integrator activity.

Keywords: Integrator; gene regulation; non-coding RNAs; premature termination; transcription.


Conflict of interest statement

Declaration of interests K.A. received research funding from Novartis not related to this work, is on the SAB of CAMP4 Therapeutics, and is a member of the Advisory Board of Molecular Cell.

Figures

Figure 1.
Figure 1.. Generation and validation of a rapid INTS11 depletion system in mouse embryonic stem cells.
(A) Schematic depicting insertion of a HaloTag at the N terminus of endogenous INTS11 (top) and the PROTAC system (bottom). (B) Western blots of INTS11 (67.8 kDa) and HaloTagged-INTS11 (104.3 kDa). Histone H3 is a loading control. (C) Western blots of Integrator subunits from lysates of INTS11Halo cells treated with 500 nM PROTAC for the indicated time. Histone H3 is a loading control. (D) RT-qPCR of total RNA isolated from cells treated as indicated for 4 h (n=3 per condition). Primer pairs amplify regions downstream of the snRNA TES. Bar graphs depict averages and standard deviations. P values from paired, two-sided t test. DMSO was set to 1. (E) Metagene analysis of TT-seq coverage around active snRNA genes (N=37). Samples were treated for 4 h (n=2 per condition). Data outside gene bodies are shown as average reads per gene in 50 nt bins; bins within gene bodies are scaled to gene length, with 10 bins/gene. (F) Boxplots depict TT-seq read density in the indicated regions for snRNAs shown in E. Boxes show 25th–75th percentiles and whiskers depict 1.5 times the interquartile range. P values from Wilcoxon matched-pairs signed rank test. Gene Body = TSS to TES; Readthrough = TES to +1kb downstream.
Figure 2.
Figure 2.. Acute loss of INTS11 increases nascent RNA production near TSSs.
(A) Metagene analysis of PRO-seq signal for active annotated genes over 400 nt in length (N=16,036, does not include snRNAs) after 4 h of indicated treatment. Data outside gene bodies are shown as average reads per gene in 50 nt bins; bins within gene bodies are scaled to gene length, with 90 bins/gene. (B) Heatmap representation of difference in PRO-seq signal after PROTAC treatment (Δ = PROTAC - DMSO) for genes shown in A. Genes are ranked by the fold change in PRO-seq signal from TSS (arrow) to TES (red octagon). Signal across gene bodies is shown in 90 bins, while 1 kb upstream and downstream regions are shown in 200 nt bins. (C) Metagene analysis of INTS11 ChIP-seq signal for active annotated genes. Data outside gene bodies are shown as average reads per gene in 50 bp bins; bins within gene bodies are scaled to gene length, with 100 bins/gene. (D) Readthrough Index (RI) was calculated from TT-seq data as indicated. Heatmaps depict normalized TT-seq signals in DMSO and PROTAC treated cells (left and middle) or relative difference (right) in 100 nt bins for mRNA genes with no significant differences in TT-seq signal in the 2kb window upstream of the TES (N=7,560). Genes with increased RI in INTS11-depleted cells are at the top.
Figure 3.
Figure 3.. INTS11 loss increases promoter-proximal transcription at all RNAPII-transcribed loci.
(A) Metagene analysis of PRO-seq signal at active mRNA genes (N=13,057) upon 4 h of indicated treatment. Data are shown as average reads in 25 nt bins. (B) Heatmap representation of difference in PRO-seq signal (Δ=PROTAC - DMSO) for mRNA genes (N=13,057). TSS is indicated by arrow. Data are shown in 100 nt bins. (C) Boxplots depict PRO-seq read density in the indicated gene region for mRNAs (N=13,057). P values from Wilcoxon matched-pairs signed rank test. (D-F) Same as A-C, but for 1,855 active, annotated lncRNA genes. (G-I) Same as A-C, but for 8,284 uaRNA loci. (J-L) Same as A-C, but for 9,571 intergenic sites of unannotated transcription identified as putative enhancers.
Figure 4.
Figure 4.. Loss of INTS11 stimulates transcription of short RNAs.
(A) Schematic at top depicts locations of windows across mRNA genes >10 kb (N=9,468) with respect to the TSS. Boxplots show the fold change in PRO-seq reads in each window. (B) Browser shots of example genes that are short (top) or long (bottom). (C) Shown is the change in gene body (+250 nt to TES) PRO-seq signal after PROTAC treatment for mRNAs (N=13,057) divided into length quartiles. P values from Mann-Whitney test. (D) The change in gene body TT-seq signal (exonic reads from +250 nt to TES) after PROTAC treatment for mRNAs divided into length quartiles as in C. P values from Mann-Whitney test. (E) Volcano plot shows fold changes and adjusted P values for active mRNA genes (N=13,057), counting PRO-seq reads from TSS to TES. Affected genes are those with fold change > 1.5 and P adj < 0.01. (F) Boxplots depict the gene lengths of all (N=13,057) or significantly upregulated (N=736) mRNAs. P value from Mann-Whitney test. In A, C, and D, boxes show 25th–75th percentiles and whiskers depict 1.5 times the interquartile range.
Figure 5.
Figure 5.. Similar pathways affected by acute INTS11 loss and long-term INTS11 depletion.
(A) mESCs were treated with non-targeting (siNT) or INTS11-targeting (siINTS11) siRNA for 48 h and harvested for western blots. Histone H3 is a loading control. (B) Gene expression levels in cells depleted of INTS11 with siRNA as compared to siNT using total RNA-seq (n=3 per condition). Volcano plot shows fold changes and adjusted P values for active mRNA genes that did not display changes in RNA splicing (N=10,871). Affected genes are those with a fold change > 1.5 and P adj < 0.01. (C) Example browser shots of (top) Lif, which is upregulated in RNA-seq from cells treated with INTS11 siRNA (48 h), but not TT-seq following INTS11 PROTAC treatment (4 h), and (bottom) Id2, which is upregulated under both conditions. (D) Venn diagram depicting the overlap of genes affected by acute (4 h) INTS11 degradation vs. longer term INTS11 loss (48 h siRNA). P values for overlap were determined by hypergeometric test. (E) Gene Ontology (GO) analysis of 1,694 mRNA genes upregulated upon siINTS11, as defined in B. MSigDB terms with P adj < 0.05 are shown. Terms in red were also found in GO analysis of upregulated genes from PRO-seq, as in Figure S4B.
Figure 6.
Figure 6.. Sustained upregulation of FOS and JUN transcription factors activates AP-1 transcriptional program in INTS11 depleted cells.
(A) Gene expression levels in cells depleted of INTS11 with PROTAC for 16 h as compared to DMSO, using total RNA-seq (n=3 per condition). Volcano plot shows fold changes and adjusted P values for active mRNA genes shown in Figure 5B (N=10,871). Affected genes are those with a fold change > 1.5 and P adj < 0.01. (B) RNA-seq browser shots of Fos and Jun from cells treated with DMSO or PROTAC for 16 h. (C) Western blot from lysates of INTS11Halo cells treated with PROTAC or DMSO for 24 h. Vinculin and Histone H3 are loading controls. (D) Boxplots depict fold change in RNA-seq after 48 h of siINTS11 for genes upregulated (N=1,000) or downregulated (N=903) by ectopic Jun expression in mESCs (Liu et al. 2015). Boxes show 25th–75th percentiles and whiskers depict 1.5 times the interquartile range. P value from Wilcoxon signed-rank test using a theoretical median of 0. (E) Enhancers are rank ordered based on fold change in PRO-seq in the eTSS to +150 nt window. Lines at right indicate groups of enhancers used for motif search, comparing the 500 most upregulated enhancers to 1,000 unaffected enhancers. (F) The motif most significantly enriched at highly upregulated enhancers after INTS11 depletion is for AP-1. Sequences 200 bp upstream of each enhancer TSS were used.
Figure 7.
Figure 7.. INTS11 depletion reduces elongation rate.
(A and B) Metagene analyses of PRO-seq signal from INTS11Halo cells treated with DMSO or PROTAC for 4 h at mRNA genes with well-defined +1 nucleosomes (N=11,214). Data are shown as average reads per gene aligned around (A) TSSs or (B) the +1 nucleosome dyad, at single nucleotide resolution for PRO-seq and in 5 nt bins for MNase-seq (with reads depicted at read center). The peak location of PRO-seq reads, corresponding to (A) the position of paused RNAPII or (B) the initial position of stalling in the +1 nucleosome, are shown. (C) Analysis of elongation rate from INTS11Halo cells treated with DMSO or PROTAC for 4 h. Data are shown as average elongation rate in 500 nt bins. (D) Heatmap representation of fold change in elongation rate after PROTAC treatment for active mRNA genes (N=13,055). TSS is indicated by arrow. Data are shown in 500 nt bins. Bins upstream of the TSS and downstream of the TES are shaded in light gray. (E) Metagene analysis of average INTS3 ChIP-seq signal around mRNA TSSs (N=13,055), from INTS11Halo cells treated with DMSO or PROTAC for 4 h. Data are shown in 25 nt bins. (F) Western blots for phosphorylated forms of the RNAPII CTD (Ser5 or Ser2) and SPT5 after 4 h DMSO or PROTAC treatment of INTS11Halo cells. GAPDH is a loading control. (G) Metagene analysis of Ser5P ChIP-seq signal around mRNA TSSs (N=13,055), from INTS11Halo cells treated as in (F). Data are shown in 25 nt bins.

References

    1. Albrecht TR, and Wagner EJ (2012). snRNA 3’ End Formation Requires Heterodimeric Association of Integrator Subunits. - PMC - PubMed
    1. Albrecht TR, Shevtsov SP, Wu Y, Mascibroda LG, Peart NJ, Huang K-L, Sawyer IA, Tong L, Dundr M, and Wagner EJ (2018). Integrator subunit 4 is a “Symplekin-like” scaffold that associates with INTS9/11 to form the Integrator cleavage module. Nucleic Acids Res. 46, 4241–4255. - PMC - PubMed
    1. Bailey TL, Johnson J, Grant CE, and Noble WS (2015). The MEME Suite. Nucleic Acids Res. 43, 39–49. - PMC - PubMed
    1. Baillat D, and Wagner EJ (2015). Integrator: surprisingly diverse functions in gene expression. Trends Biochem. Sci 40, 257–264. - PMC - PubMed
    1. Baillat D, Hakimi M-A, Näär AM, Shilatifard A, Cooch N, and Shiekhattar R (2005). Integrator, a multiprotein mediator of small nuclear RNA processing, associates with the C-terminal repeat of RNA polymerase II. Cell 123, 265–276. - PubMed

Publication types

MeSH terms