. 2022 Dec;21(12):100434.
doi: 10.1016/j.mcpro.2022.100434. Epub 2022 Oct 27.

Global Phosphoproteomics Unveils Kinase-Regulated Networks in Systemic Lupus Erythematosus

Affiliations

Global Phosphoproteomics Unveils Kinase-Regulated Networks in Systemic Lupus Erythematosus

Shuhui Meng et al. Mol Cell Proteomics. 2022 Dec.

Abstract

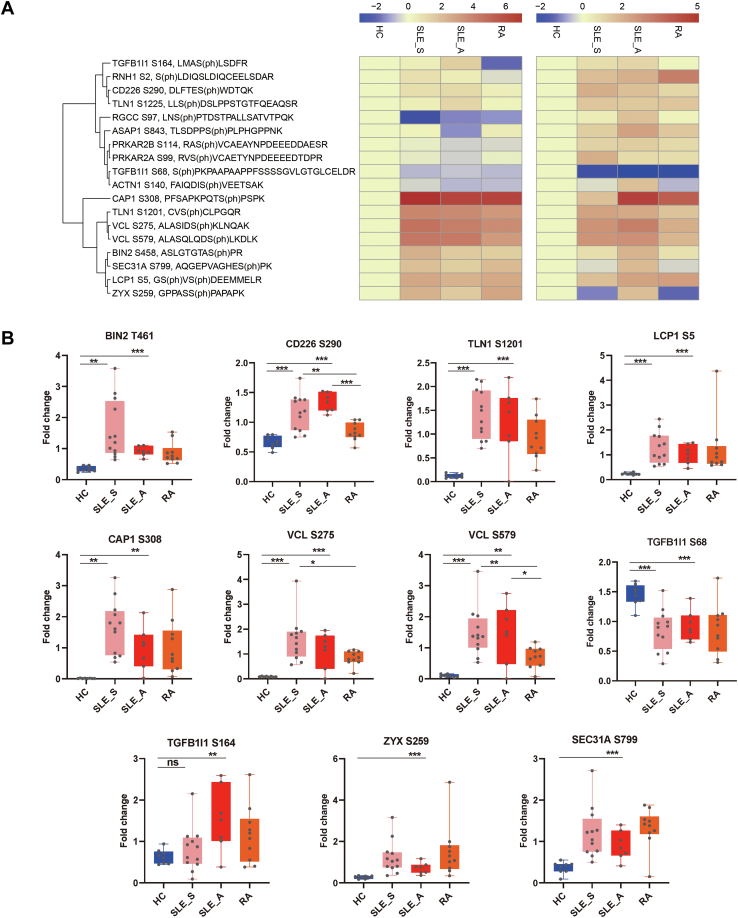
Systemic lupus erythematosus (SLE) is an autoimmune disorder characterized by immune complex deposition in multiple organs. Despite the severe symptoms caused by it, the underlying mechanisms of SLE, especially phosphorylation-dependent regulatory networks remain elusive. Herein, by combining high-throughput phosphoproteomics with bioinformatics approaches, we established the global phosphoproteome landscape of the peripheral blood mononuclear cells from a large number of SLE patients, including the remission stage (SLE_S), active stage (SLE_A), rheumatoid arthritis, and healthy controls, and thus a deep mechanistic insight into SLE signaling mechanism was yielded. Phosphorylation upregulation was preferentially in patients with SLE (SLE_S and SLE_A) compared with healthy controls and rheumatoid arthritis populations, resulting in an atypical enrichment in cell adhesion and migration signatures. Several specifically upregulated phosphosites were identified, and the leukocyte transendothelial migration pathway was enriched in the SLE_A group by expression pattern clustering analysis. Phosphosites identified by 4D-label-free quantification unveiled key kinases and kinase-regulated networks in SLE, then further validated by parallel reaction monitoring. Some of these validated phosphosites including vinculin S275, vinculin S579 and transforming growth factor beta-1-induced transcript 1 S68, primarily were phosphorylation of Actin Cytoskeleton -related proteins. Some predicted kinases including MAP3K7, TBK1, IKKβ, and GSK3β, were validated by Western blot using kinases phosphorylation sites-specific antibodies. Taken together, the study has yielded fundamental insights into the phosphosites, kinases, and kinase-regulated networks in SLE. The map of the global phosphoproteomics enables further understanding of this disease and will provide great help for seeking more potential therapeutic targets for SLE.

Keywords: SLE active stage; SLE remission stage; kinases; parallel reaction monitoring; phosphoproteomics.


Conflict of interest statement

Conflict of interest All authors declare no competing interests.

Figures

None
Graphical abstract
Fig. 1
Fig. 1
Overview of the high-throughput phosphoproteomics. A, PBMCs from three experimental groups, including patients with SLE (SLE_S = 82, SLE_A =48) (n = 130), RA (n = 96), and HC (n = 90) were subjected to LC-MS/MS analysis with a 4D-LFQ approach to generate phosphoproteomic datasets and bioinformatics analysis. B, hierarchical clustering of the differentially expressed phosphosites in patients with SLE (SLE_S, SLE_A), HC, and RA. C, the histogram of significantly regulated phosphosites on phosphorylated proteins in seven comparable groups, including SLE versus HC, SLE_ versus RA, SLE_S versus HC, SLE_A versus HC, SLE_A versus SLE_S, SLE_S versus RA, and SLE_A versus RA. Differential phosphosite expression was defined as fold change >1.5, and the p-value <0.05. D–G, Venn diagram showing unique and overlapping phosphosites in different comparison groups. HC, healthy control; IMAC, immobilized metal-affinity chromatography; PBMC, peripheral blood mononuclear cell; RA, rheumatoid arthritis; SLE, systemic lupus erythematosus; LFQ, label-free quantification.
Fig. 2
Fig. 2
Top enriched pathway profiles of GO and KEGG. A, volcano plots of quantitative analysis of phosphosites were shown in five comparable groups (Fold change >1.5, p-value <0.05). Significant upregulated sites were indicated in red and downregulated ones in blue, with top 25 sites were highlighted. B and C, the top 30 GO terms and top three KEGG pathways for significantly changing phosphosites in comparable groups, which was divided into two sets: upregulated (left) and downregulated (right). The following criteria was applied for GO terms and KEGG pathways: p-value <0.05 was considered as significant. The color represented the degree of enrichment for GO terms and KEGG pathways, red represented strong enrichment and blue represented weak enrichment. GO, Gene Ontology; HC, healthy control; KEGG, Kyoto Encyclopedia of Genes and Genomes; RA, rheumatoid arthritis; SLE, systemic lupus erythematosus.
Fig. 3
Fig. 3
Expression pattern clustering and functional analysis of phosphosites. A, five phosphoproteomic clusters were identified using the Mfuzz method. Line chart of phosphosite expression level (left), the horizontal coordinate represented samples (HC, SLE_S, SLE_A, and RA). The vertical coordinate represented the relative expression level of the phosphosites. Each line represented a phosphosite and was color-coded by the cluster membership. Heatmap of expression level (center), the horizontal coordinate represented samples (HC, SLE_S, SLE_A and RA), and the vertical coordinate represented different phosphosites, the color of heatmap indicated the relative expression of the phosphosites in the sample. Pathway enrichment analysis (right), Gene Ontology (GO), KEGG, and domain. The GO mainly included three aspects: biological process (BP), cellular component (CC), and molecular function (MF), and the top two significantly enriched items were presented in each function by different colors, p-value <0.05. B, the heatmap showed the specific phosphosites in cluster 3, 4, and 5. HC, healthy control; KEGG, Kyoto Encyclopedia of Genes and Genomes; RA, rheumatoid arthritis; SLE, systemic lupus erythematosus.
Fig. 4
Fig. 4
Kinase predicted and kinase-pathway network analysis. A, significant enriched phosphorylation motifs extracted from the overrepresented phosphopeptide dataset by motif-X. The motifs were from phosphoserine and phosphothreonine. B, the top 50 kinases were listed for four groups (HC, SLE_S, SLE_A, and RA) according to the absolute value of normalized enrichment score (NES). C, NESs of several kinases for SLE_S versus HC were shown, each substrate (phosphopeptide) was represented as a vertical black line. D, the top 10 kinase activity scores were displayed for five comparable groups, including SLE_S versus HC, SLE_A versus HC, SLE_A versus SLE_S, SLE_S versus RA, and SLE_A versus RA. E, integrative networks of the kinase-phosphosite interaction were analyzed for three comparable groups, including SLE_S versus HC, SLE_A versus HC, and SLE_A versus SLE_S. The relationship between differentially modified protein s and kinases significantly enriched by GSEA was screened, and Cytoscape software was used for drawing. HC, healthy control; RA, rheumatoid arthritis; SLE, systemic lupus erythematosus.
Fig. 5
Fig. 5
Integrative networks of the kinase-pathway interaction were analyzed for three comparable groups. A, SLE_S versus HC; B, SLE_A versus HC; C, SLE_A versus SLE_S. Kinase-function network was visualized by Cytoscape software, positive kinases represented by red and negative kinases by blue. Yellow represented upregulated phosphosites/proteins, and green represented downregulated phosphosites/proteins. In addition, yellow-green meant there were both upregulated and downregulated phosphosites in a protein, and purple squares represented enriched function (KEGG and GO). HC, healthy control; SLE, systemic lupus erythematosus.
Fig. 6
Fig. 6
Parallel reaction monitoring (PRM) validation. A, heatmap showed 18 quantified phosphosites. The PRM (left) and 4D-LFQ data (right) were depicted, the phosphosites were clustered according to the PRM profiles, the PRM data were log2-transformed, and the color code represented log2-fold changes in SLE_S, SLE_A, and RA compared with healthy controls (log2-ratios were ranged from −2 to 6). B, validated phosphosites were shown that has the same trend with 4D-LFQ. Note: ∗,∗∗,∗∗∗ represent p-value <0.05, <0.01, <0.001, respectively. ns, nonsignificant; LFQ, label-free quantification; RA, rheumatoid arthritis; SLE, systemic lupus erythematosus.
Fig. 7
Fig. 7
Kinase-phosphosite pathway involved in SLE. A, predicted kinases were validated by Western blot approach in SLE and HC PBMC groups. B, kinase-phosphosite pathway network analysis of SLE. HC, healthy control; SLE, systemic lupus erythematosus; PBMC, peripheral blood mononuclear cell; MAP3K, mitogen-activated protein kinase kinase kinase; MAP2K, mitogen-activated protein kinase kinase; TLN1, talin-1; VCL, vinculin.
Supplementary Figure 1
A, top4 enriched canonical pathway of differentially expressed phosphoproteins was shown via ingenuity pathway analysis (IPA) in SLE. B, all enriched canonical pathways of differentially expressed phosphoproteins were shown via IPA in SLE. C, activated actin signaling pathway was shown based on z-score and IPA ingenuity knowledge database, positive z-score, orange (z-score>2); the fuchsia outer ring represented the enriched proteins in this pathway. Red represented upregulated phosphoproteins. SLE, systemic lupus erythematosus.
Supplementary Figure 1B
Supplementary Figure 1C

References

    1. Durca’ L., O'Dwyer T., Petri M. Management strategies and future directions for systemic lupus erythematosus in adults. Lancet. 2019;393:2332–2343. - PubMed
    1. Lanata C.M., Paranjpe I., Nititham J., Taylor K.E., Gianfrancesco M., Paranjpe M., et al. Author correction: a phenotypic and genomics approach in a multi-ethnic cohort to subtype systemic lupus erythematosus. Nat. Commun. 2020;11:1164. - PMC - PubMed
    1. Chen C., Geng L., Xu X., Kong W., Hou Y., Yao G., et al. Comparative proteomics analysis of plasma protein in patients with neuropsychiatric systemic lupus erythematosus. Ann. Transl. Med. 2020;8:579. - PMC - PubMed
    1. Mun S., Lee J., Park A., Kim H.J., Lee Y.J., Son H., et al. Proteomics approach for the discovery of rheumatoid arthritis biomarkers using mass spectrometry. Int. J. Mol. Sci. 2019;20:4368. - PMC - PubMed
    1. Der E., Suryawanshi H., Morozov P., Kustagi M., Goilav B., Ranabothu S., et al. Tubular cell and keratinocyte single-cell transcriptomics applied to lupus nephritis reveal type I IFN and fibrosis relevant pathways. Nat. Immunol. 2019;20:915–927. - PMC - PubMed

Publication types

MeSH terms