Clinical Trial
. 2022 Oct 30;8(1):85.
doi: 10.1038/s41394-022-00551-5.

Adherence to and impact of home-based high-intensity IMT in people with spinal cord injury: a pilot study

Affiliations
Clinical Trial

Adherence to and impact of home-based high-intensity IMT in people with spinal cord injury: a pilot study

Anne E Palermo et al. Spinal Cord Ser Cases. .

Abstract

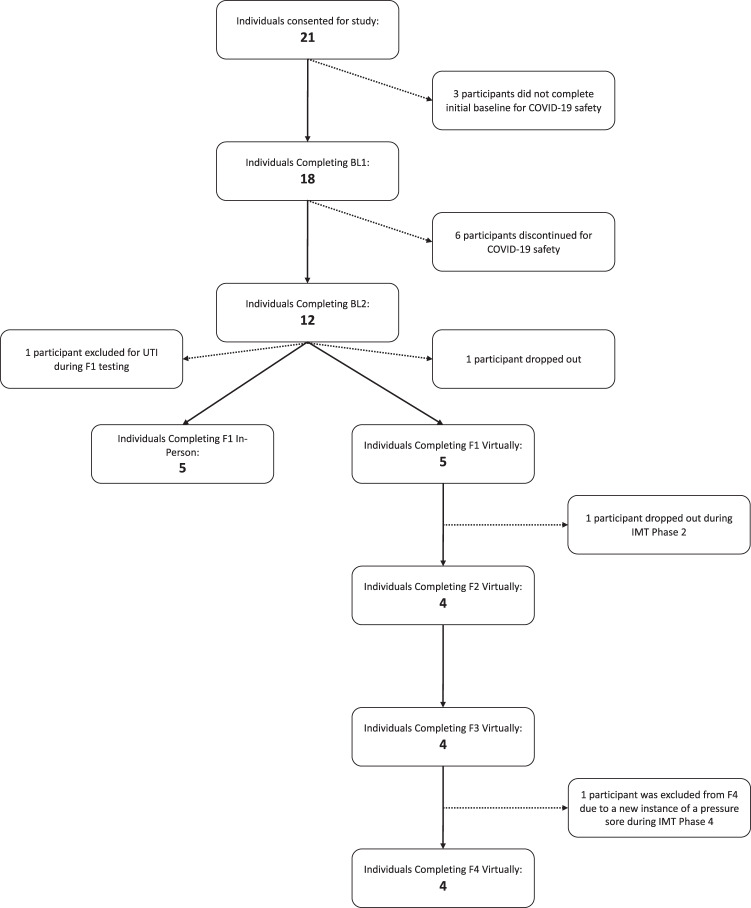
Study design: The pilot study was completed in 5 phases (Control and 4 phases of IMT) incorporating assessments at Baseline 1 (BL1), BL2, Follow-up 1 (F1), F2, F3, and F4.

Objective: To assess the adherence and impact of a daily high-intensity (80% of max) inspiratory muscle training (IMT) home program with once weekly supervision for people with spinal cord injury (SCI).

Setting: Assessments: research institution or zoom. IMT: participant's home.

Methods: Participants completed daily IMT in IMT Phase 1 and 2, once weekly in IMT Phase 3, self-selected frequency in IMT Phase 4. All phases had one weekly supervised session except IMT Phase 4. Primary outcomes included adherence and a difficulty score [DS (0- not difficult to 10- the most difficult)]. Secondary outcomes included respiratory function and seated balance.

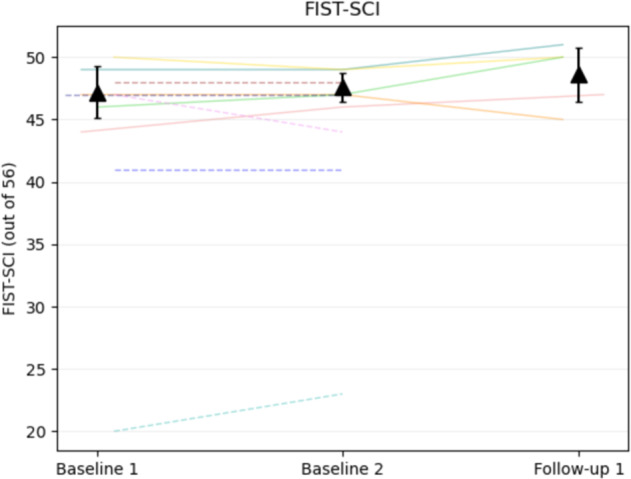
Results: Data from 10 people with chronic SCI (>1 year) (Cervical level of injury: 6, AIS: A-B, injury duration: 10.9 years 95% CI [3.9, 18.1]) were used in the analysis. Participants completed 69% of their training days in IMT Phase 1 and 65% overall reporting an average DS of 7.4 ± 1.4. Only one participant completed training during IMT Phase 4. One participant's training load was reduced due to suspected overtraining. Maximal inspiratory pressure (MIP), sustained MIP (SMIP), and total power (TP), improved significantly (p < 0.05) from BL2 to F1.

Conclusion: Our data suggest that people with SCI can perform high-intensity IMT at home to improve inspiratory performance. It is strongly recommended that participants be intermittently monitored for adherence and safety.

Clinicaltrials: gov Registration number: NCT04210063.


Conflict of interest statement

The authors declare no competing interests.

Figures

Fig. 1
Fig. 1. Altered respiratory function.
This figure summarizes the impact of SCI on RF described in a previous publication [4].
Fig. 2
Fig. 2. Protocol design.
Training frequencies for each IMT Phase are represented in the training blocks along with the number of participants who performed IMT during each phase (n) and the average number of days in each phase.
Fig. 3
Fig. 3. Protocol flow diagram.
One participant had an acute urinary tract infection [35] at Follow-up 1 (F1) and his data were not included in the analyses. Both participants who dropped out of the study, one during IMT Phase 1 and the other during IMT Phase 2, cited personal reasons relating to the COVID-19 pandemic. Another participant experienced an acute pressure sore during IMT Phase 4 and their data were not included beyond F3.
Fig. 4
Fig. 4. Change of inspiratory outcomes (n = 10).
Graphical depiction of inspiratory outcomes from Baseline 1 to Follow-up 1 of: (A) Sustained Maximal Inspiratory Pressure (SMIP), (B) Maximal Inspiratory Pressure (MIP), (C) Inspiratory Duration (ID), and (D) Total Power (TP). Each color represents data from a single participant with lines showing change between assessment values and dots representing the highest value of the variable achieved per session. The mean and 95% confidence intervals are plotted for each assessment day as black triangles. Participant 6 is represented by the color green. The * shows a significant difference in post-hoc analyses (p < .05). PTU pressure time units.
Fig. 5
Fig. 5. Change of expiratory outcomes.
Graphical depiction of expiratory outcomes from Baseline 1 to Follow-up 1 of: (A) Forced Vital Capacity (FVC), (B) Force Expiratory Volume in 1 Second (FEV1), (C) Peak Expiratory Flow (PEF), and (D) Maximal Expiratory Pressure (MEP). Each color represents data from a single participant with lines showing change between assessment values. Solid lines show the data that were used in the means calculations while dotted lines represent individuals with missing data from Follow-up 1. The mean and 95% confidence intervals are plotted for each assessment day as black triangles. Participant 6 is represented by the color green.
Fig. 6
Fig. 6. Change of functional seated balance.
Graphical depiction of Function in Sitting Test for people with spinal cord injury (FIST-SCI) outcomes from Baseline 1 to Follow-up 1. Each color represents data from a single participant with lines showing change between assessment values. Solid lines show the data that were used in the means calculations while dotted lines represent individuals with missing data from Follow-up 1. The mean and 95% confidence intervals are plotted for each assessment day as black triangles. Participant 6 is represented by the color green.
Fig. 7
Fig. 7. Change of inspiratory outcomes (n = 3).
Graphical depiction of inspiratory outcomes from Baseline 1 to follow-up 4 of: (A) sustained Maximal Inspiratory Pressure (SMIP), (B) maximal Inspiratory Pressure (MIP), (C) inspiratory duration (ID), and (D) total power (TP). Each color represents data from a single participant with lines showing change between assessment values. Solid lines show the data that were used in the means calculations while dotted lines represent individuals who did not complete all phases and follow-up assessments of the study. Dots represent the highest value of the variable achieved per session. The mean and 95% confidence intervals are plotted for each assessment day as black triangles. Participant 6 is represented by the color green. BL1 baseline 1, BL2 baseline 2, F1 follow-up 1, F2 follow-up 2, F3 follow-up 3, F4 follow-up 4, PTU pressure time units.

Similar articles

Cited by

References

    1. Park JH, Kang SW, Lee SC, Choi WA, Kim DH. How respiratory muscle strength correlates with cough capacity in patients with respiratory muscle weakness. Yonsei Med J. 2010;51:392–7. - PMC - PubMed
    1. Postma K, Vlemmix LY, Haisma JA, de Groot S, Sluis TA, Stam HJ, et al. Longitudinal association between respiratory muscle strength and cough capacity in persons with spinal cord injury: An explorative analysis of data from a randomized controlled trial. J Rehabil Med. 2015;47:722–6. - PubMed
    1. DeVivo MJ, Chen Y, Wen H. Cause of death trends among persons with spinal cord injury in the United States 1960-2017. Arch Phys Med Rehab. 2021;103:634–641. - PubMed
    1. Palermo AE, Janyszek E, Young A, Villane A, Kirk-Sanchez NJ, Cahalin LP, et al. Inspiratory muscle performance and anthropometric measures—novel assessments related to pulmonary function in people with spinal cord. Injury: A Pilot Study Arch Phys Med Rehab. 2022;103:441–50. - PubMed
    1. DeVivo MJ, Kartus PL, Stover SL, Rutt RD, Fine PR. Cause of death for patients with spinal cord injuries. Arch Phys Med Rehabil. 1989;149:1761–6. - PubMed

Publication types

Associated data