. 2022 Oct 29;13(1):6483.
doi: 10.1038/s41467-022-34175-y.

Neuronal CaMKK2 promotes immunosuppression and checkpoint blockade resistance in glioblastoma

Affiliations

Neuronal CaMKK2 promotes immunosuppression and checkpoint blockade resistance in glioblastoma

William H Tomaszewski et al. Nat Commun. .

Abstract

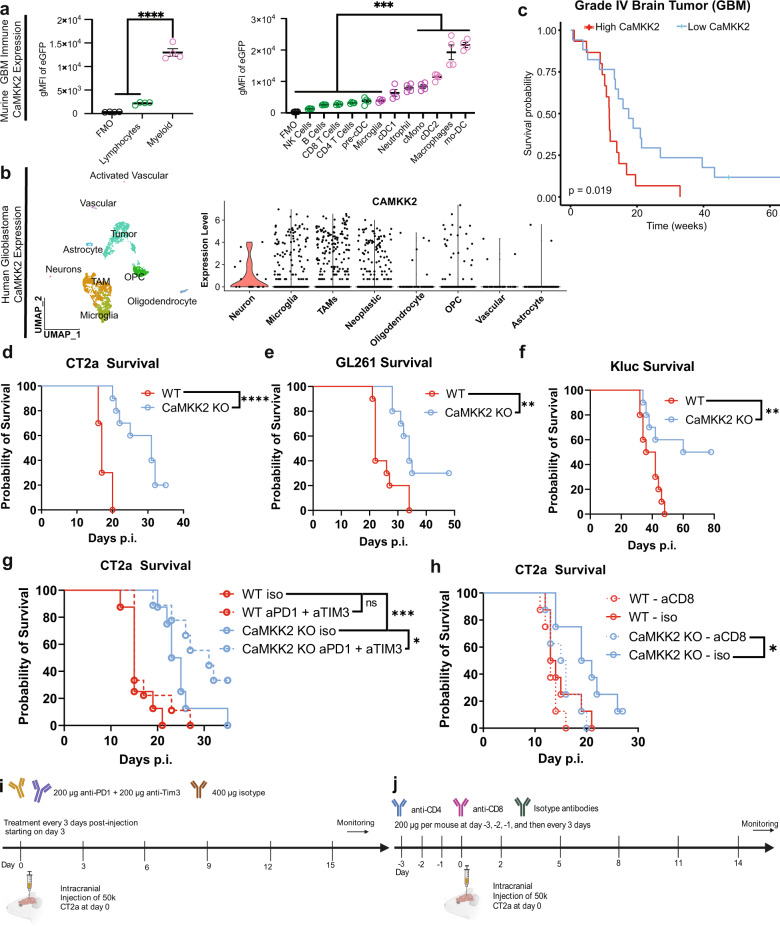
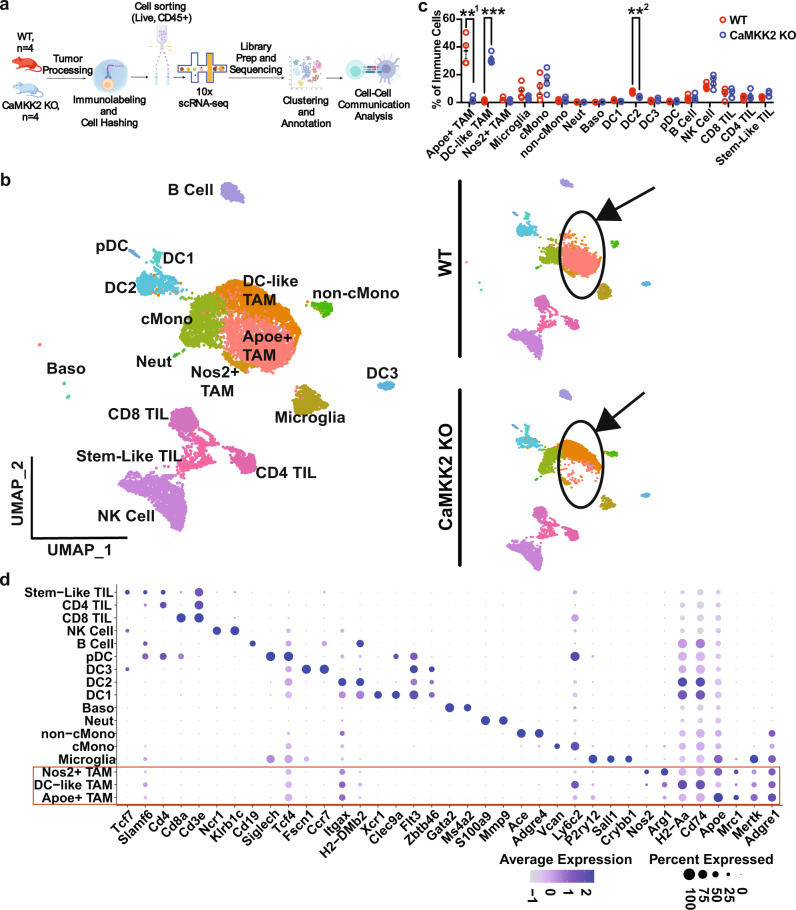
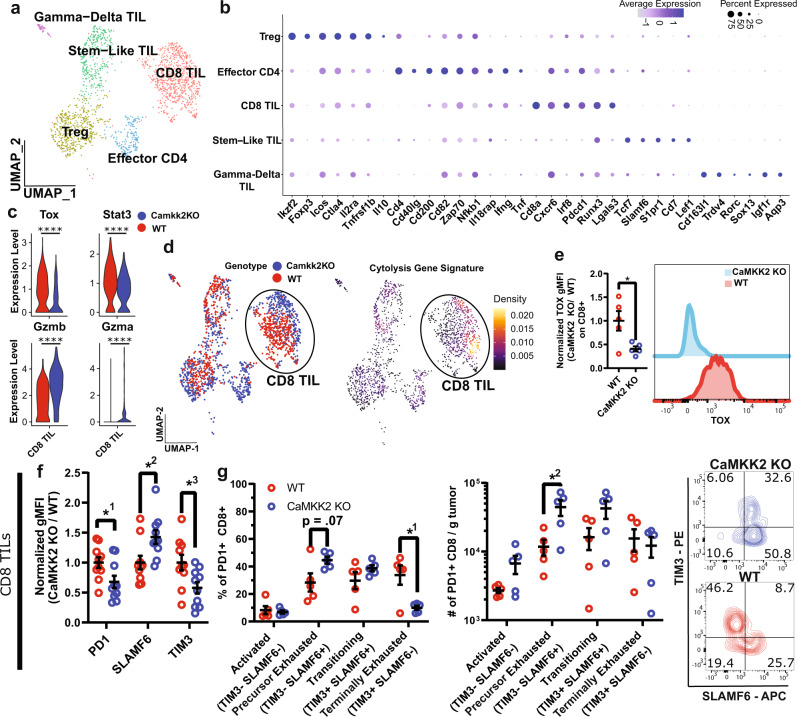
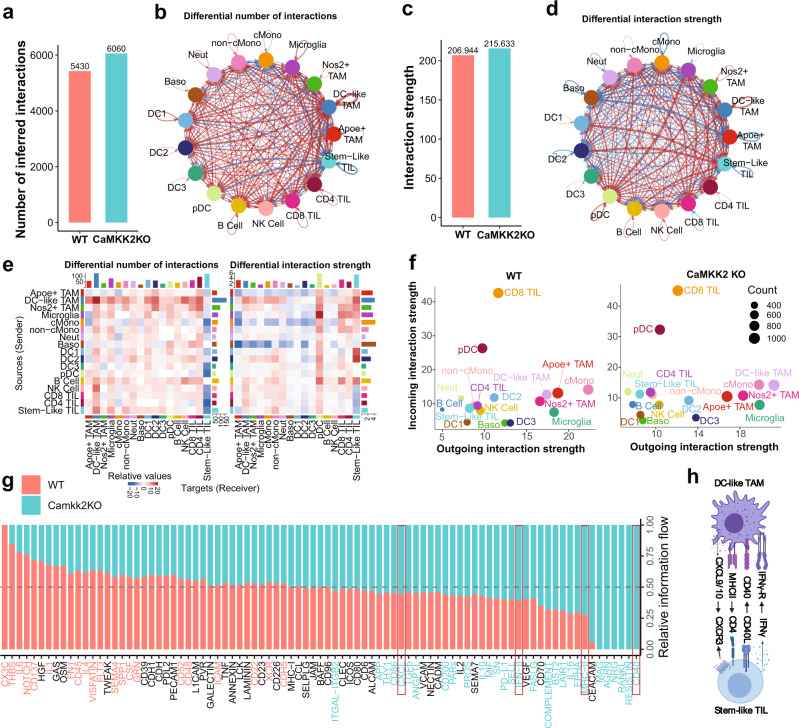
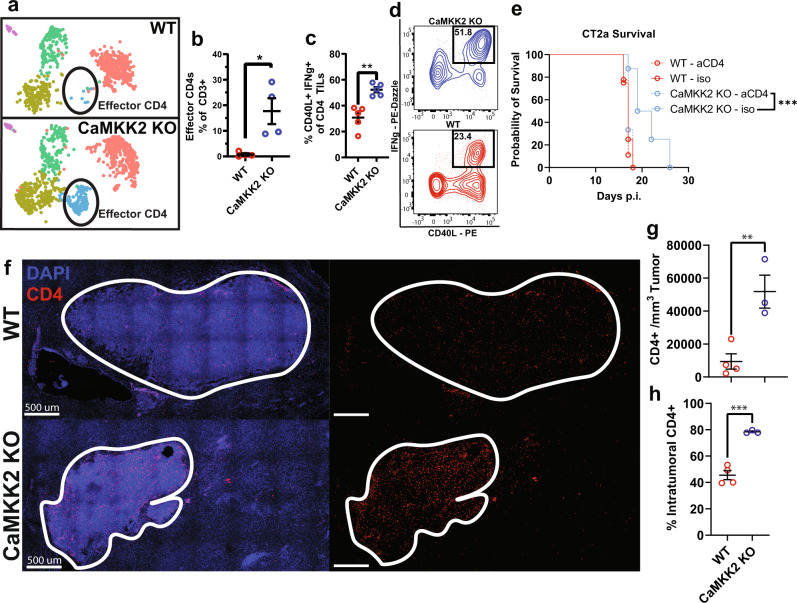
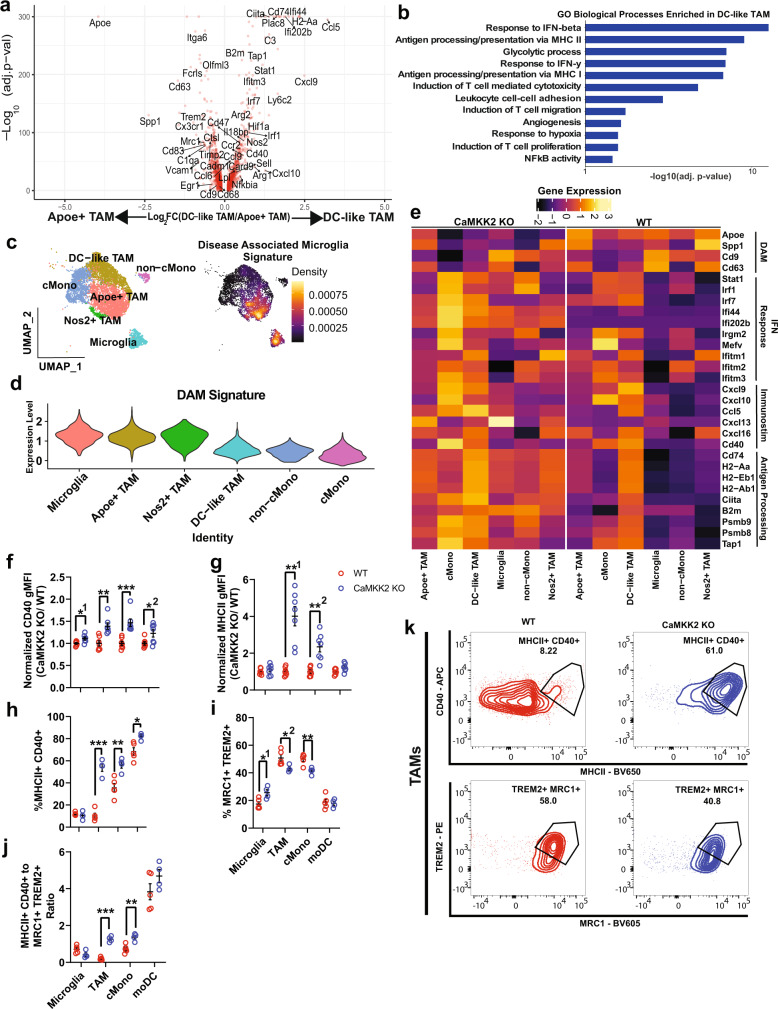
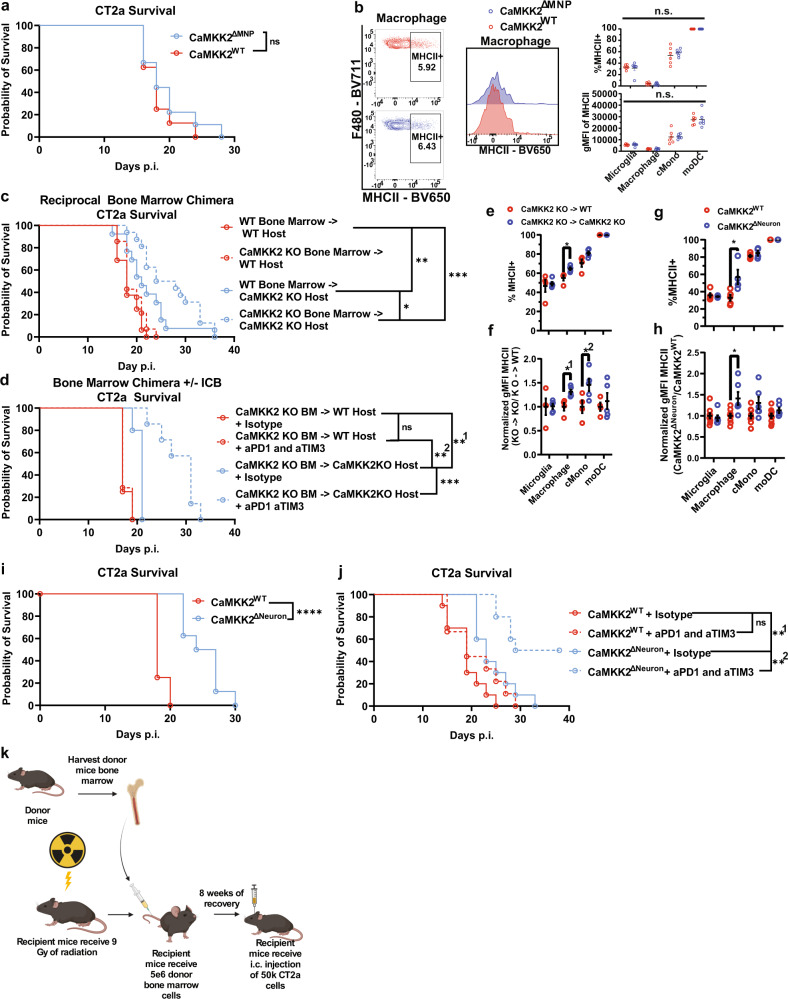
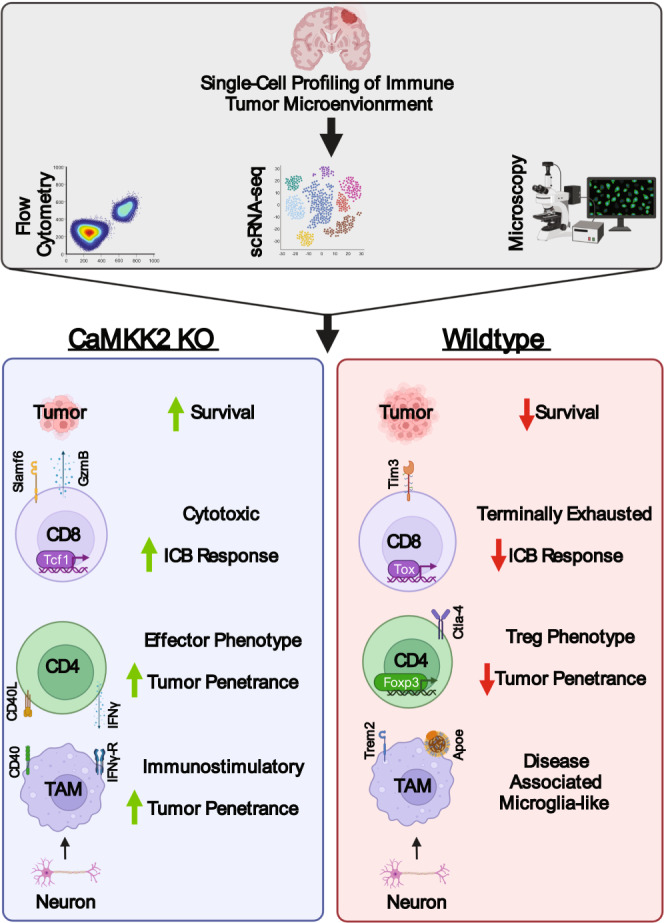
Glioblastoma (GBM) is notorious for its immunosuppressive tumor microenvironment (TME) and is refractory to immune checkpoint blockade (ICB). Here, we identify calmodulin-dependent kinase kinase 2 (CaMKK2) as a driver of ICB resistance. CaMKK2 is highly expressed in pro-tumor cells and is associated with worsened survival in patients with GBM. Host CaMKK2, specifically, reduces survival and promotes ICB resistance. Multimodal profiling of the TME reveals that CaMKK2 is associated with several ICB resistance-associated immune phenotypes. CaMKK2 promotes exhaustion in CD8+ T cells and reduces the expansion of effector CD4+ T cells, additionally limiting their tumor penetrance. CaMKK2 also maintains myeloid cells in a disease-associated microglia-like phenotype. Lastly, neuronal CaMKK2 is required for maintaining the ICB resistance-associated myeloid phenotype, is deleterious to survival, and promotes ICB resistance. Our findings reveal CaMKK2 as a contributor to ICB resistance and identify neurons as a driver of immunotherapeutic resistance in GBM.


Conflict of interest statement

P.E.F. reports consulting for Monteris Medical. J.H.S. has an equity interest in Istari Oncology, which has licensed intellectual property from Duke related to the use of poliovirus and D2C7 in the treatment of glioblastoma. J.H.S. is an inventor on patents related to the PEP-CMV DC vaccine with tetanus (US 9974848), as well as poliovirus vaccine (US 11406677) in the treatment of glioblastoma. J.H.S. has an equity interest in Annias Immunotherapeutics, which has licensed intellectual property from Duke University Medical Center related to the use of the pepCMV vaccine in the treatment of glioblastoma. M.K. reports receiving institutional research funding from AbbVie, Bristol Myers Squibb, Celldex and Specialized Therapeutics. M.K. additionally reports consulting/advisory roles with Voyager Therapeutics, AbbVie, Bristol Myers Squibb, Janssen and Janssen, Eli Lilly, Ipsen, Pfizer, and Roche. L.R. and D.P.M. have applied for a patent covering the use of CaMKK2. The remaining authors declare no other competing interests.

Figures

Fig. 1
Fig. 1. CaMKK2 expression within the GBM TME is associated with poor survival and resistance to ICB.
a Tumor-bearing hemispheres were harvested from WT (FMO) or CaMKK2-EGFP mice on D14 and stained with a multi-color flow panel to resolve major immune populations. n = 4 mice per genotype, one-way ANOVA p < 0.05 with unadjusted post hoc two-tail Fisher LSD t-test. Data are presented as mean ± SEM. ****p < 0.0001, ***p = 0.0004. b UMAP plot of Human Glioblastoma tumor microenvironment, and Violin plot of CaMKK2 expression in corresponding cell types. Data pulled from http://gbmseq.org/ and re-analyzed. c Glioblastoma survival stratified by median Log2(CaMKK2) expression where above median expression was considered “High” and below “Low”. High n = 15, low n = 17, Log-rank test. df Mice were intracranially implanted with 50k CT2a, 100k GL261, or 50k Kluc and monitored for survival. n = 10 per group, Log-rank test. d ****p < 0.0001. e **p = 0.0027. f **p = 0.0086. g 50k CT2a was implanted intracranially and either 400 ug isotype or a combination therapy of 200 ug aPD1 and 200 ug aTIM3 was administered on D3 p.i and every 3 days through D15 for a total of 5 treatments. n = 9 for ICB treated groups and n = 8 for isotype treated groups, Log-rank test. ***p = 0.0001, *p = 0.0416. h 50k CT2a was implanted intracranially and mice were monitored for survival. Either 200 ug of isotype, aCD4 or aCD8 was administered on D-3,D-2,D-1, p.i. and every 3 days after through D14 for a total of 8 treatments. n = 8 per group, Log-rank test. *p = 0.0279. i Schematic depicting ICB treatment strategy. j Schematic depicting CD4 and CD8 depletion strategy. i, j Graphics were created with BioRender.com. Source data are provided as a Source Data file.
Fig. 2
Fig. 2. Pro-tumor immune programming in the glioma microenvironment is CaMKK2 dependent.
a Schematic depicting scRNA-seq experimental design. n = 4 WT and CaMKK2 KO mice had 50k CT2a orthotopically implanted. On D14 tumors were harvested and underwent tumor processing. Samples were labeled with a Live-Dead viability Dye, CD45, and TotalSeqB anti-mouse Hashtag antibodies. CD45+ Live cells were sorted, and then pooled in equal parts by genotype. Graphic was created with BioRender.com. b 14k CD45+ Live Immune cells were sorted from WT and CaMKK2 KO tumor-bearing hemispheres on D14 p.i. HTO and Gene Expression libraries were prepared using the 10X platform. UMAP plots of the cell types identified using unsupervised clustering methods are shown for the aggregate dataset and stratified by genotype. c Abundance of immune cell types identified by scRNA-seq. n = 4 per genotype, two-way RM ANOVA p < 0.05 with post hoc unadjusted two-tail Fisher LSD t-test. **1p = 0.0059, ***p = 0.0003, **2p = 0.0016. Data are presented as mean ± SEM. d Dot plots corresponding to the cell types displayed in the UMAP plots show expression of subset-specific genes, with the dot size representing the percentage of cells expressing the gene and the color representing its average expression within a cluster. Source data are provided as a Source Data file.
Fig. 3
Fig. 3. CaMKK2 deficiency averts a terminally exhausted phenotype in tumor-infiltrating CD8+ T cells.
a UMAP plots of reclustered TILs presented in aggregate b Dot plots corresponding to the cell clusters displayed in the UMAP plot in panel a show expression of subset-specific genes. c Violin plots comparing exhaustion and cytolytic genes expression in CD8+ TILs. MAST was used for differential expression analysis. n = 366 WT and n = 350 CaMKK2. ****adj. p < 0.0001. d UMAP of reclustered TILs (same embedding as panel a) stratified by genotype, and a density plot of the cytolysis gene signature projected into UMAP space. e Tumor-bearing hemispheres were harvested on D14 post CT2a implantation and stained with a multi-color flow panel to assess Tox expression in CD8+ TILs. n = 5 per genotype, two-tailed t-test. *p = 0.0243. Each sample replicate was normalized to the average WT gMFI. f, g Tumor-bearing hemispheres were harvested on D14 post CT2a implantation and stained with a multi-color flow panel to assess abundance and accumulation of terminally exhausted and precursor-exhausted T-cell phenotypes. f n = 10, two-way RM ANOVA p < 0.05 with post hoc unadjusted two-tailed Fisher LSD t-test. *1p = 0.03, *2p = 0.0167, *3p = 0.0191. Results are combined from two independent experiments. Each experimental replicate was normalized to the average WT gMFI. g n = 5, two-way RM ANOVA p < 0.05 with post hoc unadjusted two-tail Fisher LSD t-test. *1p = 0.027, *2p = 0.0443. eg Data are presented as mean ± SEM. Source data are provided as a Source Data file.
Fig. 4
Fig. 4. Cell–cell interaction analysis infers communication between CD4+ stem-like T cells and DC-like TAMs in the setting of CaMKK2 deficiency.
a, c Cell–cell interaction analysis was performed on the scRNA-seq dataset using CellChat. Interaction strength represents the probability that a cell is sending or receiving a signal based on its expression of either ligands or cognate receptors, respectively. Total number of interactions and interaction strength of the inferred cell–cell communication networks for each genotype. b, d Differential number of interactions or interaction strength in the cell–cell communication network, visualized as a circle plot, where red or blue colored edges represent increased or decreased signaling in CaMKK2 KO compared to WT. Line thickness and darkness indicate the relative enrichment value. e Differential number of interactions or interaction strength, visualized as a heatmap, where red or blue represents increased or decreased signaling in CaMKK2 KO compared to WT. The top-colored bar plot represents the sum of a column of values displayed (incoming signaling). The right-colored bar plot represents the sum of a row of values (outgoing signaling). f Cell types with high outgoing interaction strength are expected to be initiators of cell–cell interactions, and cell types with high incoming interaction strength are expected to be targets of cell–cell interactions. Count refers to the number of inferred receptor-ligand pairs associated with each cell group. g Relative information flow from cell–cell interaction analysis. Receptor-ligand pathways with blue text are significantly enriched in CaMKK2 KO cells, and pathways with red text are significantly enriched in WT cells. h Summary diagram of cell interaction enriched in CaMKK2 KO mice. Graphic was created with BioRender.com.
Fig. 5
Fig. 5. CaMKK2 deficiency promotes tumor infiltration of effector CD4+ T cells.
a UMAP plots of reclustered TILs stratified by genotype b Abundance of Effector CD4+ TILs as a percentage of reclustered TILs. n = 4 per genotype, two-tailed t-test. *p = 0.0156. c, d Tumor-bearing hemispheres were harvested on D14 post CT2a implantation and stained with a multi-color flow cytometry panel to assess abundance of CD4 IFNγ+ CD40L+ TILs. n = 5 per genotype, two-tailed t-test. **p = 0.0015. e 50k CT2a was implanted intracranially and mice were monitored for survival. Either 200 ug of isotype or aCD4 was administered on D-3,D-2,D-1, p.i. and every 3 days after through D14 for a total of 8 treatments. n = 8 per group, Log-rank test. ***p = 0.0005. f Representative images of D14 tumor-bearing hemispheres stained with CD4 and DAPI to identify CD4+ cells and nuclei, respectively. Experiment was independently repeated twice. g Number of CD4+ cells found per mm3 tumor by confocal microscopy images of D14 tumor-bearing hemispheres. n = 4 WT, n = 3 CaMKK2 KO, two-tailed t-test. **p = 0.0082. h Percentage of intratumoral CD4+ cells of total CD4+ cells identified, in D14 tumor-bearing hemispheres, by confocal microscopy. n = 4 WT, n = 3 CaMKK2 KO, two-tailed t-test. ***p = 0.0005. b, c, g, h Data are presented as mean ± SEM. Source data are provided as a Source Data file.
Fig. 6
Fig. 6. Immunostimulatory phenotype emerges among TME mononuclear phagocytes in the absence of CaMKK2.
a Volcano plot of genes differentially expressed between DC-like and Apoe+ TAMs. Differential expression testing was performed using MAST and only genes with unadjusted p values < 0.05 are shown. n = 2276 Apoe+ TAMs n = 1959 DC-like TAMs. b Differentially expressed genes from panel a were used in GO biological processes enrichment for processes enriched in DC-like TAMs relative to Apoe+ TAMs. c UMAP plot of MNPs and Density plot of the Disease Associated Microglia Signature projected in UMAP space. d Violin plot of DAM signature expression levels across mononuclear phagocytes. e Heatmap of genes related to the DAM phenotype, interferon response, chemotaxis, and antigen processing and presentation. f, g Tumor-bearing hemispheres were harvested on D14 post CT2a implantation from WT, CaMKK2 KO mice and stained with a multi-color flow panel to assess MHC-II and CD40 expression. n = 7 per genotype, two-way RM ANOVA p < 0.05 with post hoc unadjusted two-tailed Fisher LSD t-test. Each sample was normalized to the average WT gMFI. f *1p = 0.0198, **p = 0.0012, ***p = 0.0009, *1p = 0.038. g **1p = 0.0011, **2p = 0.0022. hk Tumor-bearing hemispheres were harvested on D14 post CT2a implantation from WT, CaMKK2 KO mice and stained with a multi-color flow panel to assess ratios of immunostimulatory and DAM-like MNPs. n = 5 WT and n = 4 CaMKK2 KO, two-way RM ANOVA p < 0.05 with post hoc unadjusted two-tailed Fisher LSD t-test. h ***p = 0.0001, **p = 0.0037, *p = 0.0149. i *1p = 0.0246, *2p = 0.0263, **p = 0.005. j ***p = 0.0002, **p = 0.0029. fj Data are presented as mean ± SEM. Source data are provided as a Source Data file.
Fig. 7
Fig. 7. CaMKK2 deficiency in neurons is sufficient for licensing checkpoint blockade response and immunostimulatory macrophages.
a, c, d, i, j 50k CT2a was implanted and mice were monitored for survival, Log-rank test. b, eh Tumor-bearing hemispheres were harvested on D14 post 50k CT2a implantation, and assessed by flow cytometry. 2-way RM ANOVA p < 0.05 with post hoc unadjusted two-tail t-test. Data are presented as mean ± SEM. k Schematic depicting bone marrow chimera generation. Graphic was created with BioRender.com. c, d Bone marrow chimeras were generated as shown in panel k. d, j ICB treatment regimen is described in panel f. a n = 8 per genotype (LysMcreWTxCaMKK2fl/fl, or LysMcre+/-xCaMKK2fl/fl). b n = 6 per genotype (LysMcreWTxCaMKK2fl/fl, or LysMcre+/-xCaMKK2fl/fl). c n = 16 WT->WT, n = 14 CaMKK2 KO->WT, n = 13 WT->CaMKK2 KO, n = 16 CaMKK2 KO->CaMKK2 KO, results are combined from two experiments. ***p < 0.0001, **p = 0.0084, *p = 0.0467. d n = 8 KO->WT + isotype, n = 9 KO->WT + ICB, n = 7 KO->KO + isotype, n = 9 KO->KO + ICB. **1p = 0.0082, ***p = 0.0009, **2p = 0.0030. e, f n = 4 KO->WT, n = 5 KO->KO. e *p = 0.0313. f Each sample was normalized to the average WT gMFI. *1p = 0.0213, *2p = 0.0438. g n = 4 for Syn1cre+/-xCaMKK2fl/fl and n = 5 for Syn1creWTxCaMKK2fl/fl, *p = 0.0256. h n = 6 for Syn1cre+/-xCaMKK2fl/fl and n = 9 for Syn1creWTxCaMKK2fl/fl. Combined from two experiments. Each experimental replicate was normalized to the average WT gMFI. *p = 0.0106. i n = 8 per genotype (Syn1cre+/-xCaMKK2fl/fl and Syn1creWTxCaMKK2fl/fl), ****p < 0.0001. j n = 10 per condition except n = 9 for Syn1creWTxCaMKK2fl/fl fl + ICB group, **1p = 0.0054, **2p = 0.0023. Source data are provided as a Source Data file.
Fig. 8
Fig. 8. Working model of CaMKK2’s mechanism of action for promoting immunotherapeutic resistance.
Graphical summary of findings. Green and red arrows refer to the increased or decreased presence of a phenotype, respectively. Graphic was created with BioRender.com.

Similar articles

Cited by

References

    1. Reardon DA, et al. Effect of nivolumab vs bevacizumab in patients with recurrent glioblastoma: the CheckMate 143 Phase 3 randomized clinical trial. JAMA Oncol. 2020;6:1003–1010. - PMC - PubMed
    1. Khasraw M, Reardon DA, Weller M, Sampson JH. PD-1 inhibitors: do they have a future in the treatment of glioblastoma. Clin. Cancer Res. 2020;26:5287. - PMC - PubMed
    1. Quail DF, Joyce JA. The microenvironmental landscape of brain tumors. Cancer Cell. 2017;31:326–341. - PMC - PubMed
    1. Tomaszewski W, Sanchez-Perez L, Gajewski TF, Sampson JH. Brain tumor microenvironment and host state: implications for immunotherapy. Clin. Cancer Res. 2019;25:4202–4210. - PMC - PubMed
    1. Klemm F, et al. Interrogation of the microenvironmental landscape in brain tumors reveals disease-specific alterations of immune cells. Cell. 2020;181:1643–1660.e1617. - PMC - PubMed

Publication types

MeSH terms

Substances