. 2022 Oct 29;13(1):6473.
doi: 10.1038/s41467-022-34171-2.

Administration of broadly neutralizing anti-HIV-1 antibodies at ART initiation maintains long-term CD8+ T cell immunity

Affiliations

Administration of broadly neutralizing anti-HIV-1 antibodies at ART initiation maintains long-term CD8+ T cell immunity

Miriam Rosás-Umbert et al. Nat Commun. .

Abstract

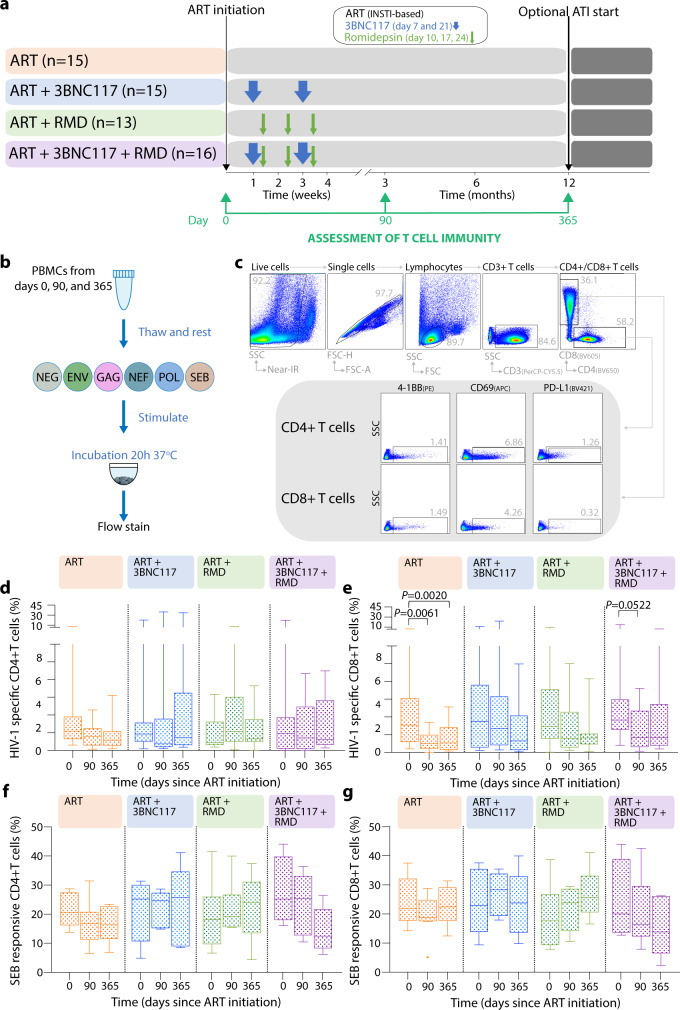
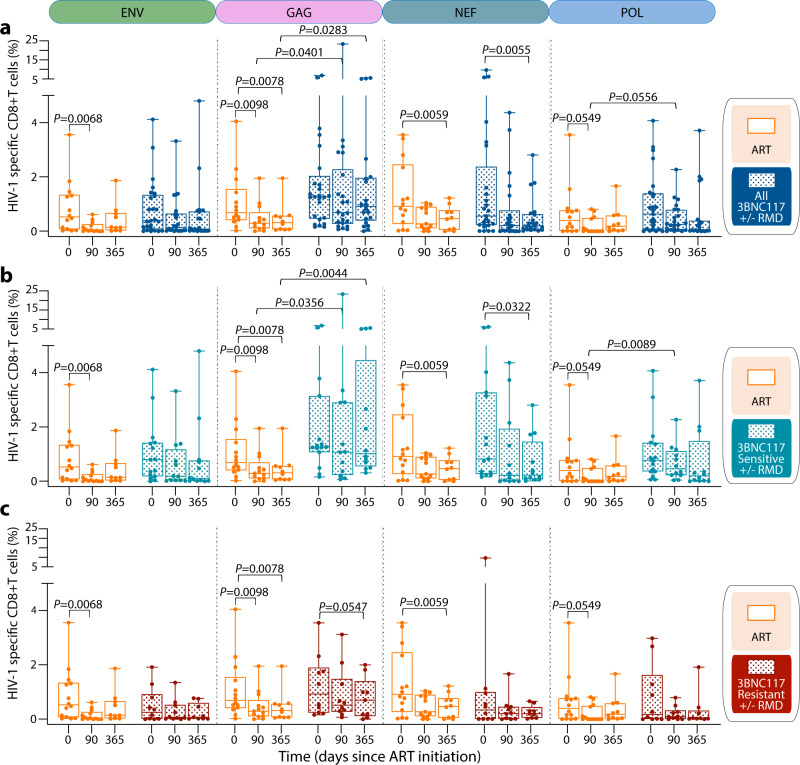
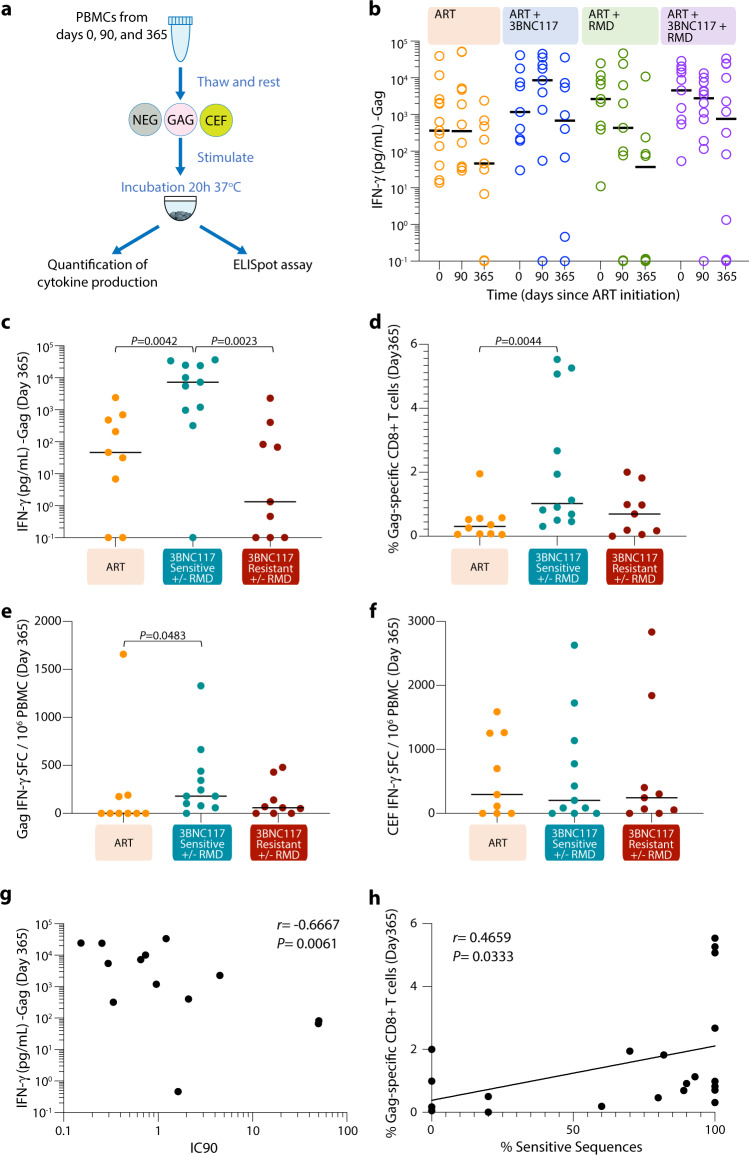
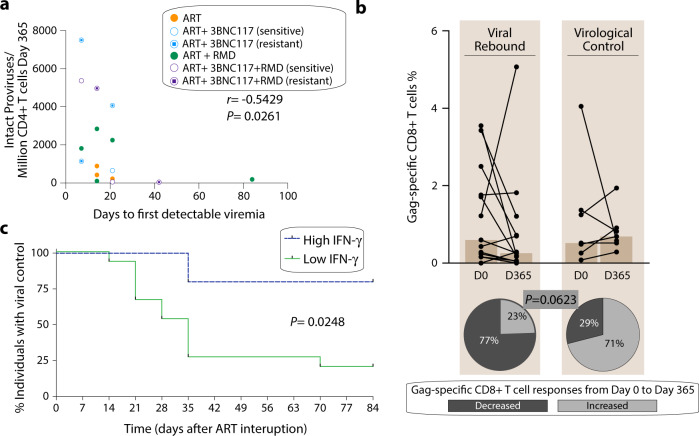
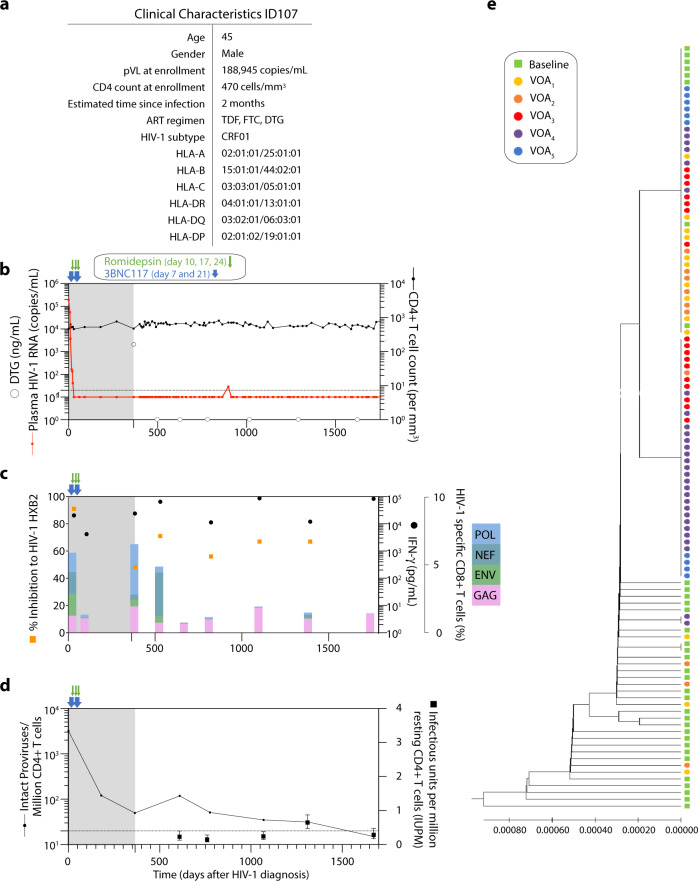
In simian-human immunodeficiency virus (SHIV)-infected non-human primates, broadly neutralizing antibodies (bNAbs) against the virus appear to stimulate T cell immunity. To determine whether this phenomenon also occurs in humans we measured HIV-1-specific cellular immunity longitudinally in individuals with HIV-1 starting antiviral therapy (ART) with or without adjunctive bNAb 3BNC117 treatment. Using the activation-induced marker (AIM) assay and interferon-γ release, we observe that frequencies of Pol- and Gag-specific CD8+ T cells, as well as Gag-induced interferon-γ responses, are significantly higher among individuals that received adjunctive 3BNC117 compared to ART-alone at 3 and 12 months after starting ART. The observed changes in cellular immunity were directly correlated to pre-treatment 3BNC117-sensitivity. Notably, increased HIV-1-specific immunity is associated with partial or complete ART-free virologic control during treatment interruption for up to 4 years. Our findings suggest that bNAb treatment at the time of ART initiation maintains HIV-1-specific CD8+ T cell responses that are associated with ART-free virologic control.


Conflict of interest statement

M.C.N. is listed as an inventor on patents for the antibody 3BNC117. All other authors declare no competing interests.

Figures

Fig. 1
Fig. 1. Evaluation of total HIV-specific T cell responses by AIM assay.
a Study design and samples evaluated. b Representation of the activation-induced marker (AIM) protocol used. c Gating strategy used to detect CD4+ and CD8+ T AIM+ T cells which were defined as the addition of the frequency of cells that were either CD69+PD-L1+4-1BB+, CD69+PD-L1+, CD69+4-1BB+ or PD-L1+4-1BB+ after subtracting the frequency of the non-stimulated condition from the antigen stimulated conditions. Total HIV-specific AIM+ cells was calculated as sum of each of the four independent antigen stimulations. Total HIV-1 specific CD4+ (d) and CD8+ T cells (e) and Staphylococcal Enterotoxin B (SEB) -responsive CD4+ (f) and CD8+ T cells (g) at day 0 (baseline), 90 and 365 days after ART initiation for each randomization group (ART-control, ART + 3BNC117, ART + romidepsin (RMD) and ART + 3BNC117 + RMD) are shown. Box-and-whisker plots show median values (center line), 25th to 75th percentiles (box outline), and the range of values (whiskers). Longitudinally collected PBMCs were available and analyzed for 52 individuals from which at least one timepoint was included (n = 14 ART-control group, n = 12 in ART + 3BNC117, n = 13 in ART + RMD and n = 14 in ART + RMD + 3BNC117). P-values were calculated using two-sided paired Wilcoxon test. Source data are provided as a Source Data file.
Fig. 2
Fig. 2. Evaluation of T HIV-specific T cell responses to four HIV-1 antigens.
Net frequency of HIV-specific CD8+ AIM+ T cells for each independent stimulation (Env, Gag, Nef and Pol) plotted by box plot for a, ART-control and individuals receiving 3BNC117 (+/− RMD). b ART-control and 3BNC117 sensitive individuals receiving 3BNC117 (+/− RMD). c ART-control and resistant 3BNC117 individuals receiving 3BNC117 (+/− RMD). Longitudinally collected PBMCs were available and analyzed for 40 individuals from which at least one timepoint was included (n = 14 ART-control group, n = 15 3BNC117 sensitive and n = 11 3BNC117 resistant individuals receiving the bNAb (+/− RMD)). Box-and-whisker plots show median values (center line), 25th to 75th percentiles (box outline), and the range of values (whiskers). P-values were calculated using two-sided paired Wilcoxon test when comparing longitudinal data of the same group and by two-sided Mann–Whitney test when comparing two different groups. Source data are provided as a Source Data file.
Fig. 3
Fig. 3. Detection of IFN-γ and correlation between T cell immunity and pre-ART sensitivity to 3BNC117.
a Representation of the protocol followed to detect interferon-gamma (IFN-γ) release and ELISpot upon Gag stimulation. b Concentration of IFN-γ (pg/mL) in the supernatants from HIV-1 Gag stimulated PBMCs detected by Mesoscale for each randomization group (n = 13 ART-control group, n = 9 in ART + 3BNC117, n = 9 in ART + RMD and n = 12 in ART + RMD + 3BNC117). Concentration of IFN-γ (pg/mL) in the supernatants (n = 29) (c), frequency of specific-CD8+ T cells (n = 31) from HIV-1 Gag stimulated PBMCs (d) and IFN-γ ELISpot response to Gag (n = 29) (e) and to CEF (CMV, EBV and influenza virus) (n = 29) (f) at 365 days after ART initiation is shown for the following groups: ART-control group, 3BNC117 sensitive individuals receiving the bNAb and 3BNC117 resistant individuals receiving the bNAb. P-values were calculated using two-sided Mann–Whitney test. g Relationship between IFN-γ release after 365 days of ART and pre-ART 3BNC117 IC90 (µg/mL) (n = 16). h Correlation between Gag-specific CD8+ T cell responses after 365 days of ART and % of pre-ART sensitive sequences to 3BNC117 determined by the “bNAb-ReP” algorithm (n = 19). Individuals with no IFN-γ production were assigned a value of 0.1 for inclusion in the graph b and c. R and P-values for two-sided Spearman rank-order correlation are shown in g and h. Source data are provided as a Source Data file.
Fig. 4
Fig. 4. Correlation of ART-free virological control.
a Correlation between the number of intact proviruses detected per million of CD4+ T cells detected after 365 days of ART (immediately preceding ATI) and days to first detectable viremia during ATI (n = 17). Individual dots are color-coded according to the groups. R and P-values were calculated using two-sided Spearman rank-order correlation. b Frequency of Gag-specific CD8+ T cell and percentage of individuals showing a decreased or increased frequency of Gag-specific CD8+ T cell responses (%) from Day 0 to Day 365 is shown for individuals that experienced a viral rebound (left, n = 13) in comparison to individuals that maintained a virological control during the ATI period (right, n = 7). P-value was calculated using two-sided Fisher’s exact test. c The proportion of individuals with high INF-γ (>750 pg/mL) versus low INF-γ (<750 pg/mL) who maintained viral control during 12 weeks of ATI (n = 20). P-value was calculated using log-rank test. Source data are provided as a Source Data file.
Fig. 5
Fig. 5. Clinical and immunological characteristics of ID107.
a Clinical characteristics for ID107: age, gender, plasma viral load and CD4 count at enrollment, estimated time since infection, ART regimen, HIV-1 subtype and HLA typing. b Plasma HIV-1 RNA levels (copies/mL) and CD4+ T cell counts are shown longitudinally over the period of the interventional (gray area) and ART-free (white area) period. Time points for measurement of the concentration of dolutegravir (DTG) (ng/mL) shown as gray circles over time. c Frequency of HIV-1-specific CD8+ T cell responses to HIV-1 Env, Gag, Pol and Nef detected by the AIM assay shown as color coded in stacked bars. IFN-γ concentration following Gag stimulation shown in black dots and percentage of viral inhibition against HIV-1HXB2 shown in orange squares. d Number of intact proviruses detected per 106 CD4+ T cells (black line) and infectious units per million resting CD4+ T cells (mean and 95% CI, black squares). e UPGMA phylogenetic tree of plasma baseline env sequences (green) and viral outgrowth from five different time points (VOA1, VOA2, VOA3, VOA4 and VOA5 at days 610, 776, 1066 1311 and 1674 after ART initiation, respectively) using Jukes-Cantor model. Source data are provided as a Source Data file.

References

    1. Chun TW, et al. Presence of an inducible HIV-1 latent reservoir during highly active antiretroviral therapy. Proc. Natl Acad. Sci. USA. 1997;94:13193–13197. doi: 10.1073/pnas.94.24.13193. - DOI - PMC - PubMed
    1. Ogg GS, et al. Decay kinetics of human immunodeficiency virus-specific effector cytotoxic T lymphocytes after combination antiretroviral therapy. J. Virol. 1999;73:797–800. doi: 10.1128/JVI.73.1.797-800.1999. - DOI - PMC - PubMed
    1. El-Sadr WM, et al. CD4+ count–guided interruption of antiretroviral treatment. N. Engl. J. Med. 2006;35522:2283–2296. - PubMed
    1. Hsu DC, Mellors JW, Vasan S. Can broadly neutralizing HIV-1 antibodies help achieve an ART-free remission? Front. Immunol. 2021;12:1–11. doi: 10.3389/fimmu.2021.710044. - DOI - PMC - PubMed
    1. Binley JM, et al. Profiling the specificity of neutralizing antibodies in a large panel of plasmas from patients chronically infected with human immunodeficiency virus type 1 subtypes B and C. J. Virol. 2008;82:11651–11668. doi: 10.1128/JVI.01762-08. - DOI - PMC - PubMed

Publication types