. 2022 Oct 29;13(1):6458.
doi: 10.1038/s41467-022-34145-4.

Single-cell profiling reveals distinct adaptive immune hallmarks in MDA5+ dermatomyositis with therapeutic implications

Affiliations

Single-cell profiling reveals distinct adaptive immune hallmarks in MDA5+ dermatomyositis with therapeutic implications

Yan Ye et al. Nat Commun. .

Abstract

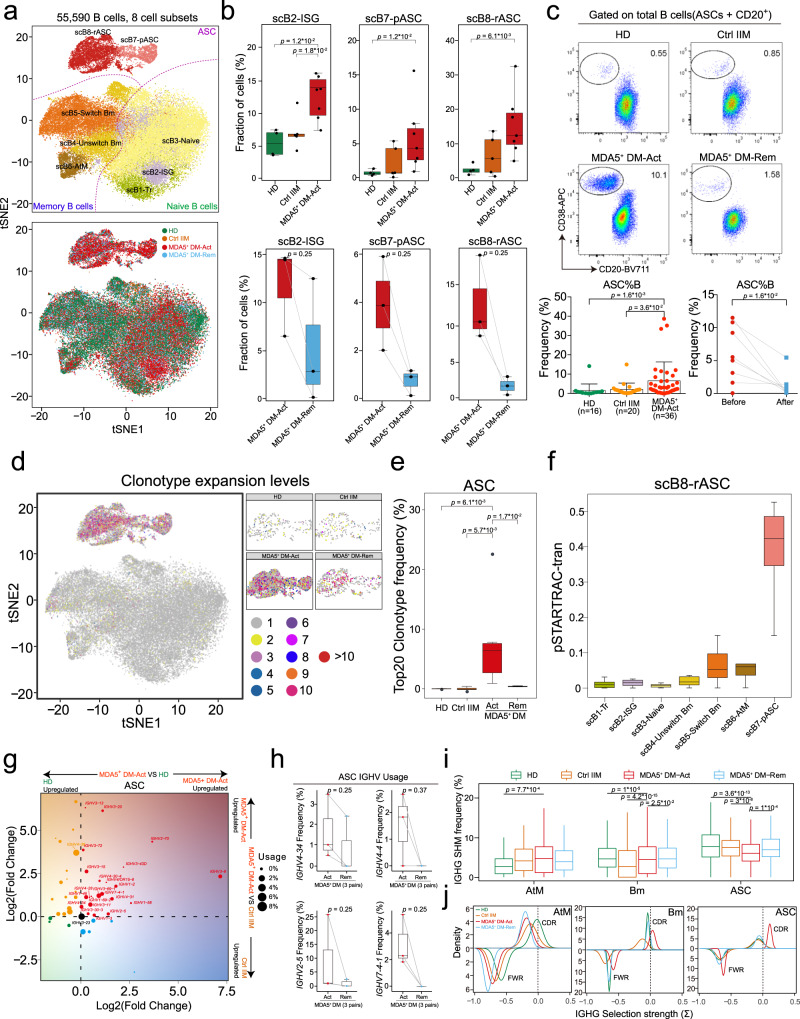
Anti-melanoma differentiation-associated gene 5-positive dermatomyositis (MDA5+ DM) is an autoimmune condition associated with rapidly progressive interstitial lung disease and high mortality. The aetiology and pathogenesis of MDA5+ DM are still largely unknown. Here we describe the immune signatures of MDA5+ DM via single-cell RNA sequencing, flow cytometry and multiplex immunohistochemistry in peripheral B and T cells and in affected lung tissue samples from one patient. We find strong peripheral antibody-secreting cell and CD8+ T cell responses as cellular immune hallmarks, and over-stimulated type I interferon signaling and associated metabolic reprogramming as molecular immune signature in MDA5+ DM. High frequency of circulating ISG15+ CD8+ T cells at baseline predicts poor one-year survival in MDA5+ DM patients. In affected lungs, we find profuse immune cells infiltration, which likely contributes to the pro-fibrotic response via type I interferon production. The importance of type I interferons in MDA5+ DM pathology is further emphasized by our observation in a retrospective cohort of MDA5+ DM patients that combined calcineurin and Janus kinase inhibitor therapy show superior efficacy to calcineurin inhibitor monotherapy. In summary, this study reveals key immune-pathogenic features of MDA5+ DM and provides a potential basis for future tailored therapies.


Conflict of interest statement

The authors declare no competing interests.

Figures

Fig. 1
Fig. 1. Single-cell atlas of peripheral B and T cells from MDA5+ DM patients and controls.
a Flowchart depicting the overall experimental design of this study. Adobe Illustrator 2020 was used to create the image. b t-SNE plot showing the overview of 26 cell clusters in the integrated single-cell transcriptomes of 111,200 peripheral B and T cells derived from MDA5+ DM patients, IIM disease controls, and HDs (Supplementary Table 1). Clusters are named according to the indicated immune cell subsets using the specific gene expression patterns (Supplementary Table 2) and are color-coded. c t-SNE plots showing the single-cell transcriptomes of peripheral B and T cells from HD, Ctrl IIM, MDA5+ DM-Act, and MDA5+ DM-Rem groups. Cell subsets are color-coded as in (b). d TooManyCells clustering tree to display the scRNA-seq data as cell clades for the four groups. Cells are divided into clusters and related clusters rather than being presented as individual cells. e Patient group preference of each cluster measured by the ratio of observed to randomly expected cell numbers (RO/E) calculated by the STARTRAC-dist alogrithm.
Fig. 2
Fig. 2. Expanded peripheral antibody-secreting cells (ASCs) with unique BCR features in MDA5+ DM patients.
a t-SNE plots showing eight B cell clusters, color-coded according to cell subset (upper) or group (lower). b Boxplots showing the proportions of scB2-ISG, scB7-pASC, and scB8-rASC cells from HD (n = 4), Ctrl IIM (n = 5), MDA5+ DM-Act (n = 7) and MDA5+ DM-Rem (n = 3) groups. c Representative flow cytometric plots showing the frequency of ASCs among all B cells from the indicated groups (upper). Scatter plots showing the accumulated data for the frequency of ASC from the indicated groups (bottom). Data are presented as mean ± standard deviation (SD) and the error bars denote SD (bottom left panel). d t-SNE plots showing the projection of BCR clonotype expansion levels on total B cells, color-coded by clonal expansion levels. e Boxplot showing the top 20 clonotype frequencies for each group. f Boxplot showing state transition between scB8-rASC and other B cell clusters in MDA5+ DM-Act patients quantified by the pSTARTRAC-tran algorithm according to the BCR clonotypes. g Inferred IGHV family usage preference in the ASCs of MDA5+ DM-Act patients compared with those from the HD (x-axis) or Ctrl IIM (y-axis) groups. Log2 (fold change) values were used to draw the plot, with each point sized by the IGHV usage and color-coded by the group specificity. h Box plots showing the comparisons of the frequencies of IGHV4-34, IGHV4-4, IGHV2-5, and IGHV7-4-1 in ASCs between active and remitted MDA5+ DM patients (n = 3). i Boxplots showing the somatic hypermutation (SHM) frequencies of the IGHG genes of the Atm (n = 425), Bm (n = 2512) and ASC (n = 2329) cells across four groups. j Density plots showing the IGHG selection strengths on the complementary-determining region (CDR, upper) and framework region (FWR) of the indicated B cell clusters across four groups. Box plot center, box and whiskers correspond to median, interquartile range (IQR) and 1.5 × IQR, respectively (b, e, f, h, i). Statistical significance is calculated by the two-tailed Mann–Whitney test (b, c, e, i) and Wilcoxon matched-pairs signed rank test (c). Source data are provided as a Source Data file.
Fig. 3
Fig. 3. Clonally-expanded CD8+ memory T cells and related TCR features in MDA5+ DM patients.
a t-SNE plots showing seven CD8+ T cell clusters, color-coded according to the cell subset (upper) or group (lower). b Box plots showing the proportions of scCD8T4-GZMK+GZMB+ Tm, scCD8T8-ISG, and scCD8T7-pTm cells from HD (n = 4), Ctrl IIM (n = 5), MDA5+ DM-Act (n = 7) and MDA5+ DM-Rem (n = 3) groups. c Representative flow cytometric plots showing the frequency of Ki67+ CD8+ T cells from indicated groups (upper). Scatter plots showing the accumulated data for Ki67+%CD8+ T cells from indicated groups (bottom). Data are presented as mean ± SD and the error bars denote SD (bottom left panel). d t-SNE plot showing 446 CD4+ T cells and 7397 CD8+ T cells with clonal expansion (clonotype >1), color-coded by the clonal expansion levels.e Box plots showing TCR clonality (upper) and TCR diversity (lower) in different CD8+ T cell clusters (n = 5666 cells; 1704 cells; 1285 cells; 542 cells; 4569 cells; 1175 cells; 519 cells; from left to right) across four groups. f Triangle heatmap showing the overlap of expanded TCR clonotypes across all CD8+ T cell clusters in MDA5+ DM-Act patients. Data are aggregated from each patient within the group. Numbers indicate the normalized Jaccard index of shared expanded TCR clonotypes for each cluster pair. g Inferred TRBV family usage preference in the CD8+ Tm cells of MDA5+ DM-Act patients compared with those from the HD (x-axis) or Ctrl IIM (y-axis) groups. Log2 (fold change) values are used to draw the plot, with each point sized by the TRBV usage in MDA5+ DM-Act patients and color-coded by the group specificity. h Box plots showing the comparisons of the frequencies of TRBV7-9, TRBV20-1, TRBV28, and TRBV30 in CD8+ Tm cells between active and remitted MDA5+ DM patients. Box plot center, box and whiskers correspond to median, IQR and 1.5 × IQR, respectively (b, e, h). Statistical significance is calculated by the two-tailed Mann–Whitney test (b, c, e) and Wilcoxon matched-pairs signed rank test (c). *, p < 0.05. Source data are provided as a Source Data file.
Fig. 4
Fig. 4. Transcriptional and regulon network analysis of peripheral B and T cells in MDA5+ DM patients.
a Heatmap displaying scaled expression values of the top 15 differentially expressed genes (DEGs) in peripheral B and T cells between the four groups. b Bubble plot showing the top 5 gene ontology (GO) term enrichment pathways from the upregulated top 15 DEGs of each group. c Heatmap showing the regulon areas under the curve per Cell (AUCell) scores from peripheral B and T cells across the four groups, calculated using the SCENIC algorithm. d t-SNE plots showing the regulon activities of IRF7 and FOSB in peripheral B and T cells across the four groups, color-coded by AUCell scores. e Cytoscape graph showing the regulatory networks comprising regulons and their target genes underlying B and T cell development and function. For visualization, there are only 50 randomly-selected targets for each regulon. Each target gene is color-coded by the group specificity (genes with avglog2FC > 0.5 are marked in the graph). f Heatmap showing plasma cytokine profiles across the MDA5+ DM, Ctrl IIM, and HD groups. The scale bar represents the scaled average expression of the cytokines. g Scatter plots showing the plasma cytokine levels of IFN-α, IFN-γ, IP-10, and VEGF-D in the MDA5+ DM, Ctrl IIM, and HD groups. Data are presented as mean ± SD and the error bars denote SD. Statistical significance is calculated using the two-tailed Mann–Whitney test. avglog2FC: log of average expression fold change; IFN-α, interferon alpha; IFN-γ, interferon gamma; IP-10, inducible protein 10; VEGF-D, vascular endothelial growth factor-D. Source data are provided as a Source Data file.
Fig. 5
Fig. 5. Abnormal metabolic reprogramming of peripheral B and T cells in MDA5+ DM patients.
a Bubble plots showing the metabolic activities of peripheral B cells (n = 55,590), and CD4+ T cells (n = 30,242) and CD8+ T cells (n = 22,753) across the four groups. Color represents the scaled metabolic scores sized by the fraction of cells (ssGSVA score >0). The MDA5+ DM-Act group has the highest comprehensive metabolic scores (right). b Violin plots showing the selected metabolic pathways of B cells (n = 55,590), CD4+ T cells (n = 30,242), and CD8+ T cells (n = 22,753) across the groups. c Heatmap showing the average expression of selected genes from selected metabolic pathways as in (b). The potential druggable targets are labeled with a pill symbol. d Correlation analysis between metabolic scores and ISG scores by each donor from all four groups (Spearman’s correlation) with a 95% confidence. e Ordering the individual metabolic pathways according to the Spearman correlation coefficients between each metabolic pathway score and ISG score. ssGSVA, single-sample gene set variation analysis; ISG, interferon-stimulating gene. Box plot center, box and whiskers correspond to median, IQR and 1.5 × IQR, respectively (a, b).
Fig. 6
Fig. 6. Single-cell profiling of the lung tissues from an MDA5+ DM patient.
a Diagram depicting the lung sample sources. Adobe Illustrator 2020 was used to create the image. b t-SNE plot showing of the overview of 16 cell clusters in the integrated single-cell transcriptomes of 13,695 lung cells from one MDA5+ DM-Act patient (4337 cells) and two healthy donors (9358 cells) from a public source. Clusters are named as indicated cell subsets according to the specific gene expression patterns (Supplementary Table 3) and are color-coded. c Comparison of cell type fractions in individual samples. CD4+ and CD8+ T cell subsets are shown on the right. d Representative mIHC images showing the staining for CD8 (green, middle and bottom), Ki67 (red, middle), MX1 (red, bottom), and DAPI (blue, middle and bottom) in the lung tissues of a Ctrl (n = 1; normal part of lung adenocarcinoma) and MDA5+ DM (n = 2; low immune cell infiltration and high immune cell infiltration, respectively) patients. The white arrows indicate Ki67+CD8+ T cells (middle) and MX1+CD8+ T (bottom) cells, and the yellow arrows indicate Ki67CD8+ T cells (middle) and MX1CD8+ T cells (bottom). Scale bar: 50 μm. e Heatmap showing GO enrichment pathways for individual donors according to donor-specific expressed genes (avglog2FC > 0.5). f CellChat analysis showing type I IFN signaling intercellular communication between cell subtypes. g Bubble plots showing ligand–receptor interactions between fibroblasts and the indicated cell types, with a significant difference between the MDA5+ DM and HD groups. mIHC, multiplex immunohistochemistry; DAPI, 4’, 6-diamidino-2-phenylindole; Ctrl, control; GO, gene ontology; avglog2FC: log of average expression fold change.
Fig. 7
Fig. 7. Prognostic value of ISG15+CD8+ T cells.
a Representative flow cytometric plots showing the gating strategies for ISG15+ B cells, and CD4+ and CD8+ T cells. Mouse CD3+ T cells were used as the negative controls. b Scatter plots showing the frequencies of ISG15+%B, ISG15+%CD4, ISG15+%CD8, MX1+%B, MX1+%CD4, and MX1+%CD8 cells from the indicated groups. The number of each group is indicated in parentheses. Data are presented as mean ± SD and the error bars denote SD. Statistical significance is calculated using the two-tailed Mann–Whitney test. c Univariate and multivariate Cox proportional hazards analyses of the indicated parameters for 1-year survival in active MDA5+ DM patients (n = 31). d Receiver operating characteristic (ROC) analysis of the indicated parameters to predict 1-year survival in active MDA5+ DM patients (n = 31). e Kaplan–Meier analysis of 1-year survival for ISG15+%CD8 and ferritin in MDA5+ DM patients (n = 31). The log-rank test is used. f Kaplan–Meier analysis of 6-month survival to compare the therapeutic efficacies in MDA5+ DM patients between the CNI group (n = 22) and the CNI + TOFA group (n = 14). The log-rank test is used. CNI, calcineurin inhibitor; TOFA, tofacitinib; ISG, interferon-stimulating gene. Source data are provided as a Source Data file.

Comment in

References

    1. Lundberg IE, et al. 2017 European League Against Rheumatism/American College of Rheumatology classification criteria for adult and juvenile idiopathic inflammatory myopathies and their major subgroups. Ann. Rheum. Dis. 2017;76:1955–1964. - PMC - PubMed
    1. Lundberg IE, et al. Idiopathic inflammatory myopathies. Nat. Rev. Dis. Prim. 2021;7:86. - PubMed
    1. Mammen AL, Allenbach Y, Stenzel W, Benveniste O, Group, E.t.W.S. 239th ENMC International Workshop: Classification of dermatomyositis, Amsterdam, the Netherlands, 14-16 December 2018. Neuromuscul. Disord. 2020;30:70–92. - PubMed
    1. Wu W, et al. Interstitial lung disease in anti-MDA5 positive dermatomyositis. Clin. Rev. Allergy Immunol. 2021;60:293–304. - PubMed
    1. Allenbach Y, et al. Different phenotypes in dermatomyositis associated with anti-MDA5 antibody: Study of 121 cases. Neurology. 2020;95:e70–e78. - PMC - PubMed

Publication types

MeSH terms