

The trophic niche of subterranean populations of Speleomantes italicus
- PMID: 36309527
- PMCID: PMC9617932
- DOI: 10.1038/s41598-022-21819-8
The trophic niche of subterranean populations of Speleomantes italicus
Abstract
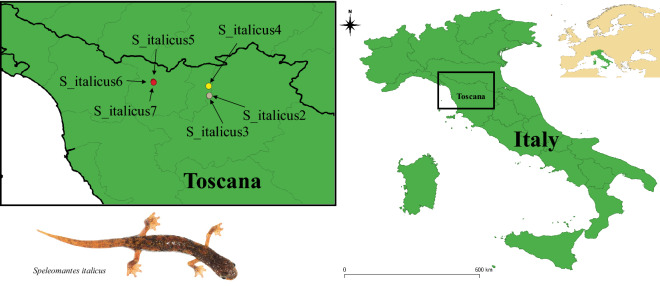
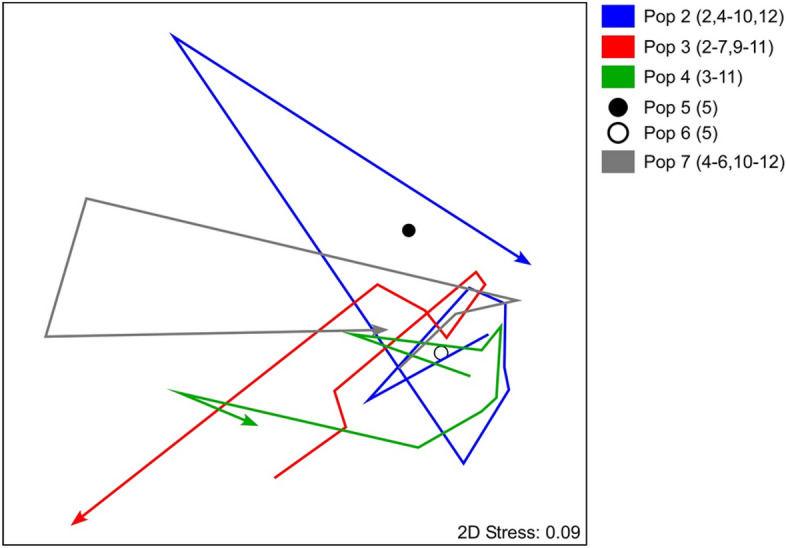
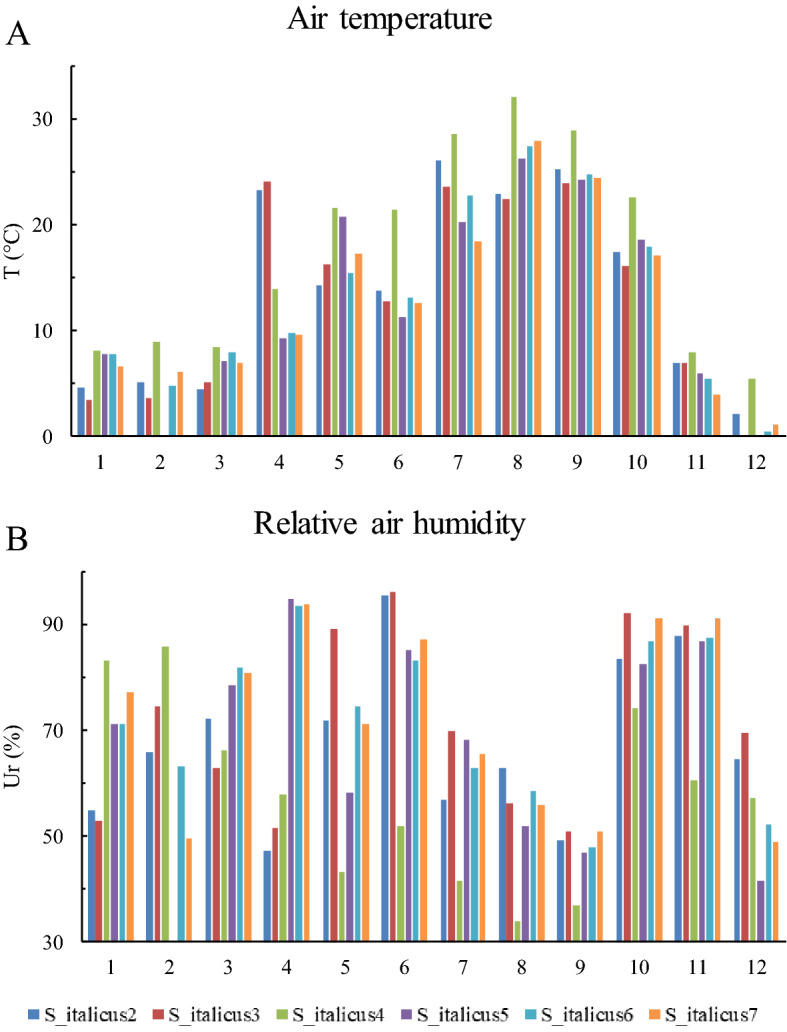
The determination of a species trophic niche can clarify its functional role within a food web and how prey resources are used in relation with the spatial and temporal variability of environmental conditions. This information may result particularly useful for the implementation of conservation plans of endangered species having a cryptic behaviour or living in places difficult to be surveyed. Here we present the first long-term study on the trophic niche of the Italian cave salamander Speleomantes italicus, a strictly protected facultative cave species that seasonally exploits surface environments (e.g., forested areas) as well as both natural and artificial subterranean environments. We analysed the diet variation of six populations of S. italicus inhabiting natural caves, surveyed 24 times in a full year. During the surveys, all sampled individuals were subjected to stomach flushing and the ingested prey were identified and enumerated; furthermore, salamanders' body condition was also evaluated. The results of the analyses provided the first comprehensive, year-round assessment of the diet for a Speleomantes species. Remarkable divergences in terms of trophic niche and body condition were observed between the studied populations. We found a discrepancy in the foraging activity of the populations located in different areas; specifically, the individuals that experienced sub-optimal microclimatic conditions poorly performed in foraging. Furthermore, we found temporal and spatial variability in the body condition of individuals. Our study highlighted a remarkably high spatial and temporal divergence in the trophic habits of conspecific populations, a feature that may represent one of the major factors promoting the variability of multiple population traits.
© 2022. The Author(s).
Conflict of interest statement
The authors declare no competing interests.
Figures


References
-
- Hutchinson GE. Concluding remarks. Cold Spring Harb. Symp. Quant. Biol. 1957;22:415–427. doi: 10.1101/sqb.1957.022.01.039. - DOI
-
- Manenti R, Melotto A, Guillaume O, Ficetola GF, Lunghi E. Switching from mesopredator to apex predator: How do responses vary in amphibians adapted to cave living? Behav. Ecol. Sociobiol. 2020;74:126. doi: 10.1007/s00265-020-02909-x. - DOI
-
- Pekár S, García LF, Viera C. Behaviour and Ecology of Spiders. Springer; 2017.
-
- Nawrocki B, Colborne SF, Yurkowski DJ, Fisk AT. Foraging ecology of Bowfin (Amia calva), in the Lake Huron-Erie Corridor of the Laurentian Great Lakes: Individual specialists in generalist populations. J. Great Lakes Res. 2016;42:1452–1460. doi: 10.1016/j.jglr.2016.08.002. - DOI
-
- Nifong JC. Living on the edge: Trophic ecology of Alligator mississippiensis (American alligator) with access to a shallow estuarine impoundment. Bull. Fla. Mus. Nat. Hist. 2016;54:13–49.
