. 2022 Oct 29;5(1):1149.
doi: 10.1038/s42003-022-04150-w.

Loss of E-cadherin is causal to pathologic changes in chronic lung disease

Affiliations

Loss of E-cadherin is causal to pathologic changes in chronic lung disease

Baishakhi Ghosh et al. Commun Biol. .

Abstract

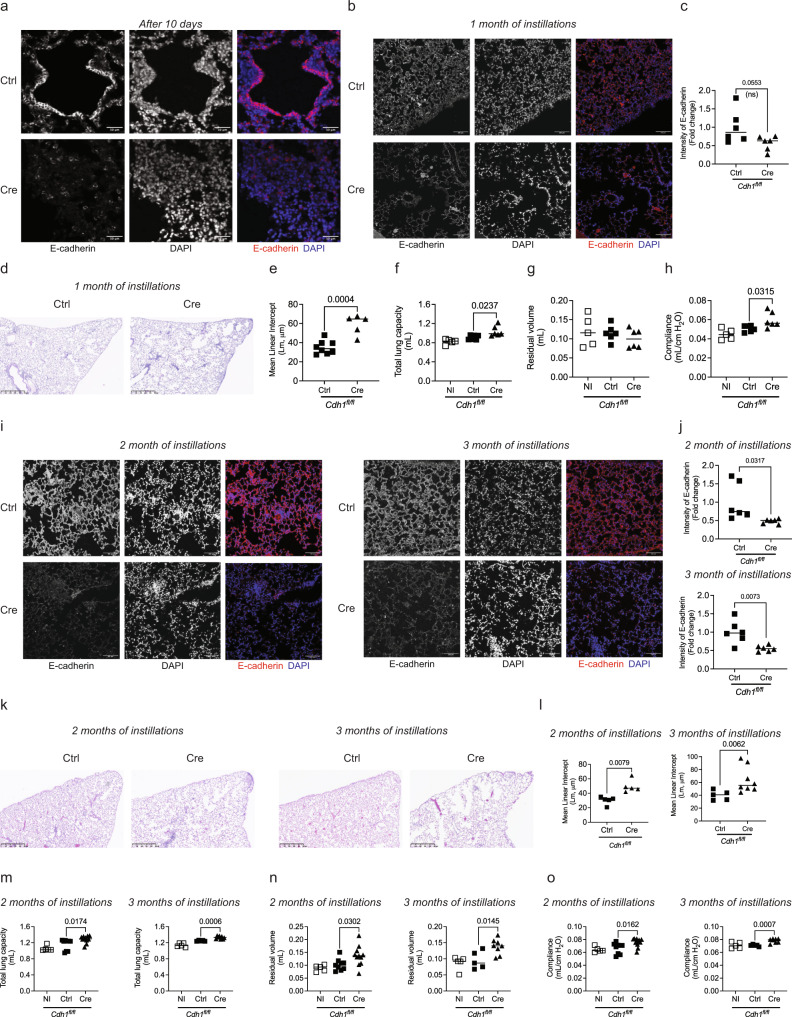
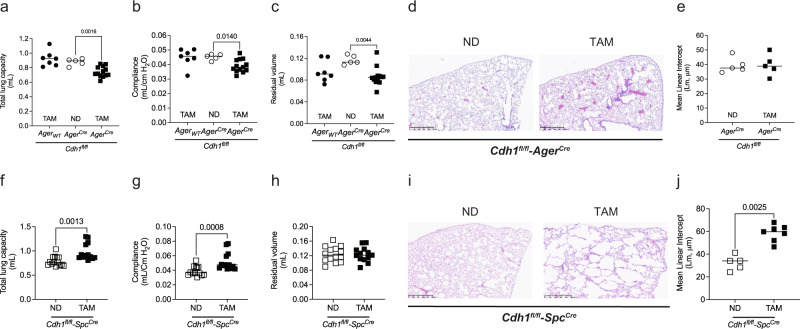
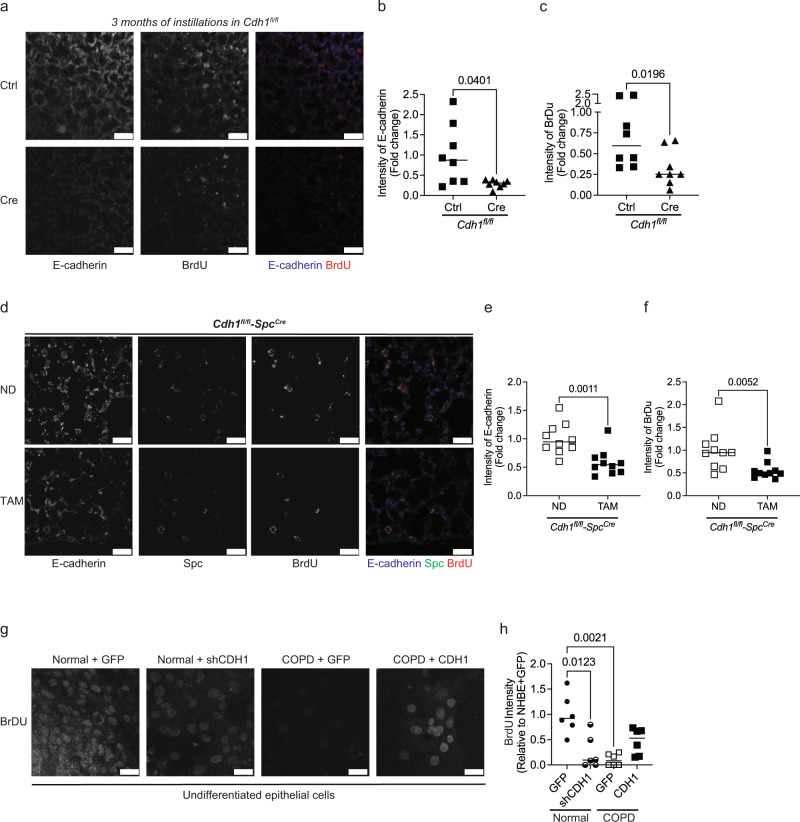
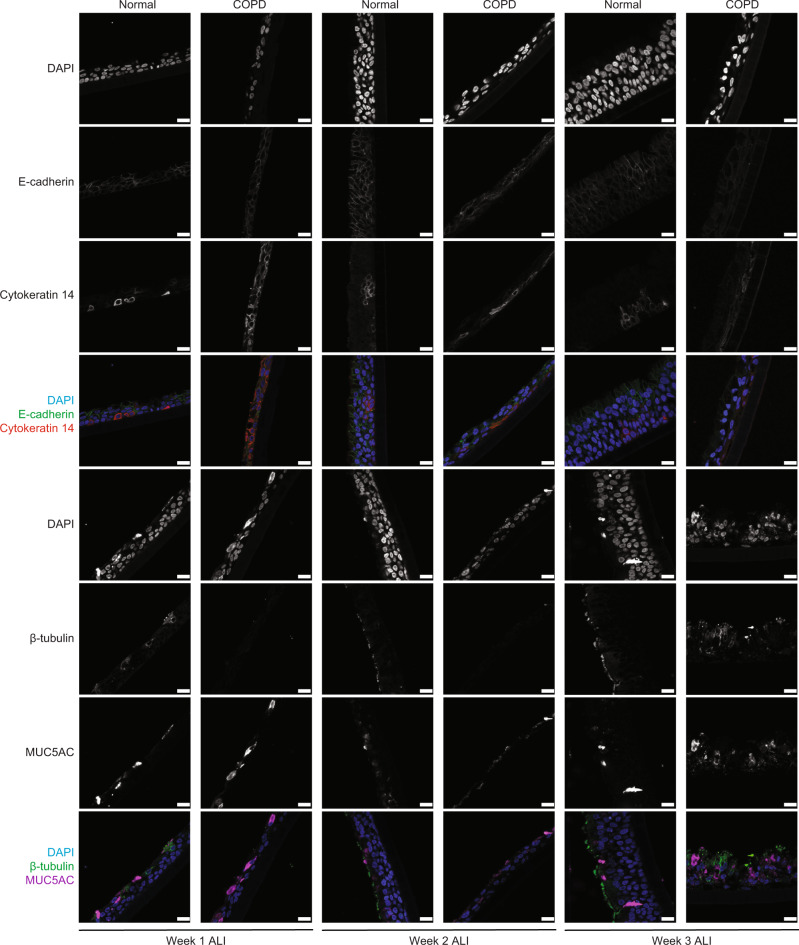
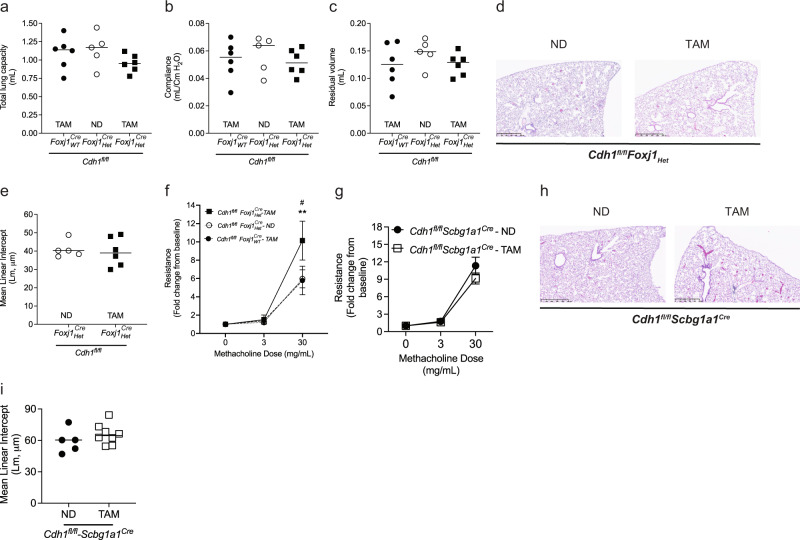
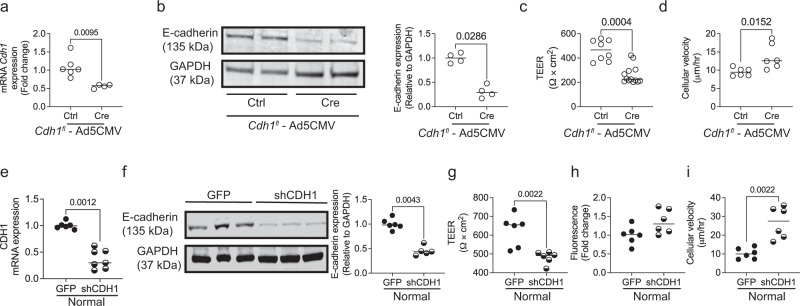
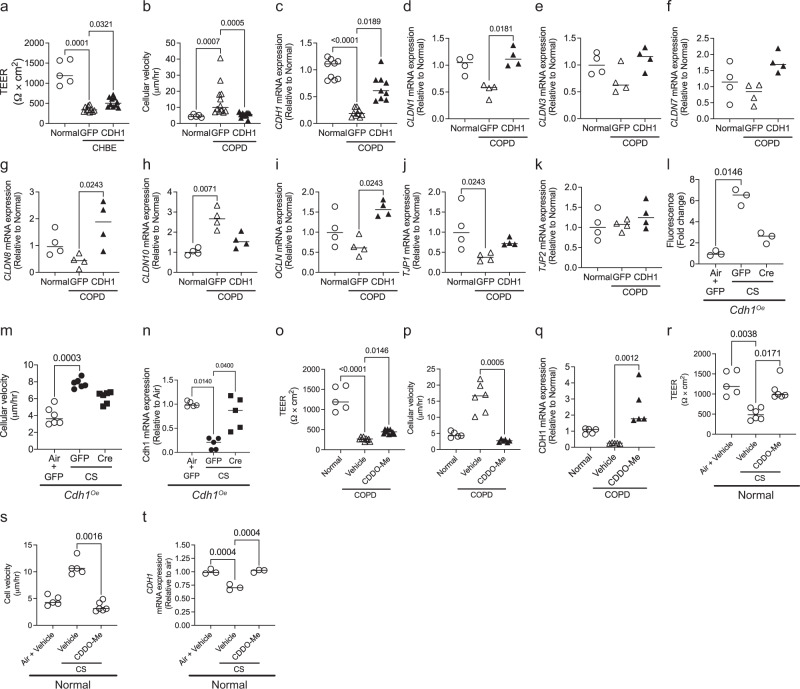
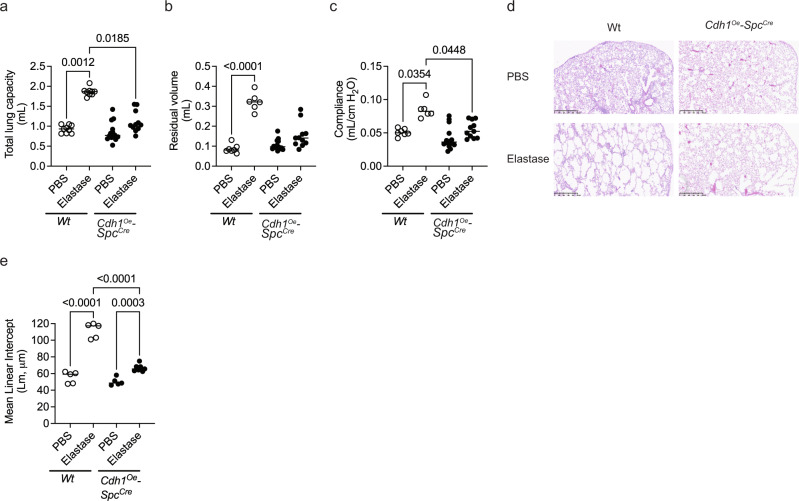
Epithelial cells line the lung mucosal surface and are the first line of defense against toxic exposures to environmental insults, and their integrity is critical to lung health. An early finding in the lung epithelium of patients with chronic obstructive pulmonary disease (COPD) is the loss of a key component of the adherens junction protein called E-cadherin. The cause of this decrease is not known and could be due to luminal insults or structural changes in the small airways. Irrespective, it is unknown whether the loss of E-cadherin is a marker or a driver of disease. Here we report that loss of E-cadherin is causal to the development of chronic lung disease. Using cell-type-specific promoters, we find that knockout of E-cadherin in alveolar epithelial type II but not type 1 cells in adult mouse models results in airspace enlargement. Furthermore, the knockout of E-cadherin in airway ciliated cells, but not club cells, increase airway hyperreactivity. We demonstrate that strategies to upregulate E-cadherin rescue monolayer integrity and serve as a potential therapeutic target.


Conflict of interest statement

The authors declare no competing interests.

Figures

Fig. 1
Fig. 1. In vivo E-cadherin knockdown in mice lung contributes to increased lung morphometry and decreased lung function.
Representative immunofluorescence of E-cadherin (Red) and DAPI (Blue) in mice lungs showing knockdown of E-cadherin in adeno-Cre (Ad5CMVCre-eGFP) intratracheally instilled group compared to adeno-Ctrl (Ad-5CMVeGFP) after a 10 days (scale bar of 50 µm) and b 1 month (scale bar of 100 µm) with 10× objective. c Decreased fluorescence intensity of E-cadherin in the mice lungs intratracheally instilled with adeno-Cre compared to adeno-Ctrl. Increased terminal airway/airspace enlargement as observed by d H & E staining (representative image) of mice lung parenchyma at 5× (scale bar of 500 µm), and e increased mean linear intercepts (Lm). Lung function was analyzed, where knockdown of E-cadherin with 1-month instillations of adeno-Cre compared to adeno-Ctrl in Cdh1 flox mice (Cdh1fl/fl) caused f total lung capacity was increased, g residual volume was not altered, and h compliance was increased. Immunofluorescence of E-cadherin (Red) and DAPI (Blue) in mice lungs showing knockdown of E-cadherin among adeno-Cre intratracheal instilled group compared to adeno-Ctrl in Cdh1fl/fl mice after 2-months and 3-months at 10× (scale bar of 100 µm) as observed in i representative immunofluorescence images (Left panel—2 months of instillations, Right panel—3 months of instillations) and j fluorescence intensity of E-cadherin (Top panel—2 months of instillations, Bottom panel—3 months of instillations). Increased terminal airway/airspace enlargement as observed in k H & E staining at 5× (scale bar of 500 µm) l increased Lm in adeno-Cre as compared to adeno-Ctrl instilled Cdh1fl/fl mice (Left panel—2 months of instillations, Right panel – 3 months of instillations). Increased m total lung capacity, n residual volume, and o compliance in E-cadherin knockdown due to 2-months (left panel) and 3-months (right panel) instillations of adeno-Cre in Cdh1fl/fl mice compared to adeno-Ctrl. Data is expressed as median bars and generated from 5 to 11 mice per group. Kruskal-Walli’s test followed by Dunn’s multiple comparison test was performed to compare the lung function tests (total lung capacity, residual volume, and compliance), whereas the Mann-Whitney test was performed to assess fluorescence intensity of E-cadherin and Lm. P < 0.05 were considered statistically significant. NI: Not instilled Cdh1fl/fl mice.
Fig. 2
Fig. 2. In vivo E-cadherin knockdown in the alveolar type, I (AT1) and alveolar type II (AT2) cells have differential effects on mouse lung function and histology.
To knock down E-cadherin in the AT1 cells of mice lungs, Cdh1fl/fl-AgerCre mice were fed a tamoxifen diet (TAM) for 1 month. These were compared to Cdh1fl/fl-AgerCre mice receiving a normal chow diet (ND) and Cdh1fl/fl-AgerWT receiving TAM control mice. a Total lung capacity, b compliance, and c residual volume were decreased in E-cadherin knockdown in AT1 cells of mice lung. No difference in lung histology was observed by d H & E staining (representative image at 5X with a scale bar of 500 µm) and e quantified mean linear intercepts (Lm) after E-cadherin knockdown in AT1 cells. To knock down E-cadherin in the AT2 cells of mice lungs, Cdh1fl/fl-SpcCre mice were fed TAM for 1 month. These were compared to Cdh1fl/fl-SpcCre, mice receiving ND. f Total lung capacity was increased, g compliance was increased, and h without significant changes in residual volume in E-cadherin knockdown in AT2 cells of mice lungs. Lung histology shows airspace enlargement as observed by i H & E staining (representative image at 5× with a scale bar of 500 µm) and j an increase in Lm after E-cadherin knockdown in AT2 cells. Data is expressed as median bars and generated from 5 to 15 mice per group. Kruskal-Walli’s test followed by Dunn’s multiple comparison test was performed to assess total lung capacity, compliance, and residual volume in E-cadherin knockdown in AT1 cells. Mann-Whitney test was performed to assess Lm of AT1 and AT2, and lung function tests (total lung capacity, compliance, and residual volume) in E-cadherin knockdown in AT2 cells. Data is generated from 5 to 14 mice per group. P < 0.05 were considered statistically significant.
Fig. 3
Fig. 3. Knockdown of E-cadherin decreases the regeneration of epithelium in the mice lungs.
Regeneration of epithelium was assessed by BrdU staining. (a) Representative image at 10X (scale bar of 50 µm) of Cdh1fl/fl mice instilled with adeno-Cre recombinase (Ad5CMVCre-eGFP) to knockdown E-cadherin for 3 months shows decreases in BrdU as compared to Cdh1fl/fl instilled with adeno-Ctrl (Ad-5CMVeGFP). Decreases in the fluorescence intensity of b E-cadherin and c BrdU in Cdh1fl/fl mice instilled with adeno-Cre as compared to Cdh1fl/fl mice instilled with adeno-Ctrl. Data is generated from eight mice. To knock down E-cadherin in the AT2 cells of mice lungs, Cdh1fl/fl-SpcCre mice were fed tamoxifen (TAM) for 30 days. These were compared to Cdh1fl/fl-SpcCre mice receiving a normal chow diet (ND). In vivo knockdown of E-cadherin in Cdh1fl/fl-SpcCre mice show decreases in BrdU expression as observed in the d representative images at 10X (scale bar of 25 µm), with decreases in the intensity of e E-cadherin and f BrdU in AT2 cells. Data is generated from five mice. Undifferentiated normal basal epithelial cells were transfected with Ad-GFP-U6-h-CDH1-shRNA to knock down E-cadherin, and undifferentiated COPD cells were transfected with Ad-GFP-U6-h-CDH1 to overexpress E-cadherin. We compared to respective undifferentiated Normal/COPD with Ad-GFP. g Representative image at 40× (scale bar of 25 µm) and h quantification showing decreased BrdU intensity in the normal epithelium with E-cadherin knockdown (Normal + shCDH1) and COPD at baseline (COPD + GFP) as compared to Normal + GFP. Also, COPD with overexpressed E-cadherin (COPD + CDH1) demonstrates increased BrdU intensity compared to COPD + GFP. Data are expressed as median bars and generated from three inserts from two donors.
Fig. 4
Fig. 4. Knockdown of E-cadherin decreases epithelial regeneration in human epithelial cells.
Immunofluorescence at 40× (scale bar of 50 µm) of COPD human bronchial epithelial cells differentiated at week one to three of air–liquid interface (ALI) show decreased expression of E-cadherin and β-tubulin (ciliated cells marker) expression, increase expression of MUC5AC (goblet cell marker), without any changes in Cytokeratin 14 (Basal cell marker), as compared to non-diseased human bronchial epithelial (normal) cells.
Fig. 5
Fig. 5. E-cadherin knockdown in the ciliated cells, but not club cells, contributes to increased airway hyperresponsiveness.
To knock down E-cadherin in the ciliated cells of mice lungs, Cdh1fl/fl-Foxj1CreHet mice were fed tamoxifen (TAM) for 30 days. These were compared to Cdh1fl/fl-Foxj1CreHet mice receiving a normal chow diet (ND) and Cdh1fl/fl-Foxj1CreWT receiving TAM control mice. No change in a total lung capacity, b compliance, and c residual volume was observed in the ciliated cells with E-cadherin knockdown of mice lungs. Also, no changes were observed in d H & E staining (representative image at 5X with a scale bar of 500 µm), and e quantified mean linear intercepts (Lm) after E-cadherin knockdown in ciliated cells. f Increased airway hyperreactivity (AHR) in ciliated cells with E-cadherin knockdown. Data is expressed as median bars and representative of 5 to 9 mice. To knock down E-cadherin in the club cells of mice lungs, Cdh1fl/fl-Scbg1a1Cre mice were fed a TAM for 30 days. These were compared to Cdh1fl/fl-Scbg1a1Cre mice receiving an ND. No difference in g airway reactivity, and histology as observed in h H & E staining (representative image), and i MLI among Cdh1fl/fl-Scbg1a1Crereceiving a TAM and an ND. Data is expressed as median bars and generated from 5 to 9 mice. Kruskal-Wallis test followed by Dunn’s multiple comparison test was performed for total lung capacity, compliance, residual volume, and AHR in E-cadherin knock down in ciliated cells. Mann-Whitney test was performed for airway reactivity in E-cadherin knockdown in club cells and MLI values. P < 0.05 were considered statistically significant.
Fig. 6
Fig. 6. Knockdown of E-cadherin contributes to epithelial dysfunction.
To knock down E-cadherin in airways, mice tracheal epithelial cells (mTECs) from Cdh1fl/fl mice cultured at the air-liquid interface (ALI) were transfected with Ad5CMVCre-eGFP (Cre) at 2 × 109 pfu and these were compared to Ad-5CMVeGFP (Ctrl). mTECs transfected with Cre show reduction in E-cadherin as assessed by a mRNA expression of Cdh1 (encodes for E-cadherin), and b western blotting (representative image – left panel, and quantification – right panel). c Epithelial resistance was decreased, and d cellular velocity was increased in mTECs with E-cadherin knockdown. Data is expressed as median bars and generated of cells derived from 12 mice, 4 to 12 inserts. Normal human bronchial epithelial cells at ALI (normal controls) were transfected with Ad-GFP-U6-h-CFL1-shRNA (shCDH1) at 1.5 × 109 pfu to knock down E-cadherin and these were compared to control adenovirus (Ad-GFP-U6-shRNA, GFP). Normal control cells transfected with shCDH1 show reduced e mRNA of CDH1 (encodes for E-cadherin) and f protein expression of E-cadherin (representative blot—left panel, and quantified blot—right panel). Assessment of the epithelial barrier function indicates that g monolayer resistance was decreased, h a trend towards increased permeability, and i cellular velocity was increased in control cells with knockdown of E-cadherin. Data is expressed as median bars and representative of 5 to 10 inserts per condition. Mann-Whitney test was performed and P < 0.05 was considered statistically significant.
Fig. 7
Fig. 7. In vitro overexpression of E-cadherin or by activating the Nrf2 pathway protects E-cadherin expression and restores epithelial function in COPD and cigarette smoke (CS) injured epithelia.
COPD cells at 4 to 6 weeks ALI were transfected Ad-GFP-U6-h-CDH1 (CDH1) to overexpress E-cadherin or Ad-GFP (GFP) as control at 2 × 109 pfu. COPD cells transfected with Ad-CDH1 result in a increased epithelial resistance, b reduced cellular velocity of COPD cells, and c increased mRNA expression of CDH1. Overexpression of E-cadherin in COPD cells dg increased mRNA expression of claudins—CLDN1, CLDN3, CLDN7, and CLDN8, h decreased mRNA expression of CLDN10, i increased mRNA expression of occludin (OCLN), j increased mRNA expression of tight junction protein 1 (TJP1), and k TJP2 was not altered. Data is expressed as median bars and generated from 4 to 12 transwells per condition from two donors. To induce the over-expression of E-cadherin in Cdh1 knock-in mice, mice tracheal epithelial cells (mTECs) were transfected with adeno-Cre (Ad5CMVCre-eGFP) at 2 × 109 pfu and were exposed to CS for 10 days. Overexpression of E-cadherin in mTECs protects against CS-induced epithelial functional phenotypes by l decreasing monolayer permeability, m decreasing the cellular velocity, and n protecting Cdh1 mRNA downregulation due to CS exposure. Data for lm involves three to six transwells per condition. COPD cells treated with CDDO-Me restore epithelial function by o improving the epithelial resistance, p decreasing the cellular velocity, and q increasing the CDH1 mRNA expression of COPD cells as compared to age and gender-matched non-diseased epithelium (normal controls). Similarly, cigarette smoke (CS) exposed to healthy normal cells treated with CDDO-Me r restores epithelial resistance, s decreases cellular velocity, and t protects against CDH1 mRNA downregulation due to CS exposure. (Data for ot is generated from 3 to 6 transwells from 2 donors). For the panels the same data for normal are used for ak, and ot in the figure. Data are expressed as median bars. Kruskal-Wallis test, followed by Dunn’s multiple comparison test was performed. P < 0.05 were considered statistically significant.
Fig. 8
Fig. 8. Overexpression of E-cadherin in AT2 protects against elastase-induced injury.
No difference in a total lung capacity, b residual volume, and c compliance among mice overexpressing E-cadherin in AT2 cells (Cdh1Oe-SpcCre) instilled with elastase as compared to Cdh1Oe-SpcCre with PBS and wild-type (Wt) instilled with elastase. d H&E staining (representative image) and e quantitative MLI showed a reduction in airspace enlargement as compared to Cdh1Oe-SpcCre instilled with PBS and Wt instilled with elastase. Data are expressed as median bars and generated from 5 to 14 mice. Kruskal-Wallis test, followed by Dunn’s multiple comparison test was performed. P < 0.05 were considered statistically significant.

References

    1. Ridley C, Thornton DJ. Mucins: the frontline defence of the lung. Biochem. Soc. Trans. 2018;46:1099–1106. - PMC - PubMed
    1. Niessen CM, Leckband D, Yap AS. Tissue organization by cadherin adhesion molecules: dynamic molecular and cellular mechanisms of morphogenetic regulation. Physiol. Rev. 2011;91:691–731. - PMC - PubMed
    1. Schneider MR, Kolligs FT. E-cadherin’s role in development, tissue homeostasis and disease: Insights from mouse models: tissue-specific inactivation of the adhesion protein E-cadherin in mice reveals its functions in health and disease. BioEssays. 2015;37:294–304. - PubMed
    1. Nishida K, et al. Cigarette smoke disrupts monolayer integrity by altering epithelial cell-cell adhesion and cortical tension. Am. J. Physiol. Lung Cell Mol. Physiol. 2017;313:L581–L591. - PMC - PubMed
    1. Chen A, et al. E-cadherin loss alters cytoskeletal organization and adhesion in non-malignant breast cells but is insufficient to induce an epithelial-mesenchymal transition. BMC Cancer. 2014;14:552. - PMC - PubMed

Publication types