. 2022 Oct 30;13(10):913.
doi: 10.1038/s41419-022-05358-8.

Glioblastoma cell motility depends on enhanced oxidative stress coupled with mobilization of a sulfurtransferase

Affiliations

Glioblastoma cell motility depends on enhanced oxidative stress coupled with mobilization of a sulfurtransferase

Mirca S Saurty-Seerunghen et al. Cell Death Dis. .

Abstract

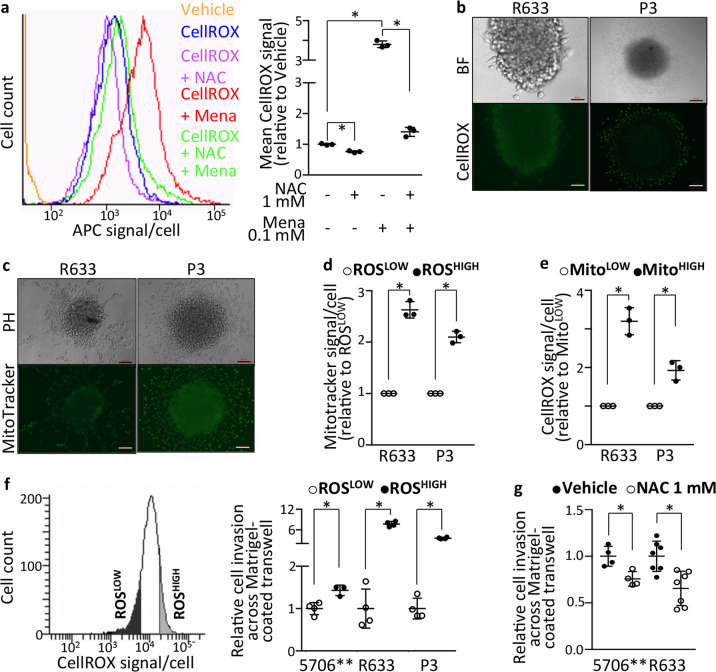
Cell motility is critical for tumor malignancy. Metabolism being an obligatory step in shaping cell behavior, we looked for metabolic weaknesses shared by motile cells across the diverse genetic contexts of patients' glioblastoma. Computational analyses of single-cell transcriptomes from thirty patients' tumors isolated cells with high motile potential and highlighted their metabolic specificities. These cells were characterized by enhanced mitochondrial load and oxidative stress coupled with mobilization of the cysteine metabolism enzyme 3-Mercaptopyruvate sulfurtransferase (MPST). Functional assays with patients' tumor-derived cells and -tissue organoids, and genetic and pharmacological manipulations confirmed that the cells depend on enhanced ROS production and MPST activity for their motility. MPST action involved protection of protein cysteine residues from damaging hyperoxidation. Its knockdown translated in reduced tumor burden, and a robust increase in mice survival. Starting from cell-by-cell analyses of the patients' tumors, our work unravels metabolic dependencies of cell malignancy maintained across heterogeneous genomic landscapes.


Conflict of interest statement

The authors declare no competing interests.

Figures

Fig. 1
Fig. 1. Grouping GB cells from distinct patients according to their motility potential.
a Schematic outline of the computational analytical strategy. b Significant correlations between expressions of the ten genes of the motility signature (p < 0.01). c Malignant cell clustering based on the motility signature. d Different combinatorial expressions of the signature genes characterize each cluster. e Each cell cluster contains cells coming from distinct tumors (NMI Score=0.11). f Identification of cell groups with the highest and lowest mean motility scores (C6: MHIGH, C2: MLOW). *Clusters statistically different from each of the other clusters, p-value < 0.01, one-way ANOVA, Tukey’s multiple comparisons test. NS: non-significant. g Motility-related terms highlighted by ontology analysis of genes overexpressed in MHIGH versus MLOW cells. Genes overexpressed with fold change ≥2. BH-adjusted p-value < 0.05. BP biological processes, CC cellular components, MF molecular functions. h Enrichment in EMT, oRG, and TEAD gene modules previously associated with GB cell motility in MHIGH cells. p < 0.001, hypergeometric test. i Linear regression model between motility score and EMT, oRG and TEAD scores. p < 0.0001. j Higher EMT, oRG and TEAD scores in MHIGH versus MLOW cells. *p < 0.0001, Mann–Whitney test. bg, i, j: N-S dataset analysis. See also Figs. S1–5 and Tables S1–3.
Fig. 2
Fig. 2. Metabolic reprogramming of cells with high motile potential.
a KEGG pathway analysis of metabolism genes overexpressed in MHIGH cells versus MLOW cells highlights enrichment in pathways involved in energy production, oxidative stress response, extracellular matrix (ECM) modeling, and membrane composition rearrangements. BH-adjusted p-value < 0.05. N-S dataset analysis. b Inferred trajectory of GB cells from low to high motility. Cells colored by motility clusters (top panel) and motility score (bottom panel). MPST marks the path crossroad between low and high motile potential. N-S dataset analysis. c MPST overexpression in GB tissues (n = 163) versus normal brain tissues (n = 207). TCGA RNA-seq dataset, GEPIA2 website. One-way ANOVA test, *BH-adjusted p-value < 0.05. d Schematic representation of the metabolic pathways overrepresented in MHIGH cells compared to MLOW cells (created with BioRender.com). See also Tables S4 and S5.
Fig. 3
Fig. 3. Enhanced ROS production and mitochondrial mass characterize motile cells.
a Decreased CellROX Deep Red fluorescent signal in PDC treated with the anti-oxidant NAC (1 mM, 1 h) and increased signal in PDC treated with the ROS generator menadione (Mena, 0.1 mM, 30 min). 5706**-PDC. Mean ± SD, n = 3 independent biological samples, *p < 0.05, unpaired t-test with Welch’s correction. b Higher ROS production in cells migrating out of spheroids. Brightfield (top panel) and CellROX Green signal (488 nm, bottom panel) imaging. Scale bars = 50 µm (R633) and 200 µm (P3). c Higher mitochondrial mass detected with MitoTracker Green reagent in cells migrating out of spheroids. R633- and P3-PDC. Phase contrast (top panel) and MitoTracker signal (488 nm, bottom panel) imaging. Scale bars = 200 µm. d, e Higher mitochondrial mass in cells with high ROS production (d), and higher ROS production in cells with high mitochondrial mass (e). R633- and P3-PDC. FACS analysis. Mean ± SD, n = 3 independent biological samples, *p < 0.05, unpaired t-test with Welch’s correction. f Higher invasive properties of cells with high ROS production. 5706**, R633 and P3 PDC. Left panel: example of FACS-sorting of PDC into ROSLOW and ROSHIGH fractions. Right panel: cell invasion across Matrigel-coated transwells, mean ± SD, n = 3–4 independent biological samples, *p < 0.05, unpaired t-test with Welch’s correction. g Decreasing ROS levels in GB-PDC using 1 mM NAC decreases cell invasion. 5706** and R633 PDC. Cell invasion across Matrigel-coated transwells, mean ± SD, n = 4–7 independent biological samples, *p < 0.05, unpaired t-test with Welch’s correction. See also Fig. S6A–C.
Fig. 4
Fig. 4. MPST enzymatic activity is required for GB cell motility.
a MPST immunolabeling (orange) of GB cells migrating out of PDC spheroids or GBOs. Nuclei DAPI staining in blue. Upper images illustrate the 2.5D intensity plot of DAPI (blue) and MPST (orange) signals across and around spheroids during migration on Matrigel (ZEN software, Zeiss). Individual peaks represent absolute signal intensities of each pixel. Graph: quantification of the percentage of MPST-immunoreactive cells in PDC-spheroids and GBO within the spheroid core (C), at the spheroid periphery (P), and away from the spheroids (A), as indicated with the dotted double arrows in the adjacent microphotograph. Mean ±SD, n = 3, *p < 0.05, Newman-Keul multiple comparisons test. b MPST knockdown decreases cell migration on Matrigel. Microphotographs illustrate cell migration assays, scale bars = 200 µm, solid line = spheroid core, dotted line = migration area. Graph: quantification at 7 h (5706**) or 24 h (R633 and P3) post-seeding, mean ± SD, n = 10-41 independent biological samples, Mann–Whitney test, *p < 0.05. Inset above graph illustrates decreased MPST protein levels in shMPST-PDC (western blot analysis, MW: 33/35 kDa). c MPST knockdown impairs cell migration through microfluidics chip tortuous channels. P3-PDC co-expressing shMPST and GFP were loaded together with equal numbers of shControl-PDC. Only rare shMPST-PDC (green cells) cross the microchip channels, contrary to shControl-PDC (DAPI+/GFP-). Scale bar = 200 µm. Graph: distances traveled by the cells over 24 h, mean ± SD, n = 32–40 from 4 independent biological samples, *p < 0.05, Mann–Whitney test. d MPST knockdown decreases cell invasion into collagen. Microphotographs illustrate invasion assays, scale bars = 200 µm. Graph: quantification of the invasion after 24 h (R633- and P3-PDC) or 40 h (5706**-PDC), mean ± SD, n = 4–8 independent biological samples, *p < 0.05, Mann–Whitney test. e MPST knockdown decreases cell invasion across Matrigel-coated transwells. 5706**-, R633- and P3-PDC invasion assessed 24 h post-seeding, mean ± SD, n = 4–8 independent biological samples, *p < 0.05, Mann–Whitney test. f Inhibiting MPST enzymatic activity using the pharmacological inhibitor I3-MT-3 decreases cell migration on Matrigel. Cells treated with 200 µM I3-MT-3 or vehicle for 72 h (R633, P3) or 45 h (GBO). Migration assessed 48 h (R633, P3) and 45 h (GBO) post-seeding. Mean ± SD, n = 5–8 independent biological samples, *p < 0.05, Mann–Whitney test. g Inhibiting MPST enzymatic activity with I3-MT-3 decreases cell migration into microfluidic chips. Graph: greatest distances traveled by the cells 24 hr post-seeding. 5706**-PDC, mean ± SD, n = 20 from two independent biological samples, *p < 0.05, Mann–Whitney test. See also Figs. S6D-I and S7.
Fig. 5
Fig. 5. MPST knockdown decreases protein persulfidation, decreases tumor burden, and increases mice survival expectancy.
a Schematic representation of MPST catalytic activity, with the successive transfer of the SH group from its substrate 3-mercaptopyruvate, first to the enzyme itself, and then to protein (P) cysteine residues. b Decreased protein persulfidation (P-SSH) levels in shMPST-PDC vs shControl-PDC. R633 and P3 PDC. In-gel detection of persulfidation levels. Dimedone switch method with Cy7.5 as a P-SSH reporting molecule. P-SSH levels calculated as a ratio of Cy7.5/NBF-protein adducts signal (488 nm), mean ± SD, n = 3 independent biological samples, *p < 0.05, unpaired t-test. c Decreased protein persulfidation levels upon cell treatment with the MPST inhibitor I3-MT-3. R633 PDC. In-gel detection and calculation of P-SSH levels as in b. Mean ± SD, n = 3 independent biological samples, *p < 0.05, unpaired t-test. d MPST knockdown does not prevent tumor initiation. Bioluminescent analyses. 5706** and P3 PDC. n = 6 mice per group. DPG: days post-graft. e MPST knockdown decreases tumor burden as shown by quantification of the tumor bioluminescent signals. Mean ± SD, n = 6 mice per group, *p < 0.01, Mann–Whitney test. See also Fig. S6L. f. MPST knockdown results in a significant survival benefit. Kaplan–Meier survival curves, n = 6 mice per group, Log-rank (Mantel-Cox) test.

References

    1. Viale A, Corti D, Draetta GF. Tumors and mitochondrial respiration: a neglected connection. Cancer Res. 2015;75:3685–6. doi: 10.1158/0008-5472.CAN-15-0491. - DOI - PubMed
    1. Badr CE, Silver DJ, Siebzehnrubl FA, Deleyrolle LP. Metabolic heterogeneity and adaptability in brain tumors. Cell Mol Life Sci. 2020;77:5101–19. doi: 10.1007/s00018-020-03569-w. - DOI - PMC - PubMed
    1. Pavlova NN, Zhu J, Thompson CB. The hallmarks of cancer metabolism: still emerging. Cell Metab. 2022;34:355–77. doi: 10.1016/j.cmet.2022.01.007. - DOI - PMC - PubMed
    1. Stupp R, Taillibert S, Kanner A, Read W, Steinberg D, Lhermitte B, et al. Effect of tumor-treating fields plus maintenance temozolomide vs maintenance temozolomide alone on survival in patients with glioblastoma: a randomized clinical trial. JAMA. 2017;318:2306–16. doi: 10.1001/jama.2017.18718. - DOI - PMC - PubMed
    1. Snuderl M, Fazlollahi L, Le LP, Nitta M, Zhelyazkova BH, Davidson CJ, et al. Mosaic amplification of multiple receptor tyrosine kinase genes in glioblastoma. Cancer Cell. 2011;20:810–7. doi: 10.1016/j.ccr.2011.11.005. - DOI - PubMed

Publication types